Overview of Proposed FY 2021 Budget - Presentation to the Stakeholder Alliance, January 9, 2020 - DC Water
←
→
Page content transcription
If your browser does not render page correctly, please read the page content below
Overview of Proposed FY 2021 Budget
Presentation to the Stakeholder Alliance, January 9, 2020
District of Columbia Water And Sewer Authority
This Budget
Begins the implementation of the “Modified Baseline”, and adds additional funds to
reach 1.5% replacement plans for water and sewer infrastructure within the ten-year
plan, balancing infrastructure renewal and affordability

Increases funds for fleet purchases by 60% to reduce the backlog by investing $12
million over two years to help ensure that crews have the equipment that they need

Adds five positions for the DC Water Consumer Protection Amendment Act of 2018
to meet additional workload requirements

Restructures Customer Service and targets additional training to better serve our
customers

Continues capital procurement reform to lower the cost of delivering the capital
program supported by adding five capital procurement professionals

Invests $0.5 million in the Apprenticeship Program to support fifteen entry level
positions

Advances LeadFree DC, through a partnership with DC

                                                                                                2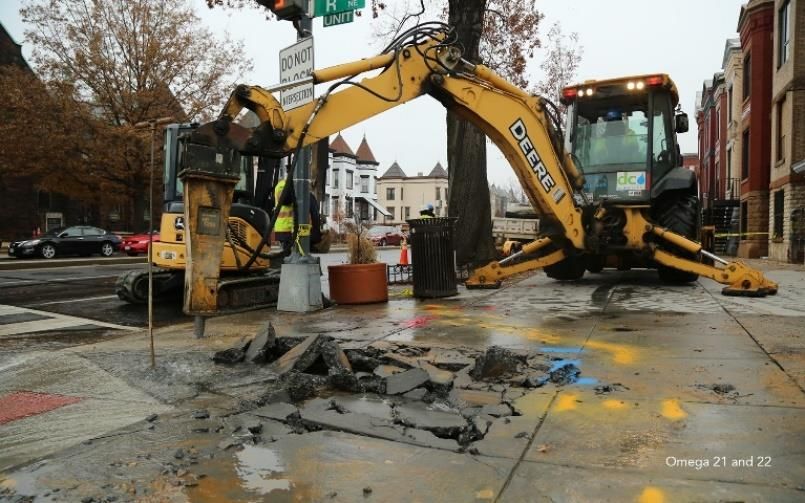
This Budget
The10-year capital program:
Fully funds the Clean Rivers program to meet all consent decree deadlines
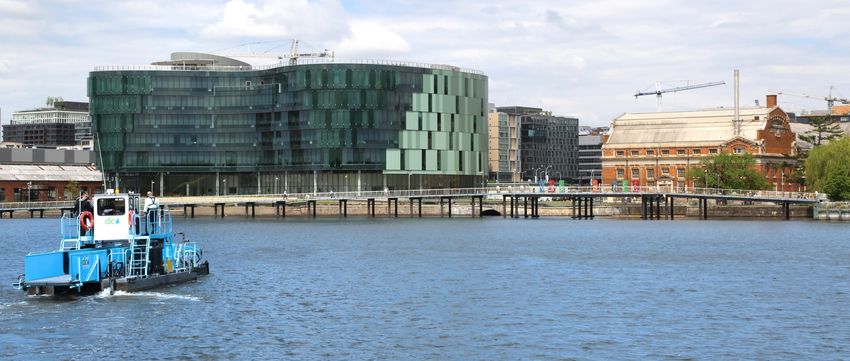
Funds non-process facilities including the new Fleet and Sewer Facilities,
renovations to the Historic Main Pump Station, and restoration of the
Main & O campus seawall
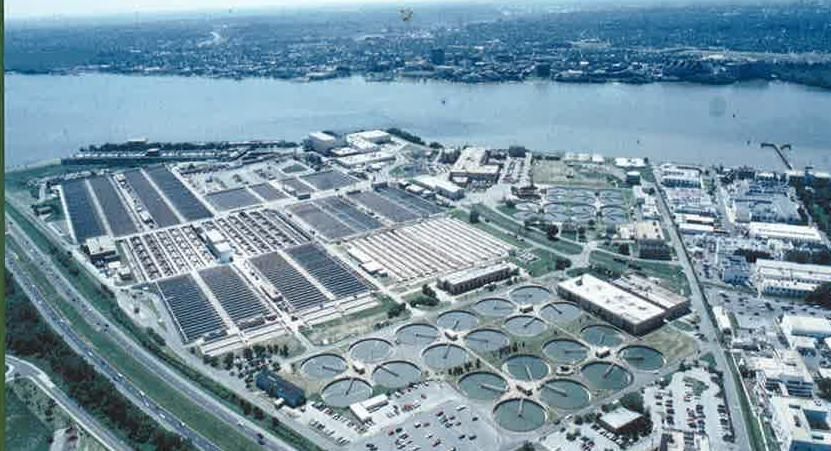
At Blue Plains funds upgrades to Screens, Grit and Primary Facilities, and
Process Control Computer System, Efficiency Improvements, and Long-term Screens, Grit & Primary Facilities Upgrades
Concrete Rehabilitation projects
Advances major rehabilitation of sanitary collection sewers, upgrades
to sewer pump stations, rehabilitation of the Potomac Interceptor and
increased funding to ramp up to 1.5% replacements per year starting
FY 2027 and onwards for the small diameter water mains and small
sewer lines
Includes carryover from prior year to complete the Enterprise Resource
Planning (ERP) and Advanced Meter Infrastructure (AMI) projects, and
increased funding for Fleet, pumps and other equipment Large Equipment
3
This Budget
Holds the line on operating budget expenses, and FY 2021 budget is
within the previous financial plan forecast
Repurposes existing vacancies to target higher priority resource
requirements
Delivers on rate increases that are smaller than previously forecasted
Two-year rate proposal, and rate forecast through FY 2029 helps
provide better predictability for customers
Takes advantage of historically low interest rates to reduce the cost
of borrowing for the capital program
Applies $13 million in Rate Stabilization Funds over FY 2021 and
FY 2022 to benefit customers
Continues the Clean Rivers Impervious Area Charge (CRIAC) shift
Adjusts metering fee to appropriately recover costs
Continues partnership with the District
 • Makes the CAP2 program permanent
 • Requests that the District continue Non-profit relief program and CAP3             4
Operating Budget Requests
                         Enhancement Requests ~ $32 million
                          • $9.8 million for 53 new positions
           Operating
Revenue                   • $6.8 million increase in salaries and wages for all existing positions including
          Expenditures
                              vacancies and employee health benefit costs
                           • $3.4 million increase required for various operational needs at the Aqueduct
                           • $3.3 million for the Environmental Impact Bond Fee and $0.2 million Green
                              Infrastructure Certification program
                           • $2.1 million increase for additional security guards, fire suppression and detection
                              system and maintenance of security systems
                           • $1.9 million increase in maintenance of automotive, buildings, HVAC, elevators,
                              warranties and other equipment
                           • $1.7 million net increase for telecom and software maintenance needs
                           • $1.5 million increase in credit card fees, maintenance of the billing system, the new
                              customer feedback system and CAP administration
                           • $1.3 million increase for various professional services (public outreach and water
                              quality reporting requirements, custodial supplies and spare parts for new facilities)

                                                                                                                 5
Tough Choices

To close the budget gap, approximately $13 million was reduced from enhancement requests with tough
choices made to ensure that we continue to deliver the best service to our customers

  Reduced personnel    Reviewed chemical                                             Across the board
   costs, mainly the        costs, made      Worked with         Aligned overall         review of
     new position      modest reduction      Washington            budget with       contractual costs,
     requests for       to offset increase   Aqueduct to       historical spending   and allocation of
    operations and        in maintenance     reduce their       for core business       funding to
  rightsized vacancy     requirement for       request              functions           prioritized
        funding             new facilities                                            enhancements

                                                                                                          6
Proposed Capital Improvement
          Program

                               7
The CIP
The proposed 10-year disbursements (FY 2020 - FY 2029) of $5.45 billion increases
investment in our aging infrastructure
  Capital Construction Projects - $4.92 billion
   • $1.2 billion fully funds the DC Clean Rivers’ project to meet Consent Decree requirements
   • $57 million increase in the Sewer Service area to ramp up to 1.5% small sewer lines replacement from FY 2027
     onwards, ten-year total of $1.2 billion in Sewer
   • $102 million increase in the Water Service area to ramp up to the 1.5% of small diameter water mains
     replacement per year from FY 2027 onwards, ten-year total of $1.1 billion in Water
   • $55 million for Efficiency Improvement projects starting FY 2021
  Additional Capital Programs - $528 million
   • $333 million for capital equipment items to meet purchases/replacement of mechanical equipment, operational
     facilities, vehicle equipment, office renovations, and IT software/hardware
   • $195 million for DC Water’s share of WAD’s infrastructure improvements to achieve established service levels
                                                                                                                    8
10-Year Engineering CIP Options Compared
     Service Area                Approved Baseline $4.4B                     *Proposed Baseline $4.9B                        Asset Management                               Fully Funded
                                       (FY19-28)                                    (FY20-29)                                 $5.4B (FY19-28)                              $5.8B (FY20-29)
 Clean Rivers                  Fully funded to meet Consent Decree         Fully funded to meet Consent Decree         Fully funded to meet Consent Decree         Fully funded to meet Consent Decree

 Wastewater                    Fully funded to meet NPDES Permit           Fully funded to meet NPDES Permit           Fully funded to meet NPDES Permit and       Fully funded to meet NPDES Permit
                               and established levels of service           and established levels of service           established levels of service               and established levels of service

 Stormwater                    Fully funded                                Fully funded                                Fully funded                                Fully funded

 Water
  Pump Stations & Storage      Generally funded                            Generally funded                            Fully Funded                                Fully Funded
  Facilities
  Small Diameter Water         Underfunded; (Funded to meet 1%             Increased funding to ramp up to 1.5%        Fully funded to ramp up to 2%               Fully funded to ramp up to 2%
  Mains                        per year replacement level - [11            per year replacement level from FY 2027     replacement level                           replacement level
                               mi/year])                                   onwards. [16.5 mi/year]                     [22 mi/year]                                [22 mi/year]

  Large Diameter Water         Generally funded                            Generally funded                            Generally funded                            Fully Funded
  Mains

 Sewer
   Pump Stations               Fully funded                                Fully funded                                Fully funded                                Fully funded

   Sewer Lines                 Underfunded (Funded to ramp up to           Increased funding to ramp up to 1.5%        Fully funded to ramp up to 2.3%             Fully funded to ramp up to 2.3%
   < 60” diameter              1.0% per year rehabilitation level [17.5    per year replacement level from FY 2027     rehabilitation level                        rehabilitation level
                               mi/year] by FY 2023                         onwards. [26 mi/year]                       [40 mi/year]                                [40 mi/year]

   Sewer Lines ≥ 60”           Generally Funded                            Generally Funded                            Generally Funded                            Fully funded

 Non Process                   Fully funded                                Fully funded                                Fully funded                                Fully funded

*Last year was called “Modified Baseline”, this year Proposed Baseline                                                                                                                             9
‘Generally Funded’ = What we know or expect to find can be rehabilitated ‘Underfunded’ = What we know or expect to find is not all funded   ‘Fully Funded’ = All needs known or expected are met
Prioritization of Spending – Capital Projects
Proposed Baseline CIP
Higher Priority Lower Priority
1A 2A 2B 2C 2D 3A 3B
Good
High Profile Good Engineering
Mandates Health & Safety Board Policy Potential Failure Engineering
Good Neighbor High Payback
Lower Payback
Agreements, Regulatory Undertaken as a Related to Facilities
standards, Court orders, Required to result of the in danger of failing,
Address Public Need to fulfill Mission and Lower priority
Issues and Permits address Public Board's or critical to
concerns upgrade Facilities Projects
requirements, Stipulated Safety commitment to meeting permit
($000's)
Agreements, Etc. outside agencies requirements
FY 2019 $174,384 43% $4,332 $63,844 $30,328 $2,280 $69,201 17% $60,636 $405,004
FY 2020 147,209 32% 5,490 72,762 24,593 821 114,837 25% 88,405 $454,118
FY 2021 179,572 32% 12,019 59,755 36,803 5,403 164,558 29% 100,536 $558,645
FY 2022 129,073 28% 9,469 53,835 28,274 2,403 130,057 28% 108,055 $461,168
FY 2023 67,830 17% 18,788 41,514 21,997 190 136,794 35% 105,384 $392,496
FY 2024 60,177 15% 19,009 46,213 22,496 788 169,952 43% 75,684 $394,318
FY 2025 148,771 28% 13,180 49,037 23,766 2,837 191,721 36% 108,272 $537,584
FY 2026 103,265 19% 6,062 83,507 21,349 105 210,855 39% 118,971 $544,115
FY 2027 88,890 16% 717 99,437 21,629 - 209,161 37% 151,501 $571,336
FY 2028 115,049 19% 1,516 104,227 18,768 - 207,451 34% 156,024 $603,035
Total $1,214,221 $90,582 $674,131 $250,004 $14,826 $1,604,588 $1,073,468 $4,921,820
% of Total 24.7% 1.8% 13.7% 5.1% 0.3% 32.6% 21.8%
- Cash disbursements basis
10Operating Expenditure
11FY 2021 Operating: Sources and Uses of Funds
$ in thousands
Sources - $733.7 Million Uses - $733.7 Million
Wholesale Other Pay-Go,
$81,986 Revenue Residential other
11.2% $64,608 $130,803 $115,457
ROW
8.8% 17.8% 15.7% Personnel
Metering Fee $5,100
0.7% Services
$15,405
$153,482
2.1% PILOT 20.9%
$17,272
Water System 2.4%
Replacement Contractual
Fee Cash Services
$39,717 Financed $88,532
Commercial
5.4% Capital 12.1%
$180,589
Improvements
Rate 24.6%
$30,355
Stabilization
4.1%
Fund
Water
$2,500
Purchases
0.3%
$36,250
Municipal & Federal Debt Service Small 4.9%
Housing Government Multi-Family $222,268 Equipment Chemicals
$30,318 $77,571 $110,241 30.3% Utilities and Supplies
$1,030
4.1% 10.6% 15.0% $27,911 $36,081
0.1%
3.8% 4.9%
12Operating Budget Trends
Core operations & maintenance (O&M) costs have been consistently stable with
average growth of 3% - 4% per year
• Approximately 73% of core O&M costs are fixed and non discretionary in nature
Debt service is one of the fastest growing components of the overall budget
• Represents 35% of the total operating budget in FY 2021
$ in thousands
Annual Operating Expenditures
$400,000
$300,000
$200,000
$100,000
$0
FY 2017 FY 2018 FY 2019 FY 2020 FY 2021
Actuals Actuals Actuals Approved Proposed
Core O&M $305,808 $318,162 $328,104 $348,594 $367,667
Non O&M $190,035 $213,659 $220,033 $243,895 $252,624
District Payments $21,057 $21,379 $21,702 $22,034 $22,372
13Operations & Maintenance Budget Drivers
Personnel Services – $177.9 million or increase of $7.2 million mainly for annualized salaries,
merit increase consistent with union agreement and increased costs in benefits
Chemicals & Supplies – $36.1 million or increase of $2.9 million mainly for major chemicals
(methanol, sodium bisulfite and ferric chloride) used in the wastewater treatment process
Contractual Services – $88.5 million or $6.6 million increase
Debt Service – $222.3 million or increase of $6.9 million due to existing debt and anticipated
FY 2020 new money issuance
PILOT & ROW – $22.4 million or increase of $0.3 million consistent with MOUs
Cash Financed Capital Improvements – $30.4 million or increase of $1.8 million
• PAYGO funding
Capital Labor Charges – $24.4 million or increase of $1.6 million
• Funds personnel costs incurred on capital projects and insourcing of engineering functions
14Rate Stabilization Fund
Budget proposes $13 million withdrawal over FY 2021 and FY 2022
• $8 million in debt service savings in the current fiscal year, plus remaining $5 million
withdrawal from Rate Stabilization Fund to be deposited in FY 2020
• Budget makes CAP2 program permanent
Apply $2.5 million in FY 2021 and $10.5 million in FY 2022
Management recommends a Rate Stabilization Fund target that is ten
percent of overall revenues
• During the last recession, from 2007 through 2011, there was a $41.8 million
reduction in Rate Stabilization Fund balance as the Board drew funds to reduce the
impact of rising rates
15Operating Revenue
16Historical and Projected Combined Rate Increases
14.0%
12.2%
12.0%
10.0% 9.2% 8.8%
Residential Bill Increase
8.4% 8.1% 7.3%
8.0%
5.8% 6.9% 8.3%
6.1% 6.2%
5.7% 5.8%
6.0% 5.2% 6.6% 6.7% 6.7%
4.4%
3.4% 4.1% 3.4% 5.2% 5.6%
4.0% 4.5% 4.5%
3.5%
2.0%
0.0%
FY FY FY FY FY FY FY FY FY FY FY FY FY FY FY FY FY
2013 2014 2015 2016 2017 2018 2019 2020 2021 2022 2023 2024 2025 2026 2027 2028 2029
Historical Last Year's Financial Plan (FY 2019 - FY 2028) FY 2021 Proposed Financial Plan (FY 2020 - FY 2029)
17Average Residential Customer Monthly Bill
Current Proposed Proposed
` Units FY 2020 FY 2021 FY 2022
(1)
DC Water Water and Sewer Retail Rates Ccf $ 66.25 $ 73.30 $ 78.92
DC Water Clean Rivers IAC (2) ERU 20.94 19.52 18.40
DC Water Customer Metering Fee 5/8" 3.86 4.96 7.75
(4)
DC Water Water System Replacement Fee 5/8" 6.30 6.30 6.30
Subtotal DC Water Rates & Charges $ 97.35 $ 104.08 $ 111.37
Increase / Decrease $ 5.01 $ 6.73 $ 7.29
(1)
District of Columbia PILOT Fee Ccf $ 2.76 $ 2.93 $ 3.04
(1)
District of Columbia Right-of-Way Fee Ccf 1.03 1.03 1.03
District of Columbia Stormwater Fee (3) ERU 2.67 2.67 2.67
Subtotal District of Columbia Charges $ 6.46 $ 6.63 $ 6.74
Total Amount Appearing on DC Water Bill $ 103.81 $ 110.71 $ 118.11
Increase / Decrease Over Prior Year $ 5.11 $ 6.90 $ 7.40
Percent Increase in Total Bill 5.2% 6.6% 6.7%
(1) Assumes average monthly consumption of 5.42 Ccf, or (4,054 gallons)
(2) Assumes average 1 Equivalent Residential Unit (ERU)
(3) District Department of the Environment stormwater fee of $2.67 effective November 1, 2010
(4) DC Water "Water System Replacement Fee" of $6.30 for 5/8" meter size effective October 1, 2015
18Projected Average Residential Customer Bill
Projected average monthly residential customer bill ranges from $104 in FY 2020 to
$180 in FY 2029
$180 Clean Rivers
$180 $170 IAC
$160
$160 $151
$143
$140 $137 Water & Sewer
Average Residential
$126 Charges
Monthly Bill ($)
$118
$120 $111
Customer
$104
$100 District of
Columbia Fees
$80 (PILOT, ROW
& Stormwater)
Customer
$60
Metering Fee
$40
Water System
$20 Replacement
Fee
$0
FY 2020 FY 2021 FY 2022 FY 2023 FY 2024 FY 2025 FY 2026 FY 2027 FY 2028 FY 2029
* Assumes average residential consumption of 5.42 Ccf, or 4,054 gallons, per month. Ccf = hundred cubic feet, or 748 gallons
19Customer Impacts
Residential
2020 2021 2022 2023 2024 2025 2026 2027 2028 2029
Base
Water & Sewer Rate (%) 11.5% 9.9% 7.8% 8.5% 7.5% 7.5% 7.5% 7.5% 7.5% 7.5%
CRIAC ($/ERU) $20.94 $19.52 $18.40 $19.58 $24.07 $23.07 $23.82 $24.56 $25.64 $26.78
Avg. Customer Bill ($) $104 $111 $118 $126 $137 $143 $151 $160 $170 $180
Avg. Customer Bill (%) 5.2% 6.6% 6.7% 6.7% 8.8% 4.4% 5.7% 5.8% 6.1% 6.2%
Multi-family
2020 2021 2022 2023 2024 2025 2026 2027 2028 2029
Base
Water & Sewer Rate (%) 11.5% 9.9% 7.8% 8.5% 7.5% 7.5% 7.5% 7.5% 7.5% 7.5%
CRIAC ($/ERU) $20.94 $19.52 $18.40 $19.58 $24.07 $23.07 $23.82 $24.56 $25.64 $26.78
Avg. Customer Bill ($) $1,341 $1,447 $1,538 $1,654 $1,791 $1,896 $2,022 $2,157 $2,304 $2,461
Avg. Customer Bill (%) 8.1% 8.0% 6.2% 7.6% 8.3% 5.9% 6.6% 6.7% 6.8% 6.8%
Commercial
2020 2021 2022 2023 2024 2025 2026 2027 2028 2029
Base
Water & Sewer Rate (%) 11.5% 9.9% 7.8% 8.5% 7.5% 7.5% 7.5% 7.5% 7.5% 7.5%
CRIAC ($/ERU) $20.94 $19.52 $18.40 $19.58 $24.07 $23.07 $23.82 $24.56 $25.64 $26.78
Avg. Customer Bill ($) $2,029 $2,163 $2,285 $2,456 $2,669 $2,814 $2,994 $3,189 $3,401 $3,629
Avg. Customer Bill (%) 6.8% 6.6% 5.7% 7.5% 8.7% 5.4% 6.4% 6.5% 6.7% 6.7%
20Next Steps
21Budget Adoption Calendar
Board Member Questions & Follow Up
• Submit budget-related questions to Board Secretary
• Board Secretary will distribute questions to appropriate staff
Stakeholder Alliance Discussion – January 9
Wholesale Customer Briefing – January 10
Committee Reviews, Recommendations & Actions – January & February
Environmental Quality DC Retail Water & Finance & Budget
& Operations Sewer Rates
FY 2020 - FY 2029 Capital Budget
Action Required Action Required
(Disbursements & Lifetime)
FY 2021 Operating Budget Action Required
Intent to Reimburse Capital Expenditures
Action Required
with Proceeds of a Borrowing
FY 2020 – FY 2029 Financial Plan Action Required Action Required
FY 2021 & 2022 Rates, Charges & Fees Action Required
Board Adoption – March 5 22Public Communication
Complete Budget Briefing available online at
https://www.dcwater.com/budget-review-
materials-library
23You can also read