Interim report | Q1 2019- Value people - Zalaris - Investor Relations
←
→
Page content transcription
If your browser does not render page correctly, please read the page content below

– Value people

Interim report | Q1 2019
8 May 2019

Presenters and agenda

1. Highlights
2. Financial performance in Q1/19
3. Market update and conclusion

Hans-Petter Mellerud   Nina Stemshaug
Founder and CEO        CFO

© zalaris 2019                          Page 2

Highlights | Strategy and operations

Growth in revenues and go live with major clients

•       Revenues of NOK 192.4 million and EBIT of
        NOK 6.5 million or 3.4%.
•       Launched several new customers with an
        annual contract value of approximately NOK
        20 million during the quarter.

•       Streamlining the organization towards
        coherent customer offerings and profitability.

•       Initiated actions to drive EBIT margin
        towards historic performance and a recurring
        target level of 10% ultimo 2019.

© zalaris 2019                           Page 3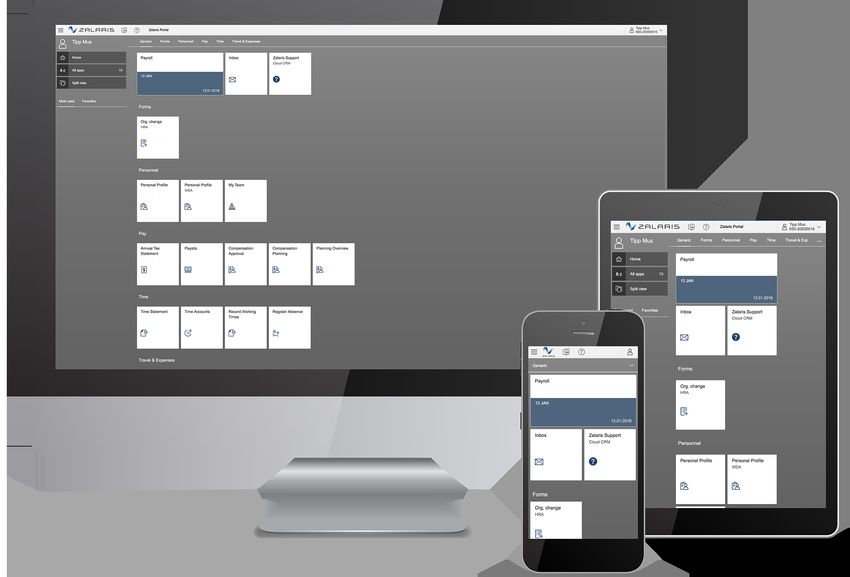
Highlights | Financial

Growth in revenues compared to Q1/18
                                                      • Revenues of 192.4 million, a y-o-y
                                                        increase of 3.3 percent – driven by growth
 Key figures
                                                        in the Managed Services segment
                                 Q1 2019              • Adjusted EBIT of NOK 6.5 million, down
 NOK million                  Q1/19 Q1/18               from NOK11.4 million in Q1/18
 Revenues                      192.4      186.2
 Adjusted EBIT1                  6.5       11.4            • Shortage of consulting capacity in Professional
 Profit for the period           6.2       11.4              Services led to increased expenses for external
 EPS (NOK)                      0.29       0.56              services

                                                           • To be mitigated through new hires and more
                                                             resources allocated to customer-oriented tasks

All amounts in NOK unless otherwise specified              • Several group-wide initiatives to reduce costs
1 EBIT before other costs
                                                             and increase utilization

                                                      • Q1/19 EBIT-margin slightly up Q/Q when
                                                        adjusting for positive year end assessments in
                                                        Q4/18

© zalaris 2019                                    Page 4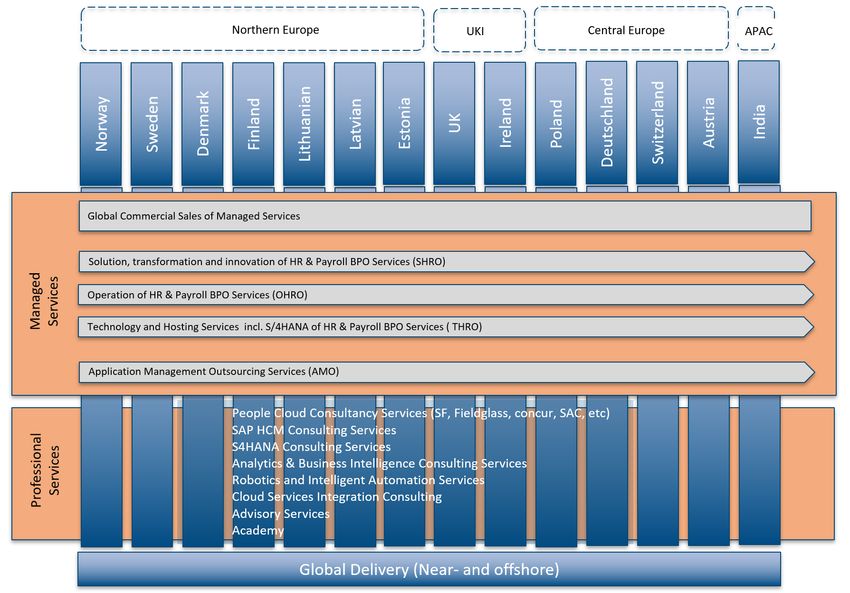
Geographical revenue split

Revenue growth in all geographies Q/Q

                  Distribution of revenues                          Northern Europe
                 by geography (in per cent)                         • Slight growth from NOK 107.4 million in Q1/18
                                                                       to NOK 107.8 million in Q1/19.
                                                                    • Price reductions in renewed contracts was
       4             2        3           4           5                compensated with an increased scope of
                                                                       deliveries both to new and existing customers.

      38            40       41          36          39             Central Europe
                                                                    • Increased by 4.1 NOK million from NOK 70.8
                                                                       million in Q1/18 to NOK 74.8 million in Q1/19.
                                                                    • Total growth of 7% compared to Q1/18, due to
                                                                       expanding services to a number of new
                                                                       customers.
      58            58       56          60          57
                                                                    UK & Ireland
                                                                    • Strong growth in revenues, from NOK 8.1
                                                                       million in Q1/18 to NOK 9.7 million in Q1/19.
   Q1 18           Q2 18   Q3 18       Q4 18       Q1 19            • Driven by ongoing delivery of significant
     Nordics & Baltics     Central Europe     UK & Ireland             projects from the UK, accompanied by
                                                                       increased sales closed in Q4/18.
       UK & Ireland included after acquisitions in Q4/17

         All amounts in NOK unless otherwise specified

© zalaris 2019                                             Page 5
Key financials
  First quarter 2019

Group revenues

 Quarterly revenues
                  Group revenues
                  (in NOK million)

    186           189 [VALU 194      192        • Revenues for Q1/19 amounted to 192.4
                        E]                        million, higher than Q1/18.

                                                • Year-on-year growth in the quarter was 3.3
                                                  % driven by growth in both segments.

                                                • Growth in revenues within all geographies.

                                                • Strong demand for consulting capacity in
                                                  Central Europe.

     Q1   Q2   Q3   Q4   Q1
    2018 2018 2018 2018 2019
All amounts in NOK unless otherwise specified

 © zalaris 2019                                   Page 7
Group EBIT
Group EBIT NOK 6.5 million
Group EBIT
(in NOK million)
[VALU § Group EBIT for the quarter was NOK 6.5 million,
E] compared to NOK 11.4 million in Q1/18.
10.0
§ Q1/19 was marked by increased expenses for external
services compared to Q1/18 – a result of temporary
6.5 reduction of internal consulting capacity within
Professional Services Segment.
6.1 % Profit margin 3.4 %
§ Net financial costs for the quarter were NOK 1.1 million,
1.5
including a non-cash foreign currency profit of NOK 8.3
million related to debt nominated in euro.
Q1/18 Q2/18 Q3/18 Q4/18 Q1/19
§ Total comprehensive income for the quarter was
negative by NOK 1.1 million, including a loss of NOK
7.4 million in currency translation differences.
-5.5
All amounts in NOK unless otherwise specified.
© zalaris 2019 Page 8
Financial position
Increase in assets compared to both Q1/18 and Q4/18
Cash and cash flows Q1/19
Changes in balance sheet and cash flows
(in NOK million)
120 § Increase in total assets by NOK 119.4 million since
Q1/18 and NOK 30.8 since Q4/18, to NOK 756.4
million at 31 March 2019.
100
§ Equity decreased by NOK 20.0 million and by NOK 3.6
- million from Q1/18 and Q4/18
80 -‐1.3
[VALUE
] -4,2 § Cash and cash equivalents were NOK 69.3 million as
107.8 -11.0 of the end of Q1/19, down from 107.8 million as of the
60
end of Q4/18.
§ Cash balance declined due to negative operating cash
40
69,3 flow after investments and interest payments of NOK
-26.3 million.
20
§ Net interest bearing debt increased from NOK 270.6
million at the end of the last quarter to NOK 299.0
0 million due to a negative cash flow for the quarter.
Beginning Operating Investing Net Foreign End of
of period activities activities financing exch. period
activities Difference
All amounts in NOK unless otherwise specified
© zalaris 2019 Page 9
Key financials | Business segment
            First quarter 2019
         Segment reporting includes
   only external revenues and external profit
Revenues by segment
Changes in segment reporting
• Change in reporting of business segments from Q1/19 to improve
visibility and reflect market trends, overlapping sales
• HR Outsourcing and Cloud Services merged into one segment,
Managed Services
• Organized as group wide business to speed growth and
adaptation in key markets.
• Consulting renamed to Professional Services
• Visualize recurring nature of revenues and long-term customer
relationships in this segment
© zalaris 2019 Page 11Revenues by segment
Growth in both segments
Managed Services Professional Services
(NOK million) (NOK million)
§ Represents 75% of Group revenue § Increased by NOK 1.4 million to NOK
since start of 2018 48.7 million in Q1/19 compared to
§ Revenues in Q1/19 amounted to NOK Q1/18
143.7 million (NOK 138.9 million), a y- § Strong growth within Central Eastern
o-y growth of 3.5 %. Europe.
§ Strongest contribution in the quarter § Increase for the segment as a whole
from Central Eastern Europe, due to reflects the continued increase in
expanded scope of deliveries and utilization, especially in the UK.
price adjustments
135 132 144 144
139
47 54 45 50 49
Q1 Q2 Q3 Q4 Q1 Q1 Q2 Q3 Q4 Q1
2018 2018 2018 2018 2019 2018 2018 2018 2018 2019
Change in reporting of business segments from Q1/19 to improve visibility and reflect market trends
© zalaris 2019 Page 12Adjusted EBIT by segment
Managed Services with positive margin trend compared
to the last two quarters
Managed Services Professional Services
(NOK million) (NOK million)
§ EBIT of NOK 15.3 million in Q1/19 § The EBIT of NOK 7.0 million was at
compared to NOK 18.8 million in the same level as Q1/18.
Q1/18
§ Increased use of freelancers due to
§ Positive margin trend compared with internal capacity issues resulted in
the two previous quarters increased personnel costs
19 17
15 15
10 11
7 7
0 0
Q1 Q2 Q3 Q4 Q1 Q1 Q2 Q3 Q4 Q1
2018 2018 2018 2018 2019 2018 2018 2018 2018 2019
Change in reporting of business segments from Q1/19 to improve visibility and reflect market trends
© zalaris 2019 Page 13Market update and concluding remarks
Streamlined organization with goal of focusing on customer needs,
addressing multi country growth ambition and reducing overhead

                                                 Centrally
  managed
  support

                                                 func3ons:

                                                 •   F&A

                                                 •   HR

                                                 •   IT
  and
  Infrastructure

                                                 •   Marke:ng
  and

                                                     Communica:ons


                                                 Group
  organiza3on
  for
  Managed

                                                 Services


                                                 Professional
  Services
  to
  define

                                                 balance
  between
  Local
  and
  Group


                                                 Entrepreneurial
  country
  managers

                                                 and
  profit
  center
  heads
  focusing
  on

                                                 local
  markets
  and
  sales


                                                 Consolida3ng
  exis3ng
  three

                                                 segments
  to
  two
  from
  Q1
  2019

                                                 with
  goal
  of
  crea:ng
  increased

                                                 transparency
  including
  visualizing

                                                 recurring
  nature
  of
  Professional

                                                 Services
  business


© zalaris 2019              Page 15
Streamlined organization with goal of focusing on customer needs, addressing multi country growth ambition and reducing overhead © zalaris 2019 Page 16
Streamlined organization with goal of focusing on customer needs,
addressing multi country growth ambition and reducing overhead

© zalaris 2019              Page 17
Streamlined organization with goal of focusing on customer needs,
addressing multi country growth ambition and reducing overhead

© zalaris 2019              Page 18
Market update
Developing Professional Services capabilities for the HR service
providers are vital for successful implementations of better solutions

• The demand after advisory services such
  as Zalaris’ have grown 20 % in five years

• Solutions and services for all kind of
  employees in all kind of ages demand
  competence and capacity

• Digital transformation consulting:
         – Pre- implementation services
         – Implementation services
         – Post-implementation services

                                                                      Adop3on
  of
  Advisory
  Services
  in
  MPHRO

• Traditional HR consulting
                                                                      Deals
  (Percentage
  of
  New
  Deals)

         – Define and improve performance in
           employee engagement and retention
         – Root cause analysis of attrition, attrition
           prediction, and prevention
         – Employee Value Proposition (EVP)
           creation, content creation, and
           communication

Illustra:on
  provided
  by
  Everest
  Group


© zalaris 2019                                              Page 19
Streamlined organization with goal of focusing on customer needs, addressing multi country growth ambition and reducing overhead © zalaris 2019 Page 20
Streamlined organization with goal of focusing on customer needs,
addressing multi country growth ambition and reducing overhead

                                                 Centrally
  managed
  support

                                                 func3ons:

                                                 •   F&A

                                                 •   HR

                                                 •   IT
  and
  Infrastructure

                                                 •   Marke:ng
  and

                                                     Communica:ons


                                                 Group
  organiza3on
  for
  Managed

                                                 Services


                                                 Professional
  Services
  to
  define

                                                 balance
  between
  Local
  and
  Group


                                                 Entrepreneurial
  country
  managers

                                                 and
  profit
  center
  heads
  focusing
  on

                                                 local
  markets
  and
  sales


                                                 Consolida3ng
  exis3ng
  three

                                                 segments
  to
  two
  from
  Q1
  2019

                                                 with
  goal
  of
  crea:ng
  increased

                                                 transparency
  including
  visualizing

                                                 recurring
  nature
  of
  Professional

                                                 Services
  business


© zalaris 2019              Page 21
Road to higher margins
Zalaris remains a growth company in mindset and structure.
However, our key priority for 2019 is to return to margin-levels from before the 2017-
acquisitions (delivering consistent 10% adjusted EBIT) ultimo FY 2019
• Target of reducing monthly costs with approx. NOK 4,7 mill. of which 75% in the
operating organization and 25% head office costs
• Key initiatives with estimated distribution of effects as % of total:
• Centralizing support functions as Finance, HR and IT to accelerate process
improvements, synergy realization and cost reductions resulting in:
• Reduced personnel costs - 50%
• Reduced IT costs – 16%
• Reducing costs for external advisors – 6%
• Converting internal resource usage to market facing capacity - 12 %
• Increasing offshore capability utilization - 12%
• Reducing non customer facing travel costs – 4%
• In addition, we target:
• Higher incremental margin and lower sales cost through focusing sales
efforts to improve scale utilization
• Medium term benefits from intelligent automation and digitization initiatives
© zalaris 2019 Page 22Concluding remarks A plan to reclaim margins • The key priority for Zalaris in 2019 is returning to margin-levels from before the 2017-acquisitions. • Target of consistent 10% adjusted EBIT ultimo FY2019 • Several initiatives to increase efficiency and reduce costs, including centralizing of support functions and increased offshore capability utilization © zalaris 2019 Page 23
Important notice

    This Presentation includes certain forward-looking statements relating to the business, financial performance and results of the Company and/or the industry
    in which it operates. Forward-looking statements relate to future circumstances and results and other statements that are not historical facts, sometimes
    identified by the words “believes”, “expects”, “predicts”, “intends”, “projects”, “plans”, “estimates”, “aims”, “foresees”, “anticipates”, “targets”, and similar
    expressions. The forward-looking statements contained in this Presentation, including assumptions, opinions and views of the Company or cited from third
    party sources, are solely opinions and forecasts which are subject to material risks, uncertainties and other factors that may cause actual events to differ
    materially from any anticipated development. Neither the Company nor any of its subsidiaries or any such person’s officers or employees provide any
    assurance that the assumptions underlying such forward-looking statements are free from errors, nor do any of them accept any responsibility for the future
    accuracy of the opinions expressed in this Presentation or the actual occurrence of the forecasted developments. The Company assumes no obligation,
    except as required by law, to update any forward-looking statements or to conform these forward-looking statements to its actual results.
    AN INVESTMENT IN THE COMPANY INVOLVES SIGNIFICANT RISK AND SEVERAL FACTORS COULD CAUSE THE ACTUAL RESULTS,
    PERFORMANCE OR ACHIEVEMENTS OF THE COMPANY TO BE MATERIALLY DIFFERENT FROM ANY FUTURE RESULTS, PERFORMANCE OR
    ACHIEVEMENTS THAT MAY BE EXPRESSED OR IMPLIED BY STATEMENTS AND INFORMATION IN THIS PRESENTATION. A NON-EXHAUSTIVE
    OVERVIEW OF RELEVANT RISK FACTORS THAT SHOULD BE TAKEN INTO ACCOUNT WHEN CONSIDERING AN INVESTMENT IN THE SHARES
    ISSUED BY THE COMPANY IS INCLUDED IN THIS PRESENTATION. SHOULD ONE OR MORE OF THESE RISKS OR UNCERTAINTIES MATERIALISE,
    OR SHOULD UNDERLYING ASSUMPTIONS PROVE INCORRECT, ACTUAL RESULTS MAY VARY MATERIALLY FROM THOSE DESCRIBED IN THIS
    PRESENTATION. THE COMPANY DOES NOT INTEND, AND DOES NOT ASSUME ANY OBLIGATION, TO UPDATE OR CORRECT THE INFORMATION
    INCLUDED IN THIS PRESENTATION.
    No representation or warranty (express or implied) is made as to, and no reliance should be placed on, any information, including projections, estimates,
    targets and opinions, contained herein, and no liability whatsoever is accepted as to any errors, omissions or misstatements contained herein, and,
    accordingly, neither the Company nor any of its subsidiaries nor any such person’s officers or employees accepts any liability whatsoever arising directly or
    indirectly from the use of this Presentation.
    The contents of this Presentation are not to be construed as legal, business, investment or tax advice. Each recipient should consult its own legal, business,
    investment or tax adviser as to legal, business, investment or tax advice. By attending or receiving this Presentation you acknowledge that (i) you will be solely
    responsible for your own assessment of the market and the market position of the Company and that you will conduct your own analysis and be solely
    responsible for forming your own view of the potential future performance of the Company’s business, (ii) if you are a U.S. person, you are a QIB (as defined
    below), and (iii) if you are a non-U.S. person, you are a Qualified Investor or a Relevant Person (as defined below).
    This Presentation does not constitute an offer to sell, or a solicitation of an offer to buy, any securities in any jurisdiction or to any person in which or to whom it
    is unlawful to make such an offer or solicitation. The distribution of this Presentation and the offering, subscription, purchase or sale of securities issued by the
    Company are in certain jurisdictions restricted by law. Persons into whose possession this Presentation may come are required by the Company to inform
    themselves about, and to comply with, all applicable laws and regulations in force in any jurisdiction in or from which it invests in the securities issued by the
    Company or receives or possesses this Presentation and must obtain any consent, approval or permission required under the laws and regulations in force in
    such jurisdiction. The Company shall not have any responsibility or liability whatsoever for these obligations.

© zalaris 2019                                                             Page 24
We open for questions
Thank you!                                                      Zalaris ASA
                                                                PO Box 1053
                                                                NO-0218 Oslo
Hans-Petter                        Nina Stemshaug
Mellerud
CEO & Founder                      CFO                          +47 4000 3300
hans-petter.mellerud@zalaris.com   nina.stemshaug@zalaris.com   www.zalaris.com
You can also read