Leading the Transformation - Analyst and Investor Call H1 Volkswagen AG 29 July 2021
←
→
Page content transcription
If your browser does not render page correctly, please read the page content below
Leading the Transformation.

Analyst and Investor Call H1
Volkswagen AG
29 July 2021
Disclaimer

The following presentations as well as remarks/comments and explanations in this context contain forward-looking statements on the business
development of the Volkswagen Group. These statements are based on assumptions relating to the development of the economic, political and
legal environment in individual countries, economic regions and markets, and in particular for the automotive industry, which we have made on the
basis of the information available to us and which we consider to be realistic at the time of going to press. The estimates given entail a degree of
risk, and actual developments may differ from those forecast. Any changes in significant parameters relating to our key sales markets, or any
significant shifts in exchange rates or commodities relevant to the Volkswagen Group or deviations in the actual effects of the Covid-19 pandemic
from the scenario presented will have a corresponding effect on the development of our business. In addition, there may be departures from our
expected business development if the assessments of the factors influencing value enhancement and of risks and opportunities presented develop
in a way other than we are currently expecting, or if additional risks and opportunities or other factors emerge that affect the development of our
business.

We do not update forward-looking statements retrospectively. Such statements are valid on the date of publication and can be superseded.

This information does not constitute an offer to exchange or sell or an offer to exchange or buy any securities.

                                                                                                                                                       2
Analyst & Investor Conference Call H1 2021

            Herbert Diess                    Arno Antlitz          Helen Beckermann
            Chairman of the              Chief Financial Officer           Head of
          Board of Management               Volkswagen AG          Group Investor Relations
             Volkswagen AG                                             Volkswagen AG

                                                                                              3
In a nutshell: very strong first half of the year 2021

              Strong Q2 performance                           E-Mobility ramp-up
               in challenging environment                     gains further momentum

                     NEW Auto                                  Updated guidance
                 paves the way to 2030                   amid product momentum & cost cuts

                                                                                             4
All brand groups contributed to strong H1 performance
Volkswagen Group1 Deliveries to Customers, January to June 2021 vs. 2020

                                    Volume                 Premium     Sports   Truck & Bus

           Hardware

           Software

                                    +24.2%                 +38.8%     +31.4%     +62.7%
           Battery &
           Charging

          Mobility &
           Services

                                                    Group: +27.9%

1 Excluding Ducati

                                                                                              5
In Europe and North America, Volkswagen Group gains market share1
Growth y-o-y, January to June 2021 vs. 2020

           North America2                                                 World2                                       Central & Eastern Europe

                  Car Market         VW Group                                    Car Market          VW Group                Car Market    VW Group
                                        45.1%                                       29.1%              27.2%
                                                                                                                                           33.4%
                     28.4%                                                                                                     29.0%

           South America2                                                 Western Europe                               Asia Pacific

                  Car Market         VW Group                                    Car Market         VW Group                 Car Market   VW Group

                     +40.0%            +39.7%                                                          31.3%
                                                                                    27.6%
                                                                                                                               28.9%
                                                                                                                                           16.8%

1 Volkswagen Group Passenger Cars excl. Volkswagen Commercial Vehicles 2) incl. LCV in North America & South America

                                                                                                                                                      6
E-Mobility gaining momentum – BEV sales to further accelerate in H2
Deliveries by regions and brands January to June 20211

[Thsd units]
                                        Others                                                  Others
                                                                                  Porsche
                        China        6,062                                                       450
                                                                                          19,822 (0%)
                              18,285 (4%)
                                                                                          (12%)
                              (11%)
                                                                   ŠKODA
                                                                             17,697
            USA 18,514                                                       (10%)
                (11%)
                                                                          6,172
                                                                   SEAT
                                          170,939                         (4%)                170,939    92,859 VW Passenger
                                                                                                         (54%) Cars

                                                                                 32,775
                                                    128,078
                                                                                 (19%)
                                                     (75%)
                                                                          Audi
                                                                                           1,164
                                                          Europe
                                                                                           (1%)

                                                                           VW Commercial
                                                                                 Vehicles

1 Europe: EU 27+2+UK, China: Incl. HK

                                                                                                                               7
VW Group Strategy
Group lays foundation to tap into future profit pools

                                                                                                                 Volume                                                        Premium                                 Sports

                                                                                                                ID.4                     Enyaq iV                     Q4 e-tron                SSP
                  Hardware

                  Software

                  Battery &
                  Charging

                 Mobility &
                  Services

ID.4 - power consumption in kWh/100 km (combined): 16.9-15.5 (NEDC); CO2-emissions in g/km: 0 (combined); efficiency class: A+; Enyaq iV - power consumption in kWh/100 km (combined): 16.0-14.4 (NEDC); CO2-emissions in g/km: 0 (combined); efficiency class: A+;
Q4 e-tron - power consumption in kWh/100 km (combined): 17.3-15.8 (NEDC), 19.0-17.0 (WLTP); CO2-emissions in g/km: 0 (combined); efficiency class: A+; ID.Buzz - Concept Car
                                                                                                                                                                                                                                                                      8
Europcar deal provides compelling opportunity to create a leading mobility platform
Consortium of Accelerated delivery of mobility services targets
• Customers increasingly demand new and
innovative on-demand mobility solutions, such
as subscription and sharing models
Interaction at
Green Mobility Holding
“arms’ length” • Building a leading mobility platform is a key
priority of NEW AUTO strategy through 2030
Irrevocable tender commitments from
shareholders representing 68%
€0.50 per share • Leveraging the strong transformation
Offer price will increase to €0.51
if acceptance of >90% reached capabilities of Attestor as well as the
international mobility services and customer
• Leading market position experience of Pon
• Advanced fleet • Develop and transform Europcar’s business
management capabilities and selectively add further services from
• Broad network of stations Volkswagen Group brands
29/7/21 9VW Group Strategy
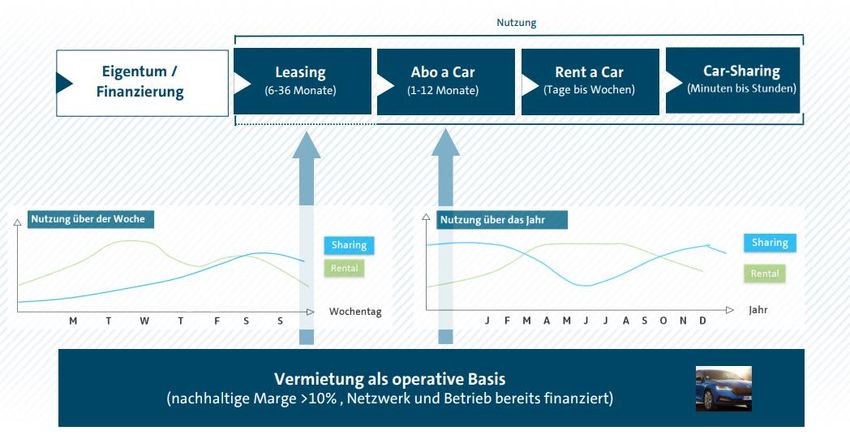
Holistic mobility experience for customers
Business
Commute Trip
Meeting
Weekend Getaway
Daily trip
to work with Use leased car to
subscribed Sport get to client
vehicle
Rent a van
Private Customer Business Customer User Chooser
Mobility Platform
Frontend
IT Platform
Brand Offer Group Offer Third Party Offer
Taxi Service
Rental Subscription Sharing … …
Mobility Unit
10VW Group Strategy
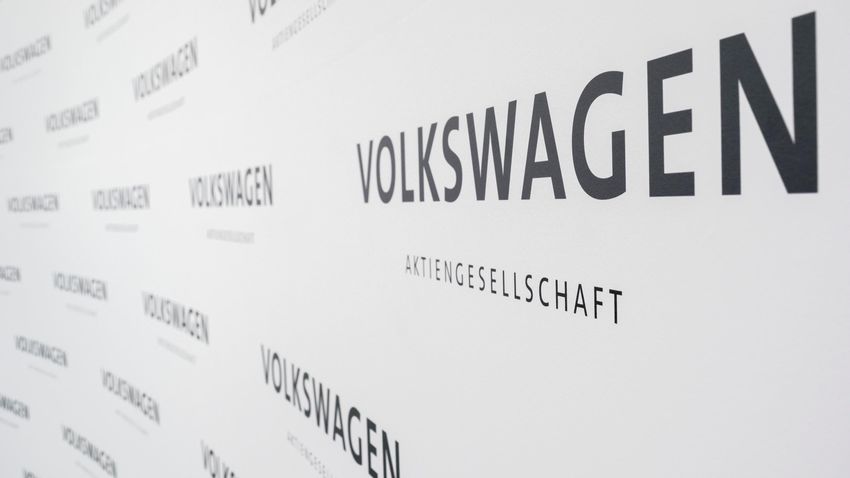
Continuing trend from ownership to usage of services
Usage
Ownership / Leasing Subscription Rent a Car Carsharing
Financing (6-36 months) (1-12 months) (days to weeks) (minutes to hours)
Rental as operational basis
(sustainable margin >10%, network and operations already financed)
Mobility unit
Source: BCG "Mobility and Subscription", Feb 2021
11Financial Highlights – Volkswagen Group
January to June 2021 vs. 2020 vs. 2019
Vehicles Sales H1 Sales Revenue H1 Operating Profit1 and Margin H1
[mil. vehicles] [€ bn ] [€ bn] Margin [%]
8.0% -0.8% 8.8%
5.3 125.2 129.7 11.4
4.7 10.0
3.7 96.1
2019 2020 2021 2019 2020 2021
-0.8
2019 2020 2021
1 before Special Items
12Strong Automotive Cash Flow development
Safeguarding liquidity to finance future
Reported Net Cash Flow 'Clean' Net Cash Flow1 Net Liquidity
[€ bn] [€ bn] [€ bn]
+16.4
35.0
26.8
12.3 18.7
10.2
6.9
5.6
30.6.20 31.12.20 30.6.21
-2.3
-4.8 H1/2019 H1/2020 H1/2021
H1/2019 H1/2020 H1/2021
1 Reported net cash flow before M&A and Diesel
13Automotive Division – Analysis of Net Liquidity1
January to June 2021
[€ bn]
Reported Net Cash flow (€ 10.2bn)
1.5 -0.6 -1.5
-1.2 0.0 -0.7
10.9
26.8
Clean Net
Cash flow
(€ 12.3bn)
35.0
31.12.20 Operating Dividend of Diesel M&A Hybrid Capital Dividend to Other 30.6.21
Business Chinese JVs Outflow VW AG
Shareholder
1 All figures shown are rounded, minor discrepancies may arise from addition of these amounts
14EBIT per Key Business Areas
January to June 2021 vs. 2020 vs. 2019
Automotive Division Financial Services Division
Passenger Cars1 Commercial Vehicles Financial Services
EBIT [€ bn] incl. Margin [%] EBIT [€ bn] incl. Margin [%] EBIT [€ bn]
8.4% -2.5% 9.3%
7.2% -3.0% 2.5%
8.5
2.5
7.7
Incl. restructuring of
1.4
-0.7 € bn 1.2
1.0
0.3
…
-0.3 2019 2020 2021
-1.7 2019 2020 2021
2019 2020 2021
1 before Special Items
15Passenger Cars EBIT-Bridge
January to June 2021 vs. 2020
Passenger Cars1
EBIT [€ bn] incl. Margin [%] [€ bn] Z884JCRF Thereof
• Overhead Costs -0.4
Thereof
• Development Costs -0.6
-2.5% 9.3% • Volume +6.3 • One off effects/ Others -1.8
• Price/mix +2.4 (e.g. AID in 2020 -0.8)
8.5
0.2
1.7 -2.8
Thereof
• Commodity derivatives +1.7
11.2 (Absolute in H1/2021) 1.1
8.5
-1.7
Jan - Jun 20 Volume / Exchange Product Costs Fixed Costs Jan - Jun 21
-1.7 before Mix / Prices Rates / / Others
2020 2021 Special Items Derivatives
1 before Special Items
16Volkswagen Passenger Cars – Brand Groups Performance
January to June 2021 vs. 2020
Volume Group Premium Group Sport & Luxury Group
EBIT [€ bn] incl. Margin [%] EBIT [€ bn] incl. Margin [%] EBIT [€ bn] incl. Margin [%]
-5.2% 4.4% 3.0% 9.6% -3.1% 10.7% 10.2% 17.6%
1.773 3.113 2.660
974
228
1.143
-1.491 2020 2021 -643
2020 2021 2020 2021 2020 2021
-11.6% 13.4%
-7.2% -0.5% -7.9% 1.6% 178
87
-26
-271 -334 -99
2020 2021 2020 2021 2020 2021
17Commercial Vehicles EBIT
January to June 2021 vs. 2020
Commercial Vehicles/Trucks
EBIT [€ bn] incl. Margin [%] EBIT [€ bn] incl. Margin [%] Z884JCRF
+0.2 (3.4%) before
restructuring
Volume/Mix
-9.1% -7.1%
Fixed costs
-0.4 -0.5 Provisions for restructuring € -0.7 bn
-3.0% 2.5%
2020 2021
0.3
4.2% 12.0%
-0.3 0.9
2020 2021
0.2
2020 2021
18China Joint Ventures – Proportionate Operating Profit
[€ bn]
Drivers
H2 • Continued strong premium
4.4 H1 performance, especially
FAW-VW
3.6 • Q2 2021 stronger affected by
chip shortage
2.3
• Competition in lower volume
2.2 segment negatively impacted
brand Volkswagen and ŠKODA
• Upfront-Investment
2.1 SAIC Audi
1.4 1.3
• Catch up program SVW
initiated
2019 2020 2021
19Volkswagen Group – Outlook for 2021
2019 2020 2021
Deliveries to customers 11.0 9.3 NEW
Noticeably above prior year
'000 vehicles
Sales revenue 252.6 222.9
Significantly higher than the prior-year figure
€ billion
Operating return on 1 NEW
7.6 4.8
1
sales In the range of 6.0 % to 7.5%
%
Automotive NEW
Reported Net Cash flow 10.8 6.4 Much stronger than prior year2
€ billion
Automotive NEW
Clean Net Cash flow 13.5 10.0 > 15bn
€ billion
1 Before Special Items 2 Before Navistar
20Proof points of our Strategy
Strategic CFO Targets CFO Focus Areas
Focus on product transformation towards electric
Focused financial steering
of the transformation Digitalization: Advancing in software/services
(allocation of resources to future
topics) Groupwide cost & efficiency programs
Capturing group-wide synergies
Safeguarding and Managing margins and Cash Flows
strengthening
our financial foundation
(… for continued investments in
Acting based on integrity and values
future technologies such as
electrification, digital technology
and autonomous driving)
21BEV ramp-up pushing for scale effects
CFO Focus Areas
Focus on product transformation
towards electric Worldwide Deliveries to Customers
[thousand units] MEB share • Synergy projects progressing
Digitalization: Advancing in by scaling up MEB platform
software/services groupwide
VW ID.6, ŠKODA Enyaq iV,
Audi Q4 e-tron/Q4
Groupwide cost & efficiency Sportback e-tron
programs 111 • Group as market leader in the
EU, with a share of about 26%
60 in BEV deliveries
Capturing group-wide synergies • Over-the-air functionality for
>60%
ID family started in July with
>30%
regular updates
Q1/21 Q2/21 Q3/21 Q4/21
Managing margins and Cash
Flows
22Business model: Software is a key differentiator for the future, 100% commitment
to become Software-Enabled-Car-Company SCHEMATIC
CFO Focus Areas
Planned Business model CARIAD
Focus on product transformation
towards electric Software
Operating result Investment phase Income phase
development
in brands R&D through licenses
[€ bn]
Digitalization: Advancing in H1/2021
Based on primary R&D costs
software/services
2020 2021 2022 2023
Groupwide cost & efficiency -0.5
programs
Net Cash Flow
[€ bn] • CARIAD currently included in 'Other line'1
Capturing group-wide synergies
H1/2021 • Brand R&D costs shifting to CARIAD
• H1 2021:
R&D € 1.0 bn
Managing margins and Cash
Flows ca. 4.5 k headcount
-1.1
1 Including allocation of consolidation adjustments between the Automotive and Financial Services divisions
23Financing the transformation: Fixed cost program ahead of schedule, further progress
in Q21
CFO Focus Areas
Focus on product transformation Group wide Overhead Cost Program (without R&D / Capex)
towards electric [€ bn] ~ -10%
~ -8% H2
Digitalization: Advancing in H1
software/services
Savings
Groupwide cost & efficiency increased in Q2
programs
Capturing group-wide synergies
20.0 18.5
Managing margins and Cash Actual Base FC Target
Flows 2019 2020 2021 2023
1 All figures shown are rounded, minor discrepancies may arise from addition of these amounts
24Capturing Groupwide Synergies - especially in Capex well under way
CFO Focus Areas
Focus on product transformation
towards electric R&D / Capex – Absolute and Ratio (Automotive Division)
[%] Capex R&D
Digitalization: Advancing in [€ bn] ∑ 14.1%
software/services (10.8 bn)
∑ ~11.5% ∑ 13%
(12.2 bn)
∑ 10.7%
~5.4% (11.5 bn)
Groupwide cost & efficiency (4.1 bn)
programs ~4.9% ~3.5% ~6%
(5.2 bn) (3.8 bn)
Capturing group-wide synergies ~8.7%
~6.6% ~7.2%
(6.7 bn) ~7%
(7.0 bn) (7.7 bn)
!
Managing margins and Cash H1/2019 H1/2020 H1/2021 Target FY 2021
Flows
25Focus on cash flow – all Group companies clearly positive (except CARIAD)
CFO Focus Areas
Focus on product transformation Net Cash Flow by Brands, € mil.
towards electric
Net Cash Flow (including Diesel Payout) Diesel Payout
Volkswagen Passenger Cars 400 (404)
Digitalization: Advancing in SEAT 356
software/services Škoda 678
Volkswagen Commercial Vehicles 290
Audi 5,512 (68)
Groupwide cost & efficiency Bentley 251
programs
Porsche Automotive 2,601
MAN Commercial Vehicles 327
Capturing group-wide synergies Scania Vehicles and Services 354
Other1 -579 (145)
Automotive Division Reported Net Cash2 10,191
Managing margins and Cash 1 Consolidation and other non-brand companies including CARIAD
Flows 2 Including allocation of consolidation adjustments between the Automotive and Financial Services divisions
All figures shown are rounded, minor discrepancies may arise from addition of these amounts
26Overall ambition: Leading the transformation with integrity and based on our values
Strong brands
Financial strength
BEV
Integrity
Software
AI / mobility services
27Leading the Transformation. Backup
Volkswagen Group – Analysis by Business Line 1)
  (January to June 2021)

                                                                                             Vehicle sales                                 Sales revenue                                Operating profit                            Operating margin
  thousand vehicles / € million / percentage                                                2021               2020                          2021           2020                          2021               2020                         2021           2020
  Volkswagen Passenger Cars                                                                   1.552              1.134                       40.689         28.580                          1.773            – 1.491                        4.4%          -5.2%
  ŠKODA                                                                                         463                372                       10.199          7.546                            974                228                        9.5%           3.0%
  SEAT                                                                                          310                197                        5.656          3.749                           – 26              – 271                       -0.5%          -7.2%
  Volkswagen Commercial Vehicles                                                                188                157                        5.298          4.238                             87              – 334                        1.6%          -7.9%
  Audi                                                                                          602                416                       29.212         20.476                          3.113              – 643                       10.7%          -3.1%
  Bentley                                                                                         7                  5                        1.324            860                            178               – 99                       13.4%         -11.5%
  Porsche Automotive 2)                                                                         152                116                       15.107         11.192                          2.660              1.143                       17.6%          10,2%
  Scania Vehicles and Services3)                                                                 50                 31                        7.155          5.269                            860                221                       12.0%           4.2%
  MAN Commercial Vehicles                                                                        77                 47                        6.405          4.669                          – 456              – 423                       -7.1%          -9.1%
  Power Engineering 4)                                                                            –                  –                        1.581          1.850                             82                 21                        5.2%           1.1%
  VW China5)                                                                                  1.522              1.422                            –              –                              –                  –                              –             –
  Other 6)                                                                                    – 263              – 160                    – 14.513        – 10.361                          – 226              – 312                              –             –
  Volkswagen Financial Services                                                                   –                  –                      21.556          18.063                         2.339               1.155                            –             –
  Volkswagen Group before Special Items                                                           –                  –                           –               –                        11.358                -803                         8.8%         -0.8%
  Special Items                                                                                   –                  –                           –               –                             -                -687                            –             –
  Volkswagen Group                                                                            4.660              3.736                     129.669          96.131                        11.358             – 1.490                         8.8%         -1.5%
    Automotive Division 7)                                                                    4.660              3.736                     107.027          77.015                         8.841             – 2.738                         8.3%          -3.6%
      of which: Passenger Cars                                                                4.533              3.658                      92.041          65.312                         8.521             – 2.350                         9.3%          -3.6%
      of which: Commercial Vehicles                                                             127                 78                      13.404           9.854                           334               – 295                         2.5%          -3.0%
           of which: Power Engineering                                                              –                  –                      1.581           1.850                           – 14               – 93                       -0.9%          -5.0%
         Financial Services Division                                                                –                  –                     22.642         19.115                          2.517              1.248                              –             –

1) All
     figures shown are rounded, minor discrepancies may arise from addition of these amounts. 2) Porsche (Automotive and Financial Services): sales revenue € 16.525 (12.421) million, operating profit € 2.792 (1.233 ) million. 3) Scania (Automotive and Financial
Services): sales revenue € 7.377 (5.488) million, operating profit € 960 (266) million. 4) Prior year including operations from Renk 5) The sales revenue and operating profits of the joint venture companies in China are not included in the figures for the Group.
These Chinese companies are accounted for using the equity method and recorded a proportionate operating profit of € 1.272 (1.404) million. 6) In operating profit, mainly intragroup items recognized in profit or loss, in particular from the elimination of
intercompany profits; the figure includes depreciation and amortization of identifiable assets as part of purchase price allocation, as well as companies not allocated to the brands. 7) Including allocation of consolidation adjustments between the Automotive
and Financial Services divisions.                                                                                                                                                                                                                                  29
Automotive Division – Net Cash Flow Development 1)
(January to June 2021)
[€ bn]
19.1
-3.8
-3.7
11.7
0.1 10.2
-1.5
Cash flow from Capex Capitalized Other Net cash flow before Acquisition and Reported Net
operating activities development costs equity investments disposal of equity Cash flow
investments
1) All figures shown are rounded, minor discrepancies may arise from addition of these amounts. Including allocation of consolidation adjustments between Automotive and Financial Services divisions. 30Automotive Division – Net Cash Flow 1) (January to June 2021)
[€ billion]
12.3
1.5
10.2 0.6
Reported Net Cash Flow Diesel outflow Aquisition and disposal Clean Net Cash Flow
of equity investments
1) Including allocation of consolidation adjustments between Automotive and Financial Services divisions. 31Leading the Transformation. Appendix
You can also read