COMPANY PRESENTATION ANDRITZ GROUP - SEPTEMBER 2018 - Baader ...
←
→
Page content transcription
If your browser does not render page correctly, please read the page content below
COMPANY PRESENTATION
       ANDRITZ GROUP

         SEPTEMBER 2018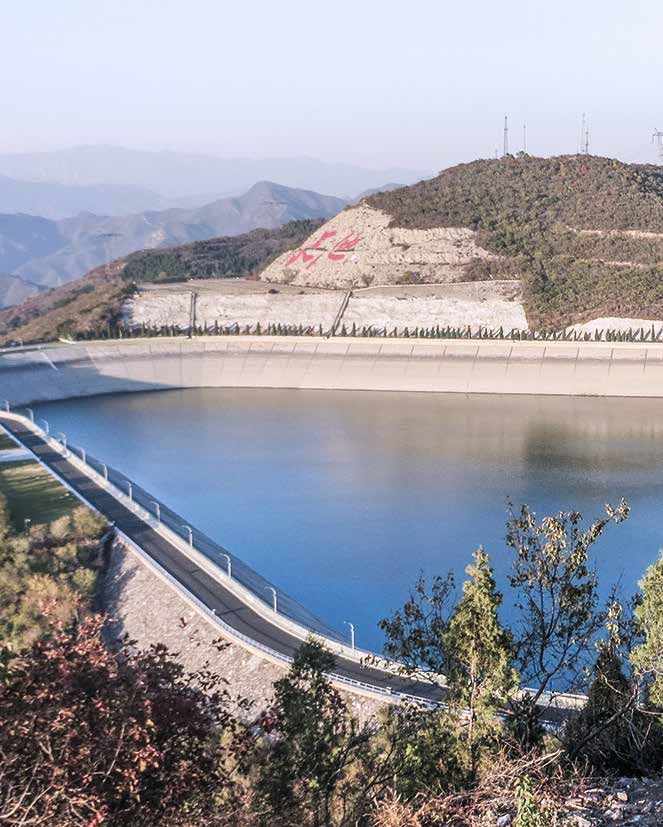
CHAPTER OVERVIEW

01            ANDRITZ GROUP OVERVIEW

2 / COMPANY PRESENTATION, SEPTEMBER 2018 / © ANDRITZ GROUP
THE ANDRITZ GROUP

ANDRITZ is a globally leading supplier of plants, equipment, systems and services for hydropower stations, the pulp and
paper industry, the metalworking and steel industries, and solid/liquid separation in the municipal and industrial sectors as
well as for animal feed and biomass pelleting.

Global presence
Headquarters in Graz, Austria; over 250 production sites and service/sales companies worldwide

                                                                                                     SALES BY REGION 2017 (%)
KEY FINANCIAL FIGURES:

                                                        UNIT   H1 2018     2017
Order intake                                            MEUR   3,269.3   5,579.5                                                Emerging
                                                                                                                                markets:
Order backlog (as of end of period)                     MEUR   6,841.1   6,383.0         Europe &                               42%
                                                                                    North America:            5,889
Sales                                                   MEUR   2,763.1   5,889.1                              MEUR
                                                                                             58%
Net income (including non-controlling interests)        MEUR      99.9    265.6
Employees (as of end of period; without apprentices)    -       26,023   25,566

3 / COMPANY PRESENTATION, SEPTEMBER 2018 / © ANDRITZ GROUP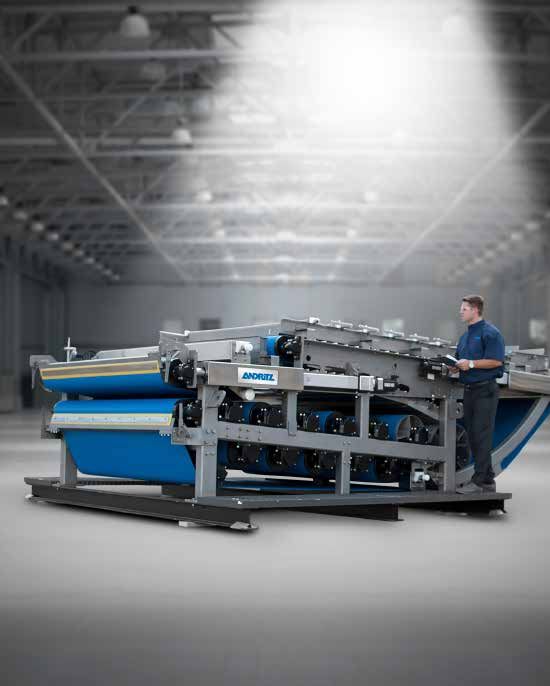
A WORLD MARKET LEADER
WITH FOUR BUSINESS AREAS

                            HYDRO                               PULP & PAPER                         METALS                      SEPARATION

                      24                                               36                         29                            11
                    % order intake*                             % order intake*               % order intake*                   % order intake*

                   PRODUCT OFFERINGS                            PRODUCT OFFERINGS             PRODUCT OFFERINGS                 PRODUCT OFFERINGS
                   Electromechanical equipment                  Equipment for production of   Presses/press lines for metal     Equipment for solid/liquid
                   for hydropower plants                        all types of pulp, paper,     forming (Schuler); systems for    separation for municipalities
                   (turbines, generators); pumps;               tissue, and board; energy     production of stainless steel,    and various industries;
                   turbo generators.                            boilers.                      carbon steel, and non-ferrous     equipment for production of
                                                                                              metal strip; industrial furnace   animal feed and biomass
                                                                                              plants.                           pellets.
                    * Share of total Group order intake 2017.

4 / COMPANY PRESENTATION, SEPTEMBER 2018 / © ANDRITZ GROUP
STRENGTHENING OF MARKET POSITION
BY ACQUISITIONS
Acquisitions by business area since 2000

HYDRO                              PULP & PAPER                                                         METALS                          SEPARATION
2006   VA TECH HYDRO               2000    Ahlstrom Machinery         2010   Rieter Perfojet            2000   Kohler                   2000   UMT
2007   Tigép                       2000    Lamb Baling Line           2010   DMT/Biax                   2002   SELAS SAS Furnace Div.   2002   3SYS
2008   GE Hydro business           2000    Voith Andritz Tissue       2011   AE&E Austria               2004   Kaiser                   2004   Bird Machine
2010   GEHI (JV)                   2002    ABB Drying                 2011   Iggesund Tools             2005   Lynson                   2004   NETZSCH Filtration
2010   Precision Machine           2003    IDEAS Simulation           2011   Tristar Industries         2008   Maerz                    2004   Fluid Bed Systems
2010   Hammerfest Strøm            2003    Acutest Oy                 2011   Asselin-Thibeau            2012   Bricmont                 2005   Lenser Filtration
2010   Ritz                        2003    Fiedler                    2012   AES                        2012   Soutec                   2006   CONTEC Decanter
2011   Hemicycle Controls          2004    EMS (JV)                   2013   MeWa                       2013   Schuler (> 95%)          2009   Delkor Capital Equipment
                                   2005    Cybermetrics               2015   Euroslot                   2013   FBB Engineering          2009   Frautech
                                   2005    Universal Dynamics Group   2016   SHW Casting Technologies   2014   Herr-Voss Stamco         2010   KMPT
                                   2006    Küsters                    2017   Paperchine                 2016   Yadon (52,9%)            2012   Gouda
                                   2006    Carbona                    2018   Novimpianti                2016   AWEBA                    2013   Shende Machinery
                                   2006    Pilão                      2018   Diatec (70%)               2017   Powerlase (51%)          2016   ANBO
                                   2007    Bachofen + Meier           2018   Xerium*                    2018   Asko*
                                   2007    Sindus
                                   2008    Kufferath
                                   2009    Rollteck                                                                                                    * open transaction

 5 / COMPANY PRESENTATION, SEPTEMBER 2018 / © ANDRITZ GROUP
XERIUM TECHNOLOGIES, INC. – OVERVIEW
  GENERAL
  • Head Office: Youngsville, North Carolina, USA
  • Founded in 1999
  • 2,850 employees
  • 28 manufacturing locations in 13 countries
  • Net sales 2017: 481 MUSD
  • EBITDA 2017: 85 MUSD (adjusted for extraordinary effects: 100 MUSD)

  PRODUCTS & SERVICES
  A globally leading provider of machine clothing (forming fabrics, press
  felts, drying fabrics) and roll covers for paper, tissue and board
  machines

   RATIONALE OF THE ACQUISITION
   • Complement range of products for machine clothing
   • Grow aftermarket business with its stable source of revenue and earnings

6 / COMPANY PRESENTATION, SEPTEMBER 2018 / © ANDRITZ GROUP
COMPLEMENTATION OF PRODUCT RANGE

Product segments
                                                                                                    Xerium
                                                    Xerium                                       Dryer Fabrics
                                                   Press Felts
Xerium and ANDRITZ
   Forming Fabrics                                                          Xerium
                                                                        Shoe Press Belts

                                                                                              Dryer Section
                                                                                                                      Xerium
                                                        Press Section                                            Extensible blankets
               Forming Section
                                                                                Xerium
                                                                             Rolls covers
                                                                             Spreader rolls

 7 / COMPANY PRESENTATION, SEPTEMBER 2018 / © ANDRITZ GROUP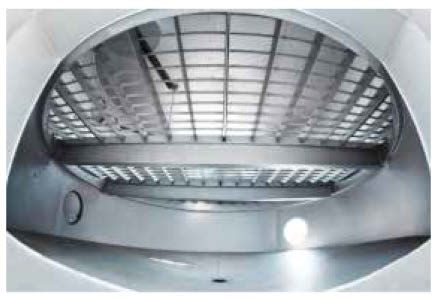
CHAPTER OVERVIEW

02            RESULTS Q2/H1 2018
              AND MARKET UPDATE

8 / COMPANY PRESENTATION, SEPTEMBER 2018 / © ANDRITZ GROUP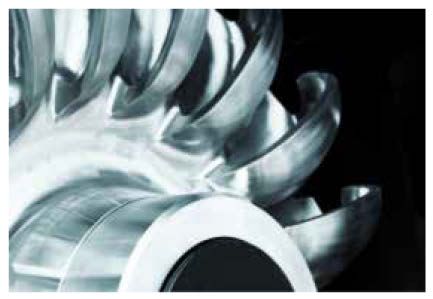
STRONG ORDER INTAKE IN Q2 2018 WITH
INCREASES IN ALL BUSINESS AREAS
Very high order intake for plants that produce energy from biomass / sewage sludge.

ORDER INTAKE (MEUR)                                          ORDER INTAKE BY BUSINESS AREA (MEUR)

                           +18%                                                  H1 2018    H1 2017          +/-     Q2 2018    Q2 2017              +/-
                                              3,269
                                                             Hydro                   753       514         +47%          318         205           +56%
         2,771
                                                             Pulp & Paper           1,181     1,125        +5%           723         472           +53%
                                               Q2:
          Q2:              +43%               1,736          Metals                  947       814         +16%          479         372           +29%
         1,211
                                                             Separation              389       318         +22%          216         164           +32%

                                                             ORDER INTAKE BY REGION (%)
          Q1:               -2%                Q1:
         1,560                                1,533                                            H1 2018       H1 2017             WELL-BALANCED
                                                                                                                           GEOGRAPHICAL EXPOSURE (H1 2018)
                                                             Europe                               36%              42%
                                                                                                                                                       Europe/North
       H1 2017                              H1 2018          China                                21%              15%       Emerging                  America: 51%

           RISING ORDER INTAKE SINCE Q2 2017 (MEUR)
                                                                                                                          markets: 49%     3,269
                                                             Asia (without China)                 15%              10%                     MEUR
                                           1,736
                           1,467   1,533
           1,211
                   1,341                                     North America                        15%              23%
                                                             South America                            5%           6%

          Q2 2017 Q3 2017 Q4 2017 Q1 2018 Q2 2018
                                                             Africa, Australia                        8%           4%
9 / COMPANY PRESENTATION, SEPTEMBER 2018 / © ANDRITZ GROUP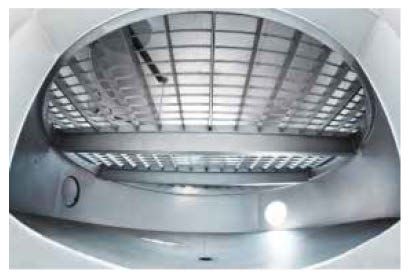
RISING ORDER INTAKE SINCE Q2 2017

ORDER INTAKE (MEUR)                                                        ORDER INTAKE BY BUSINESS AREA (MEUR)

                                                                                           Hydro                                  Pulp & Paper
                                                                  1,736                                                                                 723

                                                        1,533
                                       1,467                                                                           472             481
                                                                                     425             435                                       457
                      1,341                                                                                                    427
                                                                                              378
     1,211                                                                                                    318
                                                                             205

                                                                            Q2 2017 Q3 2017 Q4 2017 Q1 2018 Q2 2018   Q2 2017 Q3 2017 Q4 2017 Q1 2018 Q2 2018

                                                                                           Metals                                 Separation

                                                                                              463    468      479
                                                                             372
                                                                                     329
                                                                                                                                                        216
   Q2 2017          Q3 2017           Q4 2017          Q1 2018   Q2 2018                                               164     160     145     173

                                                                            Q2 2017 Q3 2017 Q4 2017 Q1 2018 Q2 2018   Q2 2017 Q3 2017 Q4 2017 Q1 2018 Q2 2018

10 / COMPANY PRESENTATION, SEPTEMBER 2018 / © ANDRITZ GROUP
SALES INCREASE IN Q2 PRACTICALLY FULLY
OFFSETS Q1 SALES DECLINE
Solid development of Pulp & Paper and Separation.
SALES (MEUR) SALES BY BUSINESS AREA (MEUR)
-1% H1 2018 H1 2017 +/- Q2 2018 Q2 2017 +/-
2,779 2,763 Hydro 724 725 -0% 375 369 +2%
Pulp & Paper 1,010 991 +2% 551 482 +14%
Q2: Q2: Metals 742 792 -6% 395 395 0%
+6%
1,393 1,472
Separation 287 271 +6% 152 147 +3%
SALES BY REGION (%)
Q1: -7% Q1:
1,386 H1 2018 H1 2017 GEOGRAPHICAL EXPOSURE (H1 2018)
1,291
Europe 41% 38%
Europe/North
Emerging America: 61%
H1 2017 H1 2018 North America 20% 21% markets: 39% 2,763
MEUR
China 14% 15%
Asia (without China) 12% 12%
South America 9% 10%
Africa, Australia 4% 4%
11 / COMPANY PRESENTATION, SEPTEMBER 2018 / © ANDRITZ GROUPSOLID EARNINGS DEVELOPMENT IN Q2 2018,
HOWEVER …
Favorable development of Pulp & Paper, Metals unsatisfactory.
EBITA (MEUR) Q2 2018:
109.9* -14% • EBITA, at 94.6 MEUR, up by over 9% compared to the adjusted (positive one-
off effect of ~25 MEUR) Q2 2017 EBITA (86.5 MEUR) due to higher sales and
Extra-
ordinary 94.6 good performance of Pulp & Paper.
effect
• Including one-off effect, EBITA was significantly down by 14%.
• Metals still impacted by market-related price pressure and cost overruns on
some projects.
+9%
(excl.
extraordinary
effect)
EBITA MARGIN (%)
Q2 2017:
Q2 2018:
7.9%
(6.2%**) 6.4%
** Excluding extraordinary effect (mainly due to the sale of the Schuler Technical Center in Tianjin).
Q2 2017 Q2 2018
* Extraordinary effect of approx. 25 MEUR.
12 / COMPANY PRESENTATION, SEPTEMBER 2018 / © ANDRITZ GROUP… H1 2018 DOWN COMPARED TO LAST YEAR‘S
REFERENCE PERIOD DUE TO WEAK Q1 2018
EBITA (MEUR) H1 2018:
• EBITA, at 166.3 MEUR, 9% below the adjusted EBITA (182.3 MEUR) due to
207.3* -20% weak Q1 2018 which was impacted by lower sales and cost overruns in Metals.
Extra-
ordinary
• Including one-off effect, EBITA was down by 20%.
effect
166.3
EBITA MARGIN (%)
-9%
(exkl. H1 2017:
Sonder- H1 2018:
7.5%
effekt)
(6.6%**) 6.0%
** Excluding extraordinary effect (mainly due to the sale of the Schuler Technical Center in Tianjin).
H1 2017 H1 2018
* Extraordinary effect of approx. 25 MEUR.
13 / COMPANY PRESENTATION, SEPTEMBER 2018 / © ANDRITZ GROUPGROUP ORDER BACKLOG UP COMPARED TO END
OF 2017 DUE TO RISING ORDER INTAKE TREND
ORDER BACKLOG (AS OF END OF PERIOD; IN MEUR)
-0%
+7%
7,324 6,789 6,849 6,841
6,383
2015 2016 H1 2017 2017 H1 2018
ORDER BACKLOG BY BUSINESS AREA (AS OF END OF PERIOD; IN MEUR) HYDRO AND PULP & PAPER ACCOUNT FOR 71% OF TOTAL BACKLOG
Hydro: Pulp & Paper: Metals: Separation:
H1 2018 H1 2017 +/- 41% 30% 22% 7%
Hydro 2,789 3,090 -10%
Pulp & Paper 2,099 1,972 +7%
Metals 1,494 1,389 +8%
Separation 459 399 +15%
14 / COMPANY PRESENTATION, SEPTEMBER 2018 / © ANDRITZ GROUPHYDRO: UNCHANGED CHALLENGING
MARKET ENVIRONMENT
Selective award of individual projects.
ANDRITZ supplied
is contributing
equipment
to China’s
for the
clean
pumped
energy
storage
• New hydropower plants transition with
hydropower plant
pumped
Shi Shan
storage
Ling,
power
China.technology.
Some new projects in emerging markets, particularly in Asia, Africa and
South America, are currently in the planning phase; award of these projects
is expected over a longer period of time.
• Pumps
Good project activity.
• Modernizations/rehabilitations
Unchanged, difficult market conditions caused by low electricity prices,
particularly in Europe.
• Competition
Stable competition at challenging level. © istock.com / ispyfriend
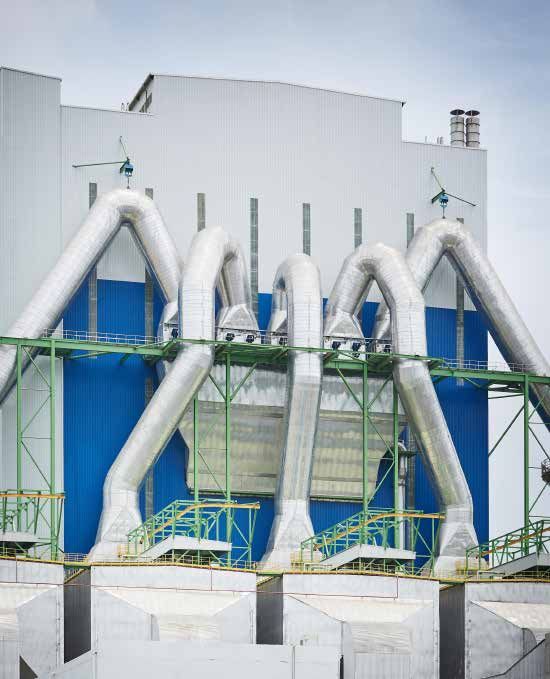
15 / COMPANY PRESENTATION, SEPTEMBER 2018 / © ANDRITZ GROUPPULP & PAPER: CONTINUATION OF SOLID MARKET
ENVIRONMENT
The ANDRITZ recovery boiler at APP’s OKI mill is the
• Pulp world’s largest boiler today.
Good project activity, particularly for modernization of existing pulp mills.
No contracts were awarded for greenfield pulp mills.
• Paper
Satisfactory market development for tissue and packaging equipment
continued.
• Energy production from biomass and sewage sludge
Very active market, especially in Asia (China, Japan).
• Competition
Stable competitive environment.
16 / COMPANY PRESENTATION, SEPTEMBER 2018 / © ANDRITZ GROUPNEW PULP MILLS AND LINES ≥0.5MT IN PLANNING
FINLAND:
Owner – project Capacity/a* Planned start-up
RUSSIA:
USA: Finnpulp – Kuopio 1.2 2020
Owner – project Capacity/a* Planned start-up
Owner – project Capacity/a* Planned start-up Kemijärvi 0.5 2021
OOO Monolog 0.5 2020
SUN BIO Arkansas 0.5 2023
Krasleinvest 0.8 2022
China Chentong 0.8 2022
ESTONIA:
Siberwood 0.9 2023
Owner – project Capacity/a* Planned start-up
OTHER: China Metallurg. 0.5 2024-
Est-For Oü 0.7 2022 Group
Owner – project Capacity/a* Planned start-up
JSC Arkhangelsk 0.5 2024-
Acacia Cellulose 0.9 2022
Malaysia
MOZAMBIQUE: Segezha/CAMCE 0.5 2024-
Double A Thailand 0.6 2024-
Owner Capacity/a* Planned start-up
Portucel 1.5 2023
BRAZIL:
CHILE: Owner – project Capacity/a* Planned start-up
Owner – project Capacity/a* Planned start-up Eldorado – Três Lagoas 2.3 2022
Arauco – MAPA 1.6 2021 Lwarcel 1.3 2022
Fibria – Três Lagoas 1.9 2024-
ARGENTINA: URUGUAY: Fibria – Aracruz 1.7 2024-
Owner – project Capacity/a* Planned start-up Owner Capacity/a* Planned start-up Veracel – Eunápolis 1.8 2024-
Agroforestal Oberá 0.5 2021 UPM 2.0 2023 Braxel – Peixes 2.0 2024-
CRPE Holding S.A – 2.2 2024-
Ribas do Rio Pardo
*Annual capacity in million tons (may change over time); source: Pöyry. Capacity/year refers to added gross capacity
(i.e. relevant as accessible market) without taking into account possible shut-downs of existing capacities Suzano – Imperatriz 1.3 2024-
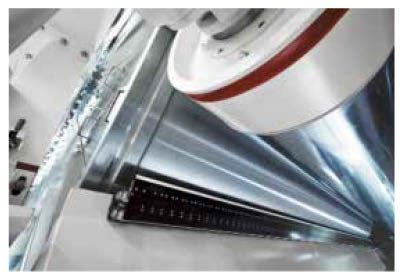
17 / COMPANY PRESENTATION, SEPTEMBER 2018 / © ANDRITZ GROUP CMPC Brazil – Pelotas 1.8 2024METALS: SATISFACTORY PROJECT AND
INVESTMENT ACTIVITY
Solid market environment in both Metal Forming and Metals Processing.
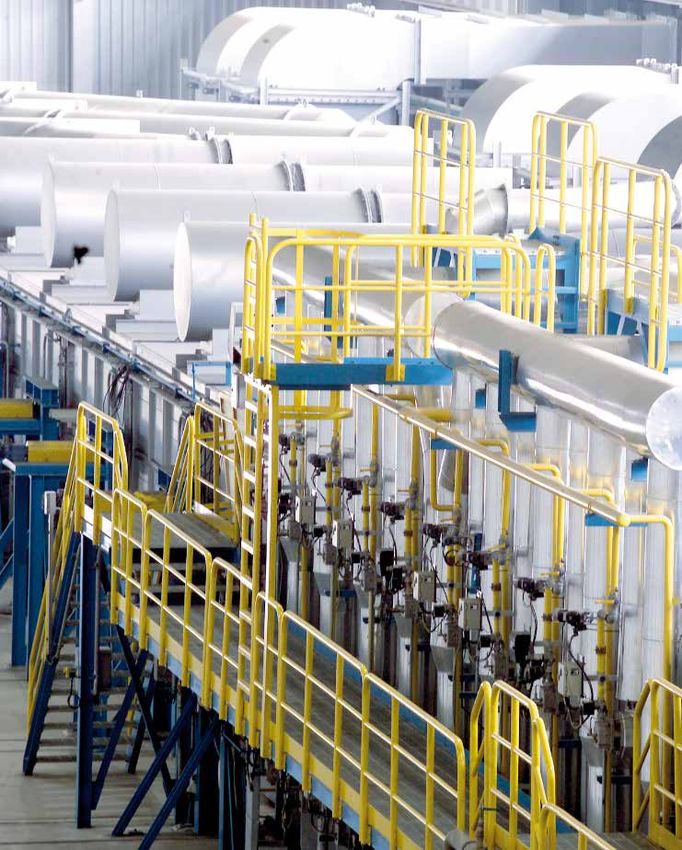
ANDRITZ annealing furnace in a cold strip annealing
• Metal Forming and pickling line.
Satisfactory project and investment activity; some important orders were
awarded by international and Chinese car manufacturers and their
suppliers; favorable development of Yadon, China, continued.
• Metals Processing
Further slight increase in project and investment activity, mainly driven by
rising steel and commodity prices.
• Competition
Unchanged challenging competition with price pressure, especially in Metals
Processing.
18 / COMPANY PRESENTATION, SEPTEMBER 2018 / © ANDRITZ GROUPSEPARATION: GOOD PROJECT AND INVESTMENT
ACTIVITY CONTINUED
Mainly for solid/liquid separation equipment.
• Municipal
Investment activity at good levels (sewage sludge drying).
• Industrial
Good project activity in mining and minerals (especially the lithium market)
as well as in chemicals (petrochemicals, polymers, fertilizers, and
agrochemicals); slightly improved investment activity in food.
• Feed and biomass pelleting
Solid project activity.
• Competition
Unchanged market environment with some global and many regional
ANDRITZ belt press SMX-Q – low-profile dewatering
competitors. belt press for the environmental industry.
19 / COMPANY PRESENTATION, SEPTEMBER 2018 / © ANDRITZ GROUPCHAPTER OVERVIEW 03 OUTLOOK 20 / COMPANY PRESENTATION, SEPTEMBER 2018 / © ANDRITZ GROUP
OUTLOOK FOR REMAINDER OF 2018 UNCHANGED

Good project activity on markets served by ANDRITZ.

             Hydro                                        Pulp & Paper                              Metals                             Separation

       stable +                                         stable +                              stable +                              stable +
 • Project activity for modernizations            • Project and investment activity to   • Project activity in Metal Forming   • Reasonable market activity in
   and new hydropower stations to                   continue at a good level in 2018,      to remain stable/improve slightly     environment, mining, and
   remain at subdued level.                         especially for modernization of        compared to 2017.                     chemicals.
 • Some larger, new hydropower                      existing plants and for energy       • In Metal Forming, the need to       • Low investment activity in food
   projects are currently in the                    production plants.                     make further capacity                 to continue.
   planning phase, especially in                  • Some new greenfield pulp mill          adjustments to adapt the cost
   Southeast Asia and Africa;                       projects are likely to be awarded      basis is currently under review.
   selective award of individual                    in the next few months.              • Investment activity in Metals
   large-scale projects is likely.                • Continued satisfactory investment      Processing to remain at
 • Satisfactory market activity for                 activity for tissue and packaging,     moderate level.
   pumps to continue.                               especially in the emerging
                                                    markets.

                                       For 2018, ANDRITZ expects stable sales compared to 2017 and
                            continued solid profitability (excluding extraordinary effect recorded last business year).

21 / COMPANY PRESENTATION, SEPTEMBER 2018 / © ANDRITZ GROUP
DISCLAIMER This presentation contains valuable, proprietary property belonging to ANDRITZ AG or its affiliates (“the ANDRITZ GROUP”), and no licenses or other intellectual property rights are granted herein, nor shall the contents of this presentation form part of any sales contracts that may be concluded between the ANDRITZ GROUP companies and purchasers of any equipment and/or systems referenced herein. Please be aware that the ANDRITZ GROUP actively and aggressively enforces its intellectual property rights to the fullest extent of applicable law. Any information contained herein (other than publically available information) shall not be disclosed or reproduced, in whole or in part, electronically or in hard copy, to third parties. No information contained herein shall be used in any way either commercially or for any purpose other than internal viewing, reading, or evaluation of its contents by the recipient, and the ANDRITZ GROUP disclaims all liability arising from the recipient’s use or reliance upon such information. Title in and to all intellectual property rights embodied in this presentation and all information contained therein is and shall remain with the ANDRITZ GROUP. None of the information contained herein shall be construed as legal, tax, or investment advice, and private counsel, accountants, or other professional advisers should be consulted and relied upon for any such advice. All copyrightable text and graphics, the selection, arrangement, and presentation of all materials, and the overall design of this presentation are © ANDRITZ GROUP 2018. All rights reserved. No part of this information or materials may be reproduced, retransmitted, displayed, distributed, or modified without the prior written approval of the owner. All trademarks and other names, logos, and icons identifying the owner’s goods and services are proprietary marks belonging to the ANDRITZ GROUP. If the recipient is in doubt whether permission is needed for any type of use of the contents of this presentation, please contact the ANDRITZ GROUP at welcome@andritz.com. 22 / COMPANY PRESENTATION, SEPTEMBER 2018 / © ANDRITZ GROUP
You can also read