RESULTS PRESENTATION HALF YEAR ENDED 29TH OF DECEMBER 2019 - Accent Group
←
→
Page content transcription
If your browser does not render page correctly, please read the page content below
RESULTS
         PRESENTATION
         HALF YEAR ENDED 29TH OF
             DECEMBER 2019

    Accent Group Limited H1 FY2020 Results Presentation
                                                          1
1
Table of contents

    Item                                                           Page

    Results Summary Page                                            3

    Retail                                                          7

    Wholesale & Vertical Brands                                     10

    Growth Plan                                                     12

    Dividends, Trading Update & Outlook                             16

    Appendix                                                        18

             Accent Group Limited H1 FY2020 Results Presentation
                                                                          2
1
Record H1 FY20 profit1
Key Metrics
                                            Pre AASB 16                    Pre AASB 16                            %
$’000’s                                       H1 FY20                        H1 FY19                            Change

EBITDA                                          $67,704                        $61,260                          +10.5%

EBIT                                            $52,642                        $47,377                          +11.1%

PBT                                             $50,855                        $45,789                          +11.1%

NPAT                                            $35,288                        $32,159                           +9.7%

Owned Sales                                    $444,170                       $389,391                          +14.1%

Total Sales (inc TAF
                                               $507,894                       $458,084                          +10.9%
Franchisees)

FY20 Interim
                                               5.25 cents                     4.50 cents                        +16.7%
Year Dividend

1. The statutory results for H1 FY20 reflect the adoption of the new accounting standard AASB 16 Leases. The Group has adopted AASB
16 using the modified retrospective approach and as a result the prior period comparatives have not been restated. To allow for
comparable financial information, all H1 FY20 results in this presentation are disclosed pre the application of AASB 16 (“Pre AASB 16”)
and exclude the impact of AASB 16. Refer to page 19 for a statutory review of the results.

             Accent Group Limited H1 FY2020 Results Presentation
                                                                                                                                          3
3
Continued innovation for growth

    Store growth: opened 51 new stores (including new store formats), 8
    closures, now more than 500 stores in the Group.

    Digital growth: up 33% on H1 FY19, customer personalisation journey
    continues.

    The Athlete’s Foot (TAF) corporate stores: 66 corporate stores, up from 49
    stores in FY19.

    Vertical product: launch of Shubar in Hype, The Trybe accessories, TAF
    performance socks, Alpha school shoes and new accessory ranges in
    Platypus and Hype.

    Trybe: 8 stores, including online store now open and strategy on track.

    Digital Innovation: launch of Crèmm and acquisition of Stylerunner.

    Customer innovation: My FIT3D rollout in all TAF stores.

    Accent Group Limited H1 FY2020 Results Presentation
                                                                                 4
4
H1 FY20 summary of financial performance
Financial Summary1 – Comparable Financial Information                                                             Operating Highlights

                                                      Pre AASB 16 Pre AASB 16   %                                                o Total company owned sales of $444.2m,
Profit & Loss ($000's)                                  H1 FY20     H1 FY19   Change                                               up 14.1% on prior year.
Owned Sales                                               444,170                 389,391               14.1%                    o Continued digital sales growth of 33%.
                                                                                                                  Sales
Gross Profit                                              252,040                 223,112                                        o LFL retail sales up 2.4% for H1 (including
                                                                                                                                   digital and TAF franchise stores).
Gross Margin (%)                                           56.7%                   57.3%               -60bps
                                                                                                                                 o 51 new stores opened, 8 closed.
CODB                                                     (194,349)              (172,409)
CODB (%)                                                   43.8%                   44.3%               -50bps                    o Gross margin down 60 bps due to market
                                                                                                                                   conditions, including lower AUD/USD
Royalties and Franchise Fees                                5,773                   6,252                                          exchange rate and the competitive
                                                                                                                                   environment in November and December
Other Income                                                4,240                   4,305
                                                                                                                                   driven by the significant growth in
EBITDA                                                     67,704                  61,260               10.5%                      November cyber sales events.
                                                                                                                  Gross Margin
Depreciation & Amortisation                               (15,062)               (13,883)                                        o Currency impact in H1 of 120 bps of gross
                                                                                                                                   margin, offset by distributed brands and
EBIT                                                       52,642                  47,377               11.1%                      vertical product growth.
Net Interest (Paid) / Received                             (1,787)                (1,588)                                        o Vertical product strategy (shoe care, socks
                                                                                                                                   and accessories) on track.
PBT                                                        50,855                  45,789               11.1%
Tax                                                       (15,567)               (13,630)                                        o CODB % decrease due to efficiency
                                                                                                                  CODB             initiatives and operating leverage from new
Net Profit After Tax                                       35,288                  32,159                9.7%                      stores.
1. The statutory results for H1 FY20 reflect the adoption of the new accounting standard AASB 16 Leases.
The Group has adopted AASB 16 using the modified retrospective approach and as a result the prior period
comparatives have not been restated. To allow for comparable financial information, all H1 FY20 results in this   NPAT           o NPAT of $35.3m, up 9.7% on prior year.
presentation are disclosed pre the application of AASB 16 (“Pre AASB 16”) and exclude the impact of AASB
16. Refer to page 19 for a statutory review of the results.

              Accent Group Limited H1 FY2020 Results Presentation
                                                                                                                                                                             5
5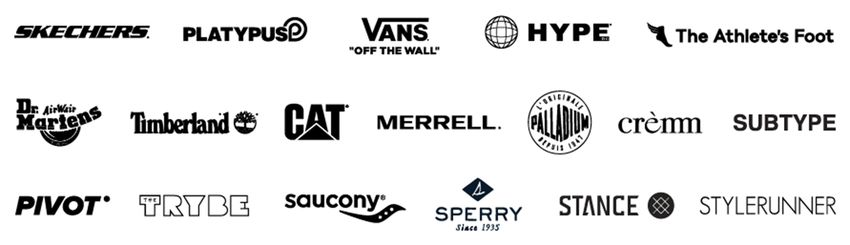
Retail
Retail
Key Financial Highlights                                                            Commentary

    Owned Retail Sales up 15.4% to $382m
                                                                                                  o LFL retail sales up 2.4%1.
    LFL   Sales1   up 2.4%
                                                                                                  o Total digital sales grew by 33%.

                                                                                                  o Skechers, Vans, Dr Martens, Platypus, Caterpillar and
Store      Network2                                                                                 Subtype traded strongly.
                                                               538
                                     479                                                          o Hype continues to be a key focus with initiatives underway
                                                                                                    in refurbishing stores, improving product and brand
           446
                                                                                                    differentiation.
                                      96
                                                                                                  o Opened 51 new stores, refurbished 18 stores and closed
            124                                                                       H1 FY20       8 stores. At the end of H1 FY20, the total store network
                                                                                     Highlights     was 522 stores.

                                                                                                  o 8 The Trybe stores including online store now open and
                                                                                                    trading in line with expectations.
                                     383
            322                                                                                   o 3rd Platypus flagship superstore opened in Highpoint in
                                                                                                    December.

                                                                                                  o TAF sales performance ahead of prior year on both a total
                                                                                                    and like for like basis.
            FY18                     FY19               Forecast FY20
                       Corporate Stores       Franchisees                                         o TAF performance in the key Back to School (BTS) period in
                                                                                                    January was in line with expectations.
1. LFL sales include digital and The Athlete’s Foot franchise stores. 2. Includes
store closures. For a breakdown by banner refer to page 21.

             Accent Group Limited H1 FY2020 Results Presentation
                                                                                                                                                                 7
7
Digital
Contactable customers Commentary
6.2
o Total digital sales grew by 33% for FY20, this was on top
4.8
of the 94% growth in the same period LY.
Customers (Millions)
3.5 o TAF digital sales grew by 44%.
Sales
o 19 websites now in operation across AU & NZ.
o Launch of Crèmm, premium online footwear marketplace.
o Acquisition of Stylerunner.
FY18 FY19 H1 FY20
o Expanded store fulfillment capability now in place for over
500 stores.
Digital
o Continued investment in technology to drive CODB
improvements and margin optimisation.
o 6.2m contactable customers, up 29% (~1.4m customers)
versus June 19.
Customer
o Significant investments continue in CRM and data to
Engagement
maximise customer visitation and engagement.
o Stylerunner has added 600k followers on Instagram.
Accent Group Limited H1 FY2020 Results Presentation
8
8Wholesale & Vertical Brands
Accent Group Limited FY2019 Results Presentation
9Wholesale & vertical brands
Key Financial Highlights Commentary
Wholesale Sales up 6.7% to $62.2m
o Strong sales performance from Vans, Dr Martens, Merrell
and Skechers.
Vertical Distribution and Wholesale o Skechers wholesale sales up on last year whilst the
Skechers store network rollout continues.
o Brand license renewals:
o Merrell renewed until December 2024;
o Dr Martens renewed until March 2024;
H1 FY20
Highlights o Vans renewed until December 2023; and
o Sperry contract extension agreed including key
commercial terms until December 2022.
o Vertical product (shoe care, socks and accessories) strategy
on track.
o Launch of The Trybe Accessories, Shubar, TAF performance
socks and Alpha vertical school shoes. New ranges
launched in Platypus and Hype.
o Acquired vertical apparel brands and design capabilities
through Stylerunner.
Accent Group Limited H1 FY2020 Results Presentation
10
10Growth Plan
Growth plan update
     1      New Stores                                 2       The Athlete’s Foot                     3       Digital & Crèmm

         o At least 70 new stores (excluding               o 70 corporate stores expected by the          o Targeting 20% of sales within the next
           closures) planned to open in FY20                 end of FY20.                                   3 years.
           across all banners.
                                                           o The 2 remaining New Zealand                  o Ongoing investment to scale
                                                             franchisees stores acquired.                   infrastructure and support digital
         o A further 30-40 stores planned by
                                                                                                            growth.
           FY22 across Platypus, Hype,
           Skechers, Dr Martens, CAT, Merrell,             o Corporate store program on track to
           TAF and Vans.                                     drive profit growth in FY20. Back to         o Focus on continued expansion of
                                                             School results in line with                    fulfillment options and CODB
                                                             expectations.                                  improvements.

                                                           o On average new corporate stores              o 58 brands live in Crèmm (13 third
                                                             generate sales of approximately                party brands).
                                                             $1.5m per store and store EBIT
                                                             margin of 13% - 15%.                         o More than 30 new third party brands in
                                                                                                            pipeline.
                                                           o EBIT margin growth from corporate
                                                             stores over time driven by increased         o Investment in Crèmm platform to
                                                             vertical product and distributed               accelerate the onboarding of new
                                                             product mix and improved occupancy             brands, to increase social and brand
                                                             cost.                                          awareness and to enhance the
                                                            No. of                        H1   FY20         platform.
                                                            Stores           FY19        FY20 (fct)

                                                           Corporate          49        66      70

             Accent Group Limited H1 FY2020 Results Presentation
                                                                                                                                                   12
12
Growth plan update (cont’d)
4 Vertical Product 5 The Trybe 6 PIVOT
o Continue to expand this program in o The Group has now opened 7 stores o First 3 stores confirmed.
FY20 and beyond. (Highpoint (VIC), Fountain Gate (VIC),
Werribee (VIC), Macarthur Square
(NSW), Bondi Junction (NSW), o Shellharbour (NSW) to open in April
o On track to deliver $15m in sales in 2020.
FY20. Miranda (NSW) and Castle Towers
(NSW)).
o Launch of Shubar in Hype, Trybe
accessories, TAF performance socks, o The Trybe stores traded in line with
Alpha school shoes and new expectations for the important
accessories ranges in Hype and Christmas and Back To School
Platypus. periods.
o Continue to drive underlying gross
o Accessories launched in store in early
margin improvement as the sales mix
December with dedicated accessories
of vertical products increases.
areas retrofitted into the 4 original
stores. Early results from the
accessories program have been
positive.
o Further stores planned to be rolled out
by June in targeted locations.
Accent Group Limited H1 FY2020 Results Presentation
13
13Growth plan update (cont’d)
7 Stylerunner
o Premium digital business in the fast-
growing women’s athleisure segment.
o Brand led with a focus on growing
brand collaborations and exclusive
strategy to deliver a differentiated
consumer offer.
o Leveraging Accent Group’s trading
terms and shared services to drive
improved profitability.
o Future opportunities for store rollout.
Accent Group Limited H1 FY2020 Results Presentation
14
14Dividends, Trading Update &
Outlook
Accent Group Limited FY2019 Results Presentation
15Dividends, trading update and FY20 outlook
o Accent Group has announced an interim ordinary dividend for FY20 of 5.25 cents per share, fully franked, payable
on 19 March 2020 to shareholders registered on 5 March 2020.
Dividends o The interim dividend is up 16.7% on prior year (H1 FY19, 4.50 cents) ahead of NPAT growth of 9.7%.
o Accent Group continues to be defined by strong cash conversion and the consistent strong returns it delivers on
shareholders’ funds.
Trading Update o For the first 7 weeks of H2 FY20, LFL retail sales are up 3.0% on the same period in the prior year.
o Profit growth in H2 delivered through:
o Low single digit LFL growth, including strong digital growth;
o Growth from at least 70 new stores;
Outlook o Annualisation of stores opened in FY19;
o Growth from TAF corporate stores;
o Gross margin pressure due to FX and competitive environment; and
o Focus on CODB improvement continues.
Accent Group Limited H1 FY2020 Results Presentation
16
16Appendix
Accent Group Limited FY2019 Results Presentation
17Accent Group overview
Accent Group is the largest retailer and wholesaler of premium lifestyle footwear in the Australia and New Zealand region.
Owned Multibrand Retail Banners Vertical Retail & Wholesale Distribution
Retail and Accent has the exclusive rights to distribute these brands in Australia
Wholesale
Distribution
Channels
Third-party Global Brands Exclusively Distributed Global Brands Vertical Products
Strong Brand Leveraging global sourcing
and Product relationships to source vertical products
Relationships such as socks, shoe cleaners, laces and
other product categories
`
Large Digital
Presence and Over 500 stores, Significant Australia and New
Customer Customer engagement— with key presence in both Zealand market share in the
19 Websites
Access 6.2m customers metropolitan and segments in which we
regional areas operate
Accent Group Limited H1 FY2020 Results Presentation
18
21Impact of new lease accounting standard AASB 16 Leases
The implementation of AASB 16 Leases has significantly changed reported results however the standard does not have an economic impact
on the Group, its cashflows, debt covenants or shareholder value. Below is a summary of the H1 FY20 reported results reflecting the adoption
of AASB 16 and a pre AASB 16 view of H1 FY20 results as a direct comparison to the H1 FY19 results.
Profit & Loss
Post AASB 16 Pre AASB 16 Pre AASB 16 Pre AASB 16
$000's
H1 FY20 H1 FY20 H1 FY19 Change
Owned Sales 444,170 444,170 389,391 14.1%
Gross Profit 252,040 252,040 223,112 13.0%
Gross Margin (%) 56.7% 56.7% 57.3% (0.6%)
CODB (154,698) (194,349) (172,409) 12.7%
CODB % 34.8% 43.8% 44.3% (0.5%)
Royalties and franchise fees 5,773 5,773 6,252 (7.7%)
Other Income 4,240 4,240 4,305 (1.5%)
EBITDA 107,355 67,704 61,260 10.5%
Depreciation & amortisation (51,807) (15,062) (13,883) 8.5%
EBIT 55,548 52,642 47,377 11.1%
Net finance costs (7,148) (1,787) (1,588) 12.5%
PBT 48,400 50,855 45,789 11.1%
Tax (14,837) (15,567) (13,630) 14.2%
Net Profit After Tax 33,563 35,288 32,159 9.7%
Accent Group Limited H1 FY2020 Results Presentation
19
23Gross margin and FX rate
Statutory Gross Margin % and FX Rate (AUD/USD Cover)
0.80
57%
0.79
0.78
56%
FX Rate (Forward USD Cover)
Gross Margin %
55% 0.76 0.76
54%
57.3% 0.74
0.74
56.7%
53%
0.73
0.72
54.5%
52% 52.8%
0.70 0.70
51%
51.2%
50% 0.68
FY16 FY17 H1 FY18 H1 FY19 H1 FY20
Gross Margin FX rate (Forward USD cover)
Accent Group Limited H1 FY2020 Results Presentation
20
18Store network and distribution agreements
Store Network1
Dec-19
Other/S’Run
Store Network1 TAF Platypus Skechers Vans Timberland Dr Martens Merrell Hype Subtype Trybe PIVOT Total
ner
Stores at End of
143 114 94 24 7 4 20 65 2 3 3 479
FY19
FY20
Stores Opened 7 10 17 2 7 5 3 51
Stores Closed (4) (1) (2) (1) (8)
Stores at End of
146 124 110 24 7 6 18 71 2 8 0 6 522
H1 FY20
Projection FY20 Up to
Expected at the
146 125 114 24 7 9 18 72 3 10 4 6 538
End of FY202
Distribution Agreements
CAT Apparel Dec-20
Timberland Dec-21
CAT Footwear Dec-21
Saucony Dec-21
Stance Jun-22
Sperry Dec-22 (Contract extension and key commercial terms agreed)
Vans Dec-23
Palladium Dec-23
Dr. Martens Mar-24
Merrell Dec-24
Skechers Dec-26
FY2020 FY2027
1. Includes websites (19) and franchises (80); 2. Net of store closures.
Accent Group Limited H1 FY2020 Results Presentation
21
19Balance sheet
Balance Sheet Commentary
Post AASB 16 Pre AASB 16 Pre AASB 16 o Inventory increased due to investment in new
$000's
H1 FY20 H1 FY20 H1 FY19 stores and TAF corporate store acquisitions, along
with increased stock in transit due to the
Trade receivables and movement in Chinese New Year (H1 FY20:
35,328 35,328 25,584
prepayments $33.1m, H1 FY19: $19.8m).
Inventories 164,151 164,151 126,148
o Property, plant and equipment increased due to
Trade payables & provisions (146,970) (157,678) (124,761) significant investment in new stores and new
digital infrastructure.
Net working capital 52,509 41,801 26,971
o Trade and other payables consistent with our
Intangible assets 358,833 358,833 353,020 inventory growth.
Property, plant and equipment 103,283 103,283 83,891
Capital investments 462,116 462,116 436,911
Lease receivable 28,656 - -
Right of use asset 265,693 - -
Lease liabilities (356,435) - -
Lease balances (62,086)
Net debt (47,053) (47,053) (31,036)
Deferred income (8,689) (47,302) (32,669)
Tax and derivatives 14,067 10,243 5,834
Net Assets / Equity 410,864 419,805 406,011
Accent Group Limited H1 FY2020 Results Presentation
22
20Cash flow
Cash Flow – Comparable Financial Information Commentary
o Increase in property, plant and equipment driven
Pre AASB 16 Pre AASB 16 from significant investment in 51 new stores and 18
H1 FY20 H1 FY19 refurbishments, compared to 35 new stores and 15
$000's
refurbishments in H1 FY19.
EBITDA 67,704 61,260
Change in working capital 6,177 5,523 o Payments for the purchases of business include
the acquisition of Stylerunner and 12 TAF
Net interest and finance costs paid (1,900) (2,261) corporate stores.
Income tax paid (24,049) (18,584)
o Strong free cash flow and cash conversion.
Other (406) 3,373
Net cash flows from operating activities 47,525 49,311
Purchases of PP&E (17,504) (13,392)
Net payments for purchase of business (7,927) (11,387)
Net cash flows from investing activities (25,431) (24,779)
Free cash flow 22,094 24,532
Proceeds from issue of shares 672 820
Net proceeds from borrowings 5,000 (2,500)
Dividends paid (20,297) (20,341)
Net cash from financing activities (14,625) (22,021)
Net cash flow 7,469 2,511
Accent Group Limited H1 FY2020 Results Presentation
23
5Notice and Disclaimer
o This presentation contains summary information about Accent Group Limited which is current as at the date of this
presentation.
o This presentation contains certain forward-looking statements, including indications of, and guidance on, future
earnings and financial position and performance. Such forward-looking statements are based on estimates and
assumptions that, whilst considered reasonable by Accent Group, are subject to risks and uncertainties. Forward-
looking statements are not guarantees of future performance and are provided as a general guide only. They
should not be relied upon as an indication or guarantee of future performance. Actual results and achievements
could be significantly different from those expressed in or implied by this information. Neither Accent Group nor its
directors give any assurance that the forecast performance in the forecasts or any forward-looking statement
contained in this presentation will be achieved.
Important Notice
and Disclaimer
o No representation or warranty, express or implied, is or will be made in relation to the fairness, accuracy,
completeness or correctness of all or part of this presentation, or the accuracy, likelihood of achievement or
reasonableness of any forecasts, prospects or returns contained in, or implied by, the information or any part of it.
To the full extent permitted by law, Accent Group disclaims any liability in connection with this presentation and
any obligation or undertaking to release any updates or revisions to the information contained in this presentation
to reflect any change in expectations or assumptions.
o This presentation is for information purposes only and is not an invitation or offer of securities for subscription,
purchase or sale in any jurisdiction. This presentation does not constitute investment or financial product advice
(nor tax, accounting or legal advice) or any recommendation to acquire securities. Each recipient of this
presentation should make its own enquiries and investigations regarding all information in this presentation.
Accent Group Limited H1 FY2020 Results Presentation
24
24You can also read