HESKA CORPORATION INVESTOR PRESENTATION - HSKA MARCH 2020

Page created by Ken Campos
 
CONTINUE READING
HESKA CORPORATION INVESTOR PRESENTATION - HSKA MARCH 2020
HESKA CORPORATION   INVESTOR PRESENTATION
     HSKA
     MARCH 2020
HESKA CORPORATION INVESTOR PRESENTATION - HSKA MARCH 2020
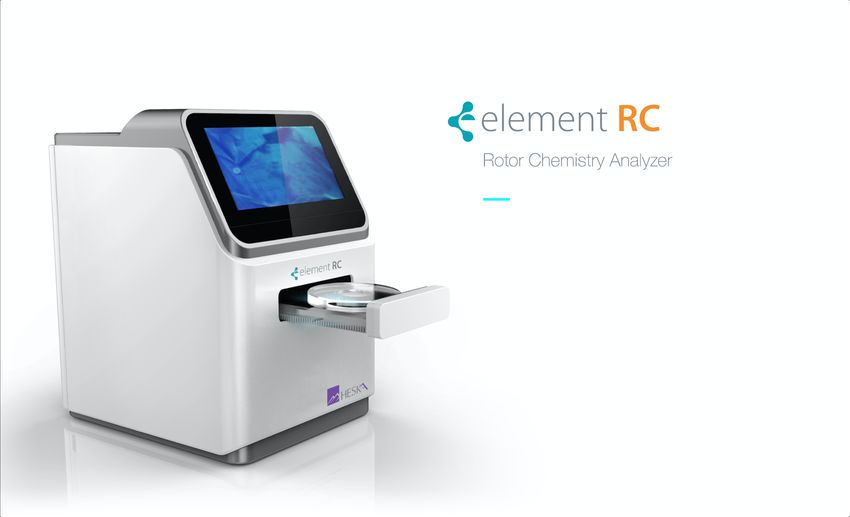
01 SAFE HARBOR NOTICES
  This presentation contains forward-looking information related to the Heska Corporation (the “Company”). This forward-looking information generally includes statements that are
  predictive in nature and depend upon or refer to future events or conditions, and include words such as “believes,” “plans,” “anticipates,” “expects,” “intends,” “strategy,” “future,”
  “opportunity,” “may,” “will,” “should,” “could,” “potential,” or similar expressions. All of the statements in this document, other than historical facts, are forward-looking statements and
  are based on a number of assumptions that could ultimately prove inaccurate and cause actual results to materially deviate from forward-looking statements. Forward-looking
  statements in this document include, among other things, statements with respect to future sales, sales split percentages, sales geography percentages, market share, and strategic
  goals, the expected timing of the scil Acquisition and its funding and its anticipated benefits; the expected conversion of the Preferred Shares into shares of Public Common Stock;
  anticipated investments and growth; and the number of customers that the Company will be able to acquire and retain. Such statements are subject to risks and uncertainties,
  including, but not limited to, uncertainties related to the closing of the Acquisition; the obtaining of shareholder approval to increase the number of shares of Public Common Stock
  authorized by the Company’s Certificate of Incorporation; the ability to achieve the anticipated benefits of the Acquisition uncertainties related to supplier availability, competing
  suppliers, any product’s ability to perform and be recognized as anticipated, in particular when such product is under development; uncertainties related to Heska’s ability to sell and
  market its products in an economically sustainable fashion, including related to varying customs, cultures, languages and sales cycles and uncertainties with foreign political and
  economic climates; and the Company’s ability to integrate the acquired scil business within its existing operations; and new product development and release schedules. Other
  factors that could cause actual results to differ materially from those matters expressed in or implied by such forward-looking statements are set forth under “Risk Factors” in the
  Company’s most recent annual report on Form 10-K and subsequent quarterly reports on Form 10-Q.

                                                                                                  2
HESKA CORPORATION INVESTOR PRESENTATION - HSKA MARCH 2020
Today’s Presentation

 1. Pet Healthcare Universe and Heska Overview

 2. Heska Three Point Strategy

         Double Customers & Geography Served

         Double Product & Revenue Streams Served

         Continue Core Base Business Growth
             (12%-17%+ Consumables Target)
HESKA CORPORATION INVESTOR PRESENTATION - HSKA MARCH 2020
Pet Healthcare Universe Overview
HESKA CORPORATION INVESTOR PRESENTATION - HSKA MARCH 2020
(1) Point of Care      (2) Reference Lab
                                  (3) Rapid Singles      (4) Imaging

Diagnostics Drives >25% of Care                                              Diagnostics Drives “Test & Treat”

                                      Diagnostics Drives Rx & Therapy
                                                                                                        5
HESKA CORPORATION INVESTOR PRESENTATION - HSKA MARCH 2020
Supportive Growth Trends Global & Demographic
      Average Canine Vet Visits per Year by Owner Age                                                   Global Veterinary Diagnostics Market > $2 Billion

                                               incr ease                                                                                  CAGR
                                           27%
                                                                                                                                                                                    2,574
                                                                                                                                    9. 2%
                                                                                 3.3                                                                               2,352
                                                                                                                                                 2,154
                                                                                                                               1,976
               2.6                   2.6                   2.6                                                1,813

        Silent Generation      Baby Boomers              Gen X               Mille nnials                     2017              2018             2019              2020             2021

      ~26,000 veterinary hospitals (USA)                                                                     ~65,000 veterinary hospitals (Intl)

Amounts estimated. Source: American Pet Prod Assoc Generational Report; 2017-18 Pet Owners’ Survey; American Pet Products Association; Technavio Global Veterinary Diagnostics Market 2017-2021 report
HESKA CORPORATION INVESTOR PRESENTATION - HSKA MARCH 2020
DIAGNOSTICS IS CENTRAL & SCARCE

                                     Reference Laboratory                                                                                                       Point of Care

                           North America Reference Lab Share                                                                                                North America POC Share

                                                                                   ≈ 50%                                                                   ≈ 65%

                                                                                   ≈ 48%                                                                   ≈ 12%

                                                                                    ≈ 2%                                                                   ≈ 23%

Information derived from publicly available information data disclosed by third-party sources, our own internal estimates based on such data, and our knowledge of the industry; it has not been independently verified and we cannot assure you of its
accuracy or completeness. Our internal estimates have not been independently verified. While we are not aware of any misstatements regarding this information, we cannot guarantee its accuracy or completeness.
HESKA CORPORATION INVESTOR PRESENTATION - HSKA MARCH 2020
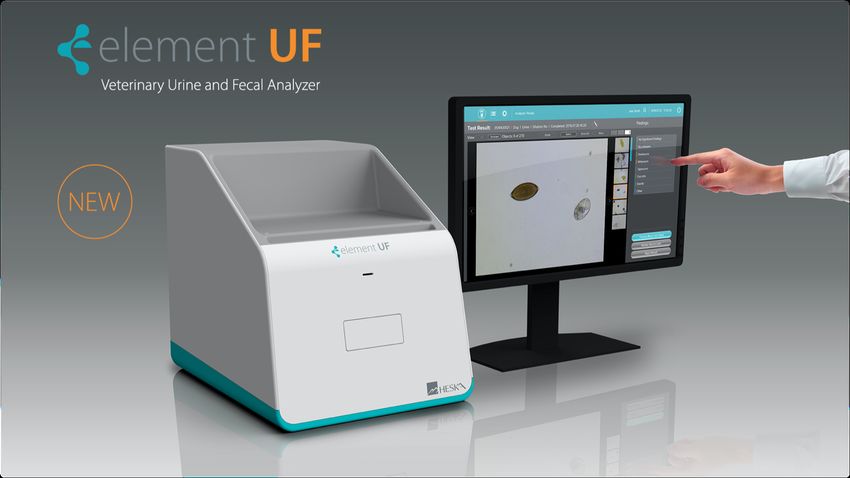
Veterinary Healthcare                                           Point of Care Diagnostics
• Humanization of pets globally                                 • ~ 6%-8% Annual Global Veterinary Diagnostics Growth1

• Lifecycle “family member” juvenile, wellness and aging care   • Major veterinarian revenue / profit center in 90% of hospitals

• Historically recession resistant                              • Diagnostics utilization is key (15% - 25%+ of hospital pet visits)1

• Positive regulatory, payor and demographic trends             • Increases in hospital pet visits (~2% - 5%)1

• Accelerating industry investment and consolidation            • Favored by veterinarians (veterinary licensure required)

                                                                • New point of care technologies pull tests to point of care

                                                                • Pricing tends to increase each year

                                                                • High priority spend item has revenue security in tight budgets

                                                                   1
                                                                    Information derived from publicly available information data disclosed by third-party sources, our own internal
                                                                   estimates based on such data, and our knowledge of the industry; it has not been independently verified and
                                                                   we cannot assure you of its accuracy or completeness. Our internal estimates have not been independently
                                                                   verified. While we are not aware of any misstatements regarding this information, we cannot guarantee its
                                                                   accuracy or completeness. Source: American Pet Prod Assoc Generational Report; 2017-18 Pet Owners’
                                                                   Survey; American Pet Products Association; Technavio Global Veterinary Diagnostics Market 2017-2021 report.
HESKA CORPORATION INVESTOR PRESENTATION - HSKA MARCH 2020
Leading Point of Care Full Product Portfolio “Complete Voice of the Pet”

       Element DC      Element DC5X      Element RC         Element HT5        Element i+    Element POC     Element COAG
        Chemistry        Chemistry        Chemistry         Hematology        Immunoassay   Gas & E-M Lyte    Coagulation

        Element UF      Cloud Data     Hospital Digital    Portable Digital      Digital       Digital           Vet/IV
       Urine & Fecal     Solution       Radiography         Radiography        Ultrasound    Endoscopy       Infusion Pump

        Heartworm      Heartworm      Allergy Diagnostic
        Diagnostic     Therapeutic     Immunotherapy
                                                                                                                     9
HESKA CORPORATION INVESTOR PRESENTATION - HSKA MARCH 2020
02 ~90% of Heska POC Lab Consumables on Long-Term Subscription 1,2,3

                                                     Minimum contract subscription value ($MM)1
                                                                                                                                                              +41%
                                                                                                                           GR
                                                                                                                     28% CA                                  $101.6
                                                                                                                                                +28%
                                                                                                                                 +11%           $72.0
                                                                                                                 +34%
                                                                                                                                 $56.4
                                                                                                                 $51.0
                                                                                                 $38.0

                                                                                                 2015            2016           2017            2018          2019
                                             Subscriptions                                       1,239           1,667          1,950           2,175         2,376
                                                       % Growth                                   N/A             35%            17%             12%           9%
                                             Months Under Subscription                          54,200          68,750         75,950          90,850        100,249
                                                       % Growth                                   N/A             27%            10%             20%          10%
                                             Monthly Contract Subscription Value                 $701            $742            $743           $792          $864
                                                       % Growth                                   N/A             13%             0%              7%           9%

                                                                              Subscriber Retention >95%

                    1   Includes Corporate Accounts estimates similar to individual accounts CSV (Contract Subscription Value). 3 As of December 31, 2019.
                    2   Represents minimum contract subscription value / subscription months
Heska Three Point Strategy for 2018 to 2023

            Double Customers & Geography Served

            Double Product & Revenue Streams Served

            Continue Core Base Business Growth
                (12%-17%+ Consumables Target)
Double Customers and Geography

                                                                                    Expect $200 Million in Sales for 2020
                                                                                    Over 500 Professionals with over 150 Direct Sales
                                                                                    Direct Sales Teams in 10 Countries
                                                                                    Logistics and Operations in 7 Countries
                                                                                    Installations of over 30,000 Analyzers

Information from Heska data and internal estimates of scil data provided to Heska from scil. Direct Sales teams include RM, TM, ISAM, FSR, Imaging, Sales Management, and Other. Heska has not independently verified the data from third party and cannot assure its accuracy or completeness,
and Heska internal and scil estimates have not been independently verified. Sales estimate based on scil closing date on or before April 1, 2020, adjustments anticipated for equipment portion of revenue recognition under subscriptions agreements, integration effects, and other variabilities;
estimate may materially deviate from actual performance. While Heska is not aware of any misstatements regarding this information, Heska cannot guarantee its accuracy or completeness. Information regarding future sales are forward-looking statements and actual results can materially differ
from those noted, due to several factors, including but not limited to market, currency, integration, supplier, distributor, scil, and Heska performance and those mentioned in Safe Harbor and forward-looking statements disclaimer herein.
Now we Serve 25 Markets… and Growing.

               United States                                                    Germany                                       Spain                                                      Spain                                                                 France

                      Canada                                                    Canada                                        France
                     Australia                                                  Italy                                         Netherlands
               Latin America                                                    Czech Republic                                Poland
                                                                                United Kingdom                                And More

Information regarding market share and market position is derived from data from publicly available information disclosed by third party sources and Heska internal estimates based on such data, scil data, and Heska’s knowledge of the industry. Heska has not independently verified the data from
third party sources and cannot assure its accuracy or completeness, and Heska internal and scil estimates have not been independently verified. Data specifically excludes items not point of care, including central reference laboratories and single use “rapid” tests. While Heska is not aware of any
misstatements regarding this information, Heska cannot guarantee its accuracy or completeness. Information regarding future sales, sales split percentages, sales geography percentages, and goals are forward-looking statements and actual results can materially differ from those noted, due to
several factors, including but not limited to market, currency, integration, supplier, distributor, scil, and Heska performance and those mentioned in Safe Harbor and forward-looking statements disclaimer herein.
Now we are #1, #2, or #3 Key Markets… and Growing.

                                                                                               United States                                     #3                 ≈ 12.5%
                                                                                               Canada                                            #3                 ≈ 13.0%
                                                                                               Germany                                           #1                 ≈ 40.0%
                                                                                               Spain                                             #1                 ≈ 40.0%
                                                                                               France                                            #2                 ≈ 30.0%

Information regarding market share and market position is derived from data from publicly available information disclosed by third party sources and Heska internal estimates based on such data, scil data, and Heska’s knowledge of the industry. Heska has not independently verified the data from
third party sources and cannot assure its accuracy or completeness, and Heska internal and scil estimates have not been independently verified. Data specifically excludes items not point of care, including central reference laboratories and single use “rapid” tests. While Heska is not aware of any
misstatements regarding this information, Heska cannot guarantee its accuracy or completeness. Information regarding future sales, sales split percentages, sales geography percentages, and goals are forward-looking statements and actual results can materially differ from those noted, due to
several factors, including but not limited to market, currency, integration, supplier, distributor, scil, and Heska performance and those mentioned in Safe Harbor and forward-looking statements disclaimer herein.
New Global Presence to Double Customer Opportunities
                  2018 Sales Geography (2)                                                 2020 Sales Geography (1)

                                                                                                                               Europe
                                                                                                                                37%
                    USA
                    91%
                                                                                            USA
                                                                                            55%
                                                                               Europe 5%                                              7%
                                                                                                                                                 Canada
                                                                         Canada 2%
                                                                       RoW 2%                                                             RoW 2%

                ~26,000 hospitals (USA)                                                     ~65,000 hospitals (Intl)
                                                                                                  1. 2020 is forward looking estimate subject to closing of scil Acquisition and
                                                                                                  numerous other factors outlined in the Company’s press release of January 14,
                                                                                                  2020 and Safe Harbor in this presentation. Amounts not GAAP and are estimates;
2. All amounts rounded and not GAAP. Refer to 10K ending December 31, 2018 for                    results may materially differ. Management believes this visual will assist investors to
GAAP, segments, revenue recognition, and other information relevant to (1) and (2).               understand the Company’s business and strategy.
International Acquired Sales Mix Favorable

                                                                                                                          Starting Ex-US Sales Mix(1)

                                                                                                                                                                 Imaging
                                                                                                                                                                   30%

                                                                                                                          Lab
                                                                                                                          60%
                                                                                                                                                                     10%         Other Core
                                                                                                                                                                                Comp Animal

1. All amounts rounded and not GAAP and estimated for 2020; amounts are forward looking estimate subject numerous factors outlined in the Company’s press release of January 14, 2020 and Safe Harbor in this presentation. Actual results may
materially differ. Management believes this visual will assist investors to understand the Company’s business and strategy.
Estimated Consolidated Sales Mix
                         2018 Sales Mix (2)                                                                              2020 Sales Mix(1)

                              Imaging                                  Other Core
                                                                                                                                                         Imaging
                                18%                                   Comp Animal
                                                        22%                                                                                                25%

                                                                                                                                                                       12%          Other Core
                                                                                                                     Lab                                                           Comp Animal
                                                             15%               Other                                 55%
                      Lab
                      45%                                                Vaccine & Pharma                                                                           8%
                                                                                                                                                                               Other
                                                                                                                                                                         Vaccine & Pharma

2. All amounts rounded and not GAAP. Refer to 10K ending December 31, 2018 for GAAP, segments,   1. 2020 is forward looking estimate subject to closing of scil Acquisition and numerous other factors outlined in the
revenue recognition, and other information relevant to (1) and (2).                              Company’s press release of January 14, 2020 and Safe Harbor in this presentation. Amounts not GAAP and are
                                                                                                 estimates; results may materially differ.
Positive Proforma Capital Structure (Estimated)

                                                                                                                                                                         $MM                              Proforma

     ① Accretive Acquisitions                                                                                                                             Combined Cash                                             $66.0

                                                                                                                                                          Combined Debt                                             $92.5
     ② Deleveraging Acquisitions
                                                                                                                                                          Net Debt                                                  $26.5
     ③ Strong Debt to Capitalization Ratios after Acquisitions
                                                                                                                                                          Market Cap (HSKA)                                       $882.2
     ④ Common Stock Dilution provided for is less than 20%
                                                                                                                                                          Total Capitalization                                    $974.7

                                                                                                                                                          Net Debt / Cap                                             2.7%

                                                                                                                                                          Total Debt / Cap                                           9.5%

Starting Cash and Combined Debt starting balance as of September 30, 2019. Acquisition of scil calculated on “debt free – cash free”. Market Cap starting balance from January 14, 2020 ($757.2MM) plus $125MM for scil Acquisition financing.
Amounts unaudited. While we are not aware of any misstatements regarding this information, we cannot guarantee its accuracy or completeness.
Heska is a Good Owner of These Assets with Strong Management in First Five Year Plan (2013-2017)

                                                                  Heska                        Heska
                 $MM, except p/share
                                                                  2013                         2017                            Getting
                                                                                                                               Product
         Revenue                                                    $78.3                      $129.3
                                                                                                                                Right
         Gross margin %                                               39%                           45%
                                                                                                            Getting                            Getting
         Operating margin %                                           (2%)                          14%    Narrative                            Team
                                                                                                             Right                              Right
         Operating Income                                         ($1.43)                          $18.2

         Earnings per share                                       ($0.21)                          $1.3¹

         Assets                                                     $93.6                      $135.8                Getting             Getting
                                                                                                                     Model                Costs
         Equity                                                     $47.1                      $100.4                 Right               Right
     ¹ 2017 U.S Tax Reform impacts of +/- ($5.9M) included, as further discussed in our Form 10-
     K/A for the year ended December 31,2017
02 Strong Management Results First Five Year Plan (2013-2017)

                                                       Heska               Heska                Scil-CVM
          $MM, except p/share
                                                       2013                2017               2020 Estimate                       Getting
        Revenue                                            $78.3             $129.3               < $75.0
                                                                                                                                  Product
                                                                                                                                   Right
        Gross margin %                                       39%                 45%              < 35%
                                                                                                               Getting                            Getting
        Net Revenue CAGR                                                      10.2%                           Narrative                            Team
                                                                                                                Right                              Right
        Gross Profit CAGR                                                     13.1%

        Core Supplies CAGR                                                    12.9%

                                                                                                                        Getting             Getting
                                                                                                                        Model                Costs
                                                                                                                         Right               Right
    ¹ 2017 U.S Tax Reform impacts of +/- ($5.9M) included, as further discussed in our Form 10-
    K/A for the year ended December 31,2017
Double Products and Revenue Streams
Research and Growth Development Investments

2018 $19MM R&D Business Development Investments

   •Core Technologies and Inventions for Product Pipeline

   •Sales Team Expansion

   •Prepare Heska to Manufacture Heska POC Diagnostics Test Cards

2019 Accelerated R&D up +190% YOY

   •New Analyzer Platforms for 2nd Half 2019 & FY2020
2020 Major Product Expansion

                          International Markets 2020

                          Global Veterinary and Animal Health
                          20 Tests per Rotor (v 14 Tests on Launch)
                          Two way wireless and Ethernet
                          Superior run-time and performance
                          Under 12 pounds (5.5kg)
                          Superior Heska Reset Economics
2020 Major Product Expansion

       High Sensitivity Immunodiagnostics Multi Plex Analyzer (>$100M Target)

            2020 Assays in Development            2020 Assays in Development
              Non-Regulatory (USDA)                   Regulated (USDA)

            Total T4                              Canine Heartworm   (4+ Plex)
            Cortisol Canine                       Lyme               (4+ Plex)
            TSH                                   Anaplasma          (4+ Plex)
            Progesterone                          Ehrlichia          (4+ Plex)

                                                      Major Drivers
2020 Major Product Expansion

                                                       (Mid 2020)

                   Urine Automatic Imaging (>$100M Target)
                   5 Million Urine Sedimentation Exams Annually
                   7,000+ Competitive Sediment Analyzers in validated market

                   Fecal Automatic Imaging (>$300M Target)
                   30 Million Manual Point of Care Fecal Floatation Exams
                   Roundworm, Hookworm, Tapeworm, Whipworm, Flukeworm, Giardia & more…

                                                  Major Drivers
2020 Major Product Expansion

                                                        (Mid 2020)

                        Production and Development Plan Outlook

                        þ Test Supplies and Test Beds Validated

                        þ Alpha Instruments & Low Volume Test Supplies

                         þ Sales Training & Public Marketing
                             (VMX Orlando, WVC Las Vegas)

              Q3 2020   Beta Instruments & Test Supplies Manufacturing in Volume

              Q4 2020   Production Instruments in Volume Begins

                                                Major Drivers
Continue Core Business Growth
Continue Core Business Growth (Organic and Acquired)

  1) Grow Market Share                                2) Grow Utilization in Existing Sites
  •   Continue New Single User Subscriptions Wins     •   Launch New Tests on several Analyzers (2019-2020)
  •   Continue Corporate Groups Sites Installs        •   Capture Positive Market Trends & Demographics

  •   Continue Expanded Sales Teams                   •   More Patient Visits & Hospital Growth

  •   Expand into International POC Market Share      •   Higher % of Patient Visits doing a Diagnostic

  3) Grow Price                                       4) Grow Products
  •   Price (4%) Annual Escalators in Subscriptions   •   New and Upgrade Products from R&D

  •   New Tests and Panels Launches                   •   New and Upgrade Products from Acquisitions
04 Q4 and Full Year 2019 Highlights

      Key Metrics                              Commentary

      •   $33.8MM Q4 Revenue                   • 6th straight year of net market share gains in end-user hospitals

                                               • Core POC Lab Consumables up 19.7% v 12-17% Outlook
      •   $122.7MM FY Revenue
                                               • Strong 2019 subscribers retention (95%), with Months Under
      •   Total Gross Margin 44.4%               Subscription, Contract Subscription Value well above Outlook

      •   CCA Gross Margin up to 50.3%         • 2020 major product launches, demand, & feasibility affirmed

      •   FY Consumables Growth up 19.7% YOY   • Transformative geographic expansion

                                                    29
You can also read