Second quarter 2019 conference call - August 1, 2019 - TC Energy
←
→
Page content transcription
If your browser does not render page correctly, please read the page content below
Second quarter 2019 conference call
August 1, 2019

Forward looking information and non‐GAAP measures
This presentation includes certain forward looking information, including future oriented financial information or financial outlook, which is intended to help
current and potential investors understand management’s assessment of our future plans and financial outlook, and our future prospects overall. Statements
that are forward-looking are based on certain assumptions and on what we know and expect today and generally include words like anticipate, expect, believe,
may, will, should, estimate or other similar words.
Forward-looking statements do not guarantee future performance. Actual events and results could be significantly different because of assumptions, risks or
uncertainties related to our business or events that happen after the date of this presentation. Our forward-looking information in this presentation includes
statements related to future dividend and earnings growth and the future growth of our core businesses, among other things.
Our forward looking information is based on certain key assumptions and is subject to risks and uncertainties, including but not limited to: our ability to
successfully implement our strategic priorities and whether they will yield the expected benefits, our ability to implement a capital allocation strategy aligned
with maximizing shareholder value, the operating performance of our pipeline and power and storage assets, amount of capacity sold and rates achieved in our
pipeline businesses, the amount of capacity payments and revenues from our power generation assets due to plant availability, production levels within supply
basins, construction and completion of capital projects, costs for labour, equipment and materials, the availability and market prices of commodities, access to
capital markets on competitive terms, interest, tax and foreign exchange rates, performance and credit risk of our counterparties, regulatory decisions and
outcomes of legal proceedings, including arbitration and insurance claims, changes in environmental and other laws and regulations, our ability to effectively
anticipate and assess changes to government policies and regulations, competition in the pipeline, power and storage sectors, unexpected or unusual weather,
acts of civil disobedience, cyber security and technological developments, and economic conditions in North America as well as globally. You can read more
about these risks and others in our July 31, 2019 Quarterly Report to Shareholders and 2018 Annual Report filed with Canadian securities regulators and the
SEC and available at www.tcenergy.com.
As actual results could vary significantly from the forward-looking information, you should not put undue reliance on forward-looking information and should not
use future-oriented information or financial outlooks for anything other than their intended purpose. We do not update our forward-looking statements due to
new information or future events, unless we are required to by law.
This presentation contains reference to certain financial measures (non-GAAP measures) that do not have any standardized meaning as prescribed by U.S.
generally accepted accounting principles (GAAP) and therefore may not be comparable to similar measures presented by other entities. These non-GAAP
measures may include Comparable Earnings, Comparable Earnings per Common Share, Comparable Earnings Before Interest, Taxes, Depreciation and
Amortization (Comparable EBITDA), Funds Generated from Operations, Comparable Funds Generated from Operations, Comparable Distributable Cash Flow
(DCF) and Comparable DCF per Common Share. Reconciliations to the most directly comparable GAAP measures are included in this presentation and in our
July 31, 2019 Quarterly Report to Shareholders filed with Canadian securities regulators and the SEC and available at www.tcenergy.com.

                                                                                                                                                                    2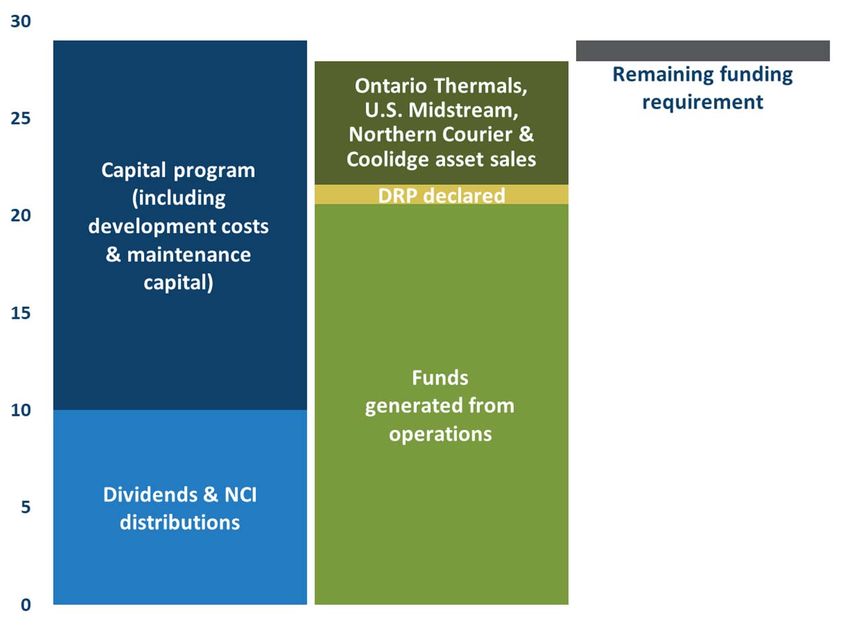
Russ Girling
President & CEO

                   3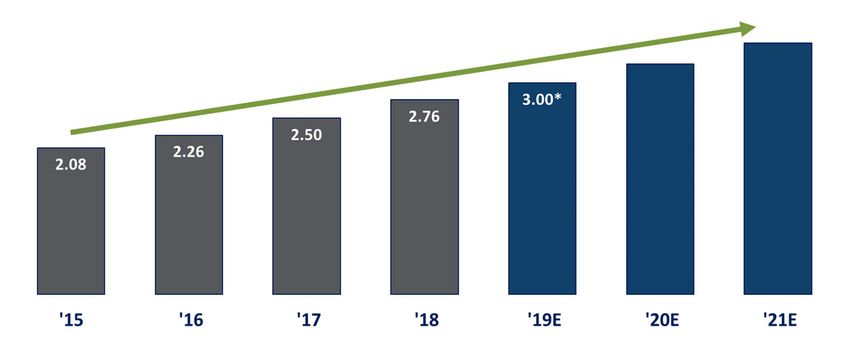
Second quarter 2019 accomplishments
Generated strong financial results
  • Comparable earnings were $1.00 per common share
  • Comparable funds generated from operations of $1.7 billion
Advanced $32 billion secured capital program
  • Placed ~$5.6 billion of projects into service through the first half of 2019
  • Additional ~$7 billion expected to be completed by end of year
Progressed over $20 billion of projects under development
  • Received new Presidential Permit for Keystone XL
  • Continued to advance Bruce Power life extension program
Funded capital program on compelling terms
  • Issued $1.0 billion of long‐term debt in April 2019
  • Raised $238 million through the DRP program in second quarter, $464 million year‐to‐date
  • Coolidge, Northern Courier, Columbia Midstream and Ontario natural gas‐fired power plant asset sales expected to generate
    $6.3 billion in proceeds in 2019
Strong performance expected to continue
   • 2019 comparable earnings per share expected to be higher than 2018
   • Financial position remains solid, well positioned to fund future capital programs and achieve targeted credit metrics
                       High‐quality, diversified asset portfolio continues to benefit
                                 from supportive market fundamentals
                                                                                                                                4
Financial highlights – Three months ended June 30 (Non‐GAAP)
Comparable Comparable Comparable funds
earnings per common share* EBITDA* generated from operations*
(Dollars) ($Millions) ($Millions)
16% increase 17% increase 14% increase
2,324
1.00
1,991
0.86
1,667
1,459
2018 2019 2018 2019 2018 2019
*Comparable Earnings per Common Share, Comparable EBITDA and Comparable Funds Generated from Operations are non-GAAP measures. See the forward looking information and non-GAAP measures slide at the front of this presentation for more
information. 5Natural Gas Pipelines recent developments
Canadian Natural Gas Pipelines
• Advancing $8.8 billion NGTL System expansion program that will add
more than 3.0 Bcf/d of delivery capacity
• Construction continues on the $6.2 billion Coastal GasLink project that
will have an initial capacity of 2.1 Bcf/d
U.S. Natural Gas Pipelines
• Louisiana XPress and Grand Chenier XPress added to secured project
backlog at a combined cost of US$0.6 billion
• US$0.3 billion East Lateral XPress to advance subject to customer FID
Mexico Natural Gas Pipelines
• Sur de Texas construction and commissioning activities completed
• Phased in‐service of Villa de Reyes expected to commence in late 2019
• Tula expected to be completed in 2021
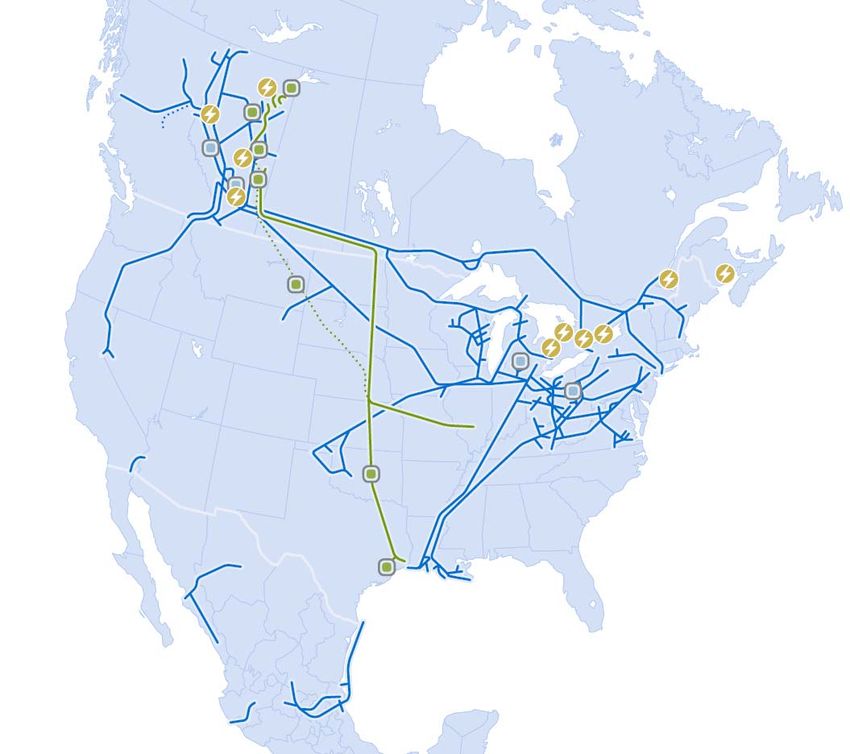
Premier system connects prolific gas supplies
to high growth markets
6Liquids Pipelines recent developments
• Assets continue to produce strong operating results
• White Spruce pipeline placed in‐service
• Keystone XL continues to advance
• Received new Presidential Permit in March which supersedes
the 2017 permit
• Nebraska Supreme Court expected to reach a decision in third
quarter 2019 on challenge to Public Service Commission’s route
approval
Contiguous path from supply to market
7Power and Storage recent developments
Napanee Power Plant (900 MW)
• Commercial operations expected to commence by the end of 2019
• Total investment expected to be ~$1.8 billion
Bruce Power
• Unit 6 Major Component Replacement expected to begin in 2020
• Power price increased to ~$78 per MWh on April 1, 2019 to reflect
$2.2 billion investment in project and ongoing asset management
program
Combined generating capacity of ~4,200 megawatts following sale of
Ontario natural gas‐fired plants
Remain interested in new low‐risk investment opportunities within
our core North American markets
~95% of generating capacity underpinned by
long‐term contracts
8Advancing $32 billion secured capital program through 2023
Estimated Capital Expected
Project Invested to Date*
Cost* In‐Service Date*
Sur de Texas US 1.6 US 1.6 2019
Napanee 1.8 1.7 2019
NGTL System 2.6 2.2 2019
Modernization II US 1.1 US 0.6 2019‐2020
Villa de Reyes US 0.9 US 0.7 2019‐2020
NGTL System 2.1 0.4 2020
Other Liquids Pipelines 0.1 ‐ 2020
Other U.S. Natural Gas Pipelines US 1.1 US 0.1 2019‐2021
Canadian Natural Gas Pipelines Regulated Maintenance 1.8 0.3 2019‐2021
U.S. Natural Gas Pipelines Regulated Maintenance US 2.0 US 0.2 2019‐2021
Liquids Pipelines Recoverable Maintenance 0.1 ‐ 2019‐2021
Non‐recoverable Maintenance 0.7 0.1 2019‐2021
Tula US 0.7 US 0.6 2021
NGTL System 2.6 0.1 2021
Canadian Mainline 0.4 0.1 2019‐2022
NGTL System 1.5 ‐ 2022+
Bruce Power Life Extension** 2.2 0.8 2019‐2023
Coastal GasLink 6.2 0.3 2023
Foreign Exchange Impact (1.31 exchange rate) 2.3 1.2 ‐
Total Canadian Equivalent 31.8 11.0
Approximately $7 billion of projects expected to be completed by the end of 2019
* Billions of dollars. Certain projects are subject to various conditions including corporate and regulatory approvals. ** Our proportionate share. 9Dividend growth outlook
Annual growth of 8 to 10 per cent through 2021
Supported by expected growth in earnings and cash flow
and continued strong coverage ratios
* Annual rate based on third quarter dividend declared of $0.75 per share. 10Key takeaways
Proven strategy – Low risk business model
• ~95% of comparable EBITDA from regulated assets or long‐term contracts
Business continued to produce strong results in second quarter 2019
• Demand for our services has never been greater
Visible growth
• Advancing $32 billion of secured growth projects
• Over $20 billion of projects under development
• Additional organic growth expected from existing businesses
Dividend poised to grow
• Increased by 8.7 per cent in February 2019 to $3.00 per share on an
annualized basis
• Expect annual growth of 8 to 10 per cent through 2021
Financial strength and flexibility
• Portfolio management expected to generate proceeds of $6.3 billion in 2019
• Numerous levers available to fund growth
• On track to achieve targeted credit metrics
Delivered 14% annual total shareholder return since 2000
11Don Marchand
Executive VP & CFO
12Consolidated results of operations
(millions of dollars, except per share amounts)
Three months Six months
ended June 30 ended June 30
2019 2018 2019 2018
Net Income Attributable to Common Shares 1,125 785 2,129 1,519
Specific items (net of tax):
Gain on sale of Coolidge generating station (54) ‐ (54) ‐
Alberta corporate income tax rate reduction (32) ‐ (32) ‐
U.S. Northeast power marketing contracts (6) 11 6 5
Risk management activities (109) (28) (138) 108
Comparable Earnings(1) 924 768 1,911 1,632
Net Income Per Common Share $1.21 $0.88 $2.30 $1.70
Specific items (net of tax):
Gain on sale of Coolidge generating station (0.06) ‐ (0.06) ‐
Alberta corporate income tax rate reduction (0.03) ‐ (0.03) ‐
U.S. Northeast power marketing contracts (0.01) 0.01 0.01 0.01
Risk management activities (0.11) (0.03) (0.15) 0.12
Comparable Earnings Per Common Share(1) $1.00 $0.86 $2.07 $1.83
Weighted Average Basic Common Shares Outstanding (millions) 927 896 924 892
(1) Non-GAAP measure and excludes specific items. See the forward looking information and non-GAAP measures slide at the front of this presentation for more information. 13Business segment results(1)
(millions of dollars)
Three months Six months
ended June 30 ended June 30
2019 2018 2019 2018
Comparable EBITDA(2)
Canadian Natural Gas Pipelines 528 545 1,084 1,039
U.S. Natural Gas Pipelines 857 704 1,829 1,508
Mexico Natural Gas Pipelines 141 142 287 302
Liquids Pipelines 582 413 1,145 844
Power and Storage 219 202 370 378
Corporate (3) (15) (8) (17)
Total 2,324 1,991 4,707 4,054
Second quarter 2019 Comparable EBITDA increased $333 million compared to same period in 2018. Principal variances included:
• Canadian Natural Gas Pipelines ‐ Declined primarily due to lower flow‐through income taxes on the NGTL System and the Canadian Mainline
as a result of accelerated tax depreciation enacted in June 2019, partially offset by increased depreciation due to higher approved rates and
higher incentive earnings for the Canadian Mainline
• U.S. Natural Gas Pipelines ‐ Higher due to Columbia growth projects placed in service and the positive impact of a stronger U.S. dollar
• Liquids Pipelines ‐ Higher mainly due to greater volumes on the Keystone Pipeline System and increased earnings from liquids marketing
activities along with the positive impact of a stronger U.S. dollar
• Power and Storage – Higher primarily due to an increase in the realized power price at Bruce Power, partially offset by lower volumes
resulting from higher outage days at Bruce and the sale of Cartier Wind and the Coolidge generating facility
(1) For more information see the July 31, 2019 Quarterly Report to Shareholders; (2) Non-GAAP measure and excludes specific items. See the forward looking information and non-GAAP measures slide at the front of this presentation for more information. 14Other income statement items(1)
(millions of dollars)
Three months Six months
ended June 30 ended June 30
2019 2018 2019 2018
Comparable EBITDA(2) 2,324 1,991 4,707 4,054
Depreciation and amortization (621) (570) (1,229) (1,105)
Comparable EBIT(2) 1,703 1,421 3,478 2,949
Interest expense (588) (558) (1,174) (1,085)
Allowance for funds used during construction 99 113 238 218
Interest income and other (3) 7 55 36 118
Income tax expense(3) (199) (146) (427) (317)
Net income attributable to non‐controlling interests (57) (76) (158) (170)
Preferred share dividends (41) (41) (82) (81)
Comparable Earnings (2) 924 768 1,911 1,632
Principal variances between second quarter 2019 and the same period in 2018 included:
• Depreciation and amortization ‐ Increased depreciation rates approved in the Canadian Mainline 2018 NEB Decision (which amounts are fully recovered as
reflected in the increase in EBITDA) and higher depreciation related to new projects placed into service
• Interest expense ‐ Higher due to increased levels of short‐term borrowings, long‐term debt issuances net of maturities, and a stronger U.S. dollar
• AFUDC ‐ Lower due to Columbia Gas and Columbia Gulf growth projects placed in service, partially offset by investment in the NGTL System and Mexico projects
• Interest income and other(3) ‐ Lower due to realized losses in 2019 on derivatives used to manage exposure to foreign exchange rate fluctuations on U.S. dollar‐
denominated income
• Income tax expense(3) ‐ Higher due to increased comparable earnings before income taxes and lower foreign tax rate differentials, partially offset by lower
flow‐through taxes in Canadian regulated natural gas pipelines
• Net income attributable to non‐controlling interests – Lower due to decreased earnings in TC PipeLines, LP, partially offset by a stronger U.S. dollar
(1) For more information see the July 31, 2019 Quarterly Report to Shareholders; (2) Non-GAAP measures and excludes specific items. See the forward looking information and non-GAAP measures slide at the front of this presentation for more
information; (3) Excludes specific items to arrive at comparable earnings. 15Comparable distributable cash flow
(millions of dollars, except per share amounts)
Three months Six months
ended June 30 ended June 30
2019 2018 2019 2018
Comparable Funds Generated From Operations(1) 1,667 1,459 3,490 3,070
Dividends on preferred shares (40) (39) (80) (78)
Distributions paid to non‐controlling interests (58) (48) (114) (117)
Non‐recoverable maintenance capital expenditures(2) (51) (66) (123) (130)
Comparable Distributable Cash Flow(1) 1,518 1,306 3,173 2,745
Comparable Distributable Cash Flow Per Common Share(1) $1.64 $1.46 $3.43 $3.08
Dividends Declared per Common Share $0.75 $0.69 $1.50 $1.38
Coverage Ratio 2.2x 2.1x 2.3x 2.2x
(1) Non-GAAP measure. See the forward looking information and non-GAAP measures slide at the front of this presentation for more information.
(2) Includes non-recoverable maintenance capital expenditures from all segments including cash contributions to fund our proportionate share of maintenance capital expenditures for our equity investments which are primarily related to Bruce Power. 16Funding program continued to advance in second quarter 2019
Strong, predictable and growing cash flow from operations
• Comparable funds generated from operations of $1.7 billion in the quarter
Access to capital markets on compelling terms
• Issued $1.0 billion of 30‐year medium‐term notes at a fixed rate of 4.34 per cent
Aggregate proceeds from portfolio management of $6.3 billion
• Closed sale of Coolidge Generating Station for US$448 million ($585 million Canadian) in May 2019
• Closed the partial monetization of Northern Courier in July 2019 for total gross proceeds of $1.15 billion
• US$1.3 billion ($1.7 billion Canadian) sale of Columbia Midstream assets expected to close in third quarter 2019
• $2.9 billion sale of Ontario thermal assets expected to be completed in late‐2019
Significant ongoing DRP participation supports simultaneous large capital program and de‐leveraging
• Approximately 34 per cent or $238 million of common dividends reinvested in common shares in quarter
• DRP will remain a quarter‐to‐quarter decision subject to timing of assets entering service and portfolio management
Significant portfolio management addresses sizeable portion of funding needs
while minimizing share count growth
17Funding program outlook 2019‐2021
$Billions
Numerous levers available to fund
Secured Capital Program
• Strong, predictable and growing cash
flow from operations
• Access to capital markets including:
• Senior debt
• Hybrid securities and preferred
shares
• Portfolio management
• Dividend Reinvestment Plan, if and as
required
Remaining funding requirement excludes
refinancing of scheduled debt maturities
On track to achieve targeted credit metrics
Moving back to historical self‐funding model
Assumes 25% ownership interest in Coastal GasLink, reflecting expected TC Energy equity cash contribution, accounting treatment may differ from this outlook. 18Debt maturity profile 2019‐2021
Debt maturities in home currency
Total debt maturities of ~$7.2* billion
$Billions
Canadian equivalent over the three year
3 timeframe
• Retired $113 million Canadian and
$1.15 billion U.S. to date in 2019
2
Remaining refinancing requirement of
~$5.6* billion through 2021
1
0
2019 2020 2021
$US $CAD
Very manageable level of scheduled debt maturities through 2021
* Assumes foreign exchange rate of 1.31. 19Delivering long‐term shareholder value
Track Visible Attractive, growing Strong
record growth dividend financial position
14% average annual $32 billion secured Dividend raised 8.7% Numerous levers
total shareholder to 2023 in February 2019 available to fund
return since 2000 4.6% yield future growth
Advancing over
$20 billion of 8‐10% expected CAGR Simple,
through 2021 understandable
additional projects in corporate structure
development
Proven resilience through all points of the business cycle 20Question & answer period
21Second quarter 2019 conference call August 1, 2019
Appendix – Reconciliation of non‐GAAP measures
       (millions of dollars)
                                                                                                                                            Three months                 Six months
                                                                                                                                            ended June 30               ended June 30
                                                                                                                                             2019      2018              2019      2018

                                        Comparable EBITDA(1)                                                                                 2,324             1,991     4,707     4,054
                                         Depreciation and amortization                                                                        (621)             (570)   (1,229)   (1,105)
                                         Interest expense                                                                                     (588)             (558)   (1,174)   (1,085)
                                         Allowance for funds used during construction                                                           99               113       238       218
                                         Interest income and other included in comparable earnings                                               7                55        36       118
                                         Income tax expense included in comparable earnings                                                   (199)             (146)     (427)     (317)
                                         Net income attributable to non‐controlling interests                                                  (57)              (76)     (158)     (170)
                                         Preferred share dividends                                                                             (41)              (41)      (82)      (81)
                                        Comparable Earnings(1)                                                                                 924               768     1,911     1,632
                                        Specific items (net of tax):
                                         Gain on sale of Coolidge generating station                                                            54                ‐        54         ‐
                                         Alberta corporate income tax rate reduction                                                            32                ‐        32         ‐
                                         U.S. Northeast power marketing contracts                                                                6              (11)       (6)       (5)
                                         Risk management activities                                                                            109               28       138      (108)
                                        Net Income Attributable to Common Shares                                                             1,125              785     2,129     1,519

(1) Comparable EBITDA and Comparable earnings are non-GAAP measures. See the non-GAAP measures slide at the front of this presentation for more information.
Appendix – Reconciliation of non‐GAAP measures continued
(millions of dollars)
Three months Six months
ended June 30 ended June 30
2019 2018 2019 2018
Net Cash Provided by Operations 1,722 1,805 3,671 3,217
Decrease in operating working capital (47) (361) (189) (154)
Funds Generated from Operations(1) 1,675 1,444 3,482 3,063
Specific items:
U.S. Northeast power marketing contracts (8) 15 8 7
Comparable Funds Generated from Operations(1) 1,667 1,459 3,490 3,070
(1) Funds generated from operations and comparable funds generated from operations are non-GAAP measures. See the non-GAAP measures slide at the front of this presentation for more information.You can also read