The economic cost of cardiovascular disease from 2014-2020 in six European economies - Research paper prepared for AstraZeneca August 2014
←
→
Page content transcription
If your browser does not render page correctly, please read the page content below
The economic cost of cardiovascular
disease from 2014-2020 in six
European economies
Research paper prepared for AstraZeneca
August 2014
2

Disclaimer
Whilst every effort has been made to ensure the accuracy of the material in this document, neither Centre for Economics and
Business Research Ltd nor the report’s authors will be liable for any loss or damages incurred through the use of the report.
Authorship and acknowledgements
This report has been produced by Cebr, an independent economics and business research consultancy established in 1992. The
report was primarily researched and authored by Cebr Economist Sandra Bernick with the study led by Cebr Director Charles
Davis. The views expressed herein are those of the authors only and are based upon independent research by them.
The report does not necessarily reflect the views of AstraZeneca.
                                                                                                          London, August 2014

© Centre for Economics and Business Research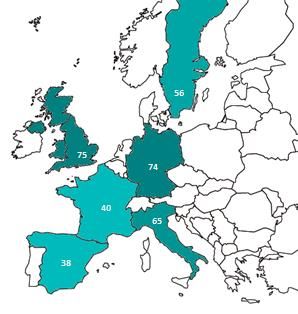
3

Contents
         1. Key facts                                                                4

         2. Introduction                                                             4

         3. Direct and indirect costs of CVD 2014 to 2020 across the six countries   5

         Appendix I – Methodology                                                    10

         Appendix II - WHO Definition of CVD                                         13

© Centre for Economics and Business Research
4
1. Key facts
Across six European economies (France, Germany, Italy, Spain, Sweden and the UK):
Total costs to the economies from cardiovascular disease (CVD) are estimated at €102.1 billion in
2014 - this is roughly equal to the size of the gross domestic product (GDP) of a mid-sized European
economy such as Hungary.
Direct healthcare costs attributable to CVD total €81.1 billion in 2014, they present the largest cost
at 70-80% across all six economies.
Indirect costs from premature mortality are estimated to be €19.6 billion and indirect costs from
morbidity are responsible for the smallest cost, accounting for €1.4 billion.
Mortality from CVD will rise from 1,118,457 today to 1,215,088 in 2020.
Costs from CVD in the six study countries are projected to increase to €122.6 billion by the end of
the decade, this is an increase of €20.5 billion over six years.
About cardiovascular disease (CVD)
CVD covers a range of diseases related to the circulatory system, including ischemic heart disease
(known as IHD or heart attack) and cerebrovascular disease (stroke). The diseases can appear
suddenly and unexpectedly or take the form of a long-term condition. Cardiovascular disease
conditions affect people of all ages. However, the likelihood of cardiovascular disease increases
significantly with age meaning that men above the age of 45 and women above 55 are those mainly
affected.
2. Introduction
This research paper analyses the economic burden from CVD1 in six countries: France, Germany, Italy,
Spain, Sweden and the UK. These six countries account for 74% of the European Union’s GDP and 64% of
its population.2 The study estimates the size of the economic burden resulting from CVD in these
countries from 2014 until the end of the decade.
Today CVD is the leading cause of death in Europe; presently 47% of all deaths in Europe and 40% of all
deaths in the European Union (EU) are attributable to CVD3. This means that across Europe as a whole 4
million deaths per year currently occur due to CVD4, of which 1.9 million are in the European Union.
Among the six European countries analysed in this study, it is estimated that a total of 1.1 million deaths
from CVD will occur in 2014. This is expected to rise to 1.2 million in 2020. While these figures make clear
1
This report follows the International Statistical Classification of Diseases and Related Health Problems 10th Revision (ICF X)
definition of cardiovascular disease throughout. The full list of diseases included under this definition is included in Appendix II.
2
Calculation based on Eurostat’s most recent data (2013).
3
These figures are drawn from the European Society for Cardiology’s ‘2012 European Cardiovascular Disease’, accessible here:
http://www.escardio.org/about/what/advocacy/EuroHeart/Pages/2012-CVD-statistics.aspx
4
Ibid.
© Centre for Economics and Business Research5
the profound human impact of CVD, which should not be underestimated, the focus of this report is on
the associated economic impact.
The way the burden of CVD affects the economy can be thought of through three main channels:
Direct costs imposed on the healthcare system as a result of CVD: Healthcare costs include any
expenditure related to CVD, including on primary, hospital outpatient, accident and emergency (A&E)
and hospital in-patient care, as well as on pharmaceuticals.
Indirect costs from premature mortality relating to CVD: Mortality measures the number of deaths
in a given population. The costs from premature mortality therefore measure the productivity loss
due to CVD causing premature deaths.
Indirect costs from premature morbidity caused by CVD: Morbidity refers to the prevalence of a
disease, in this case CVD, in a given population. Morbidity can result in losses of productivity where
the prevalence of the disease results in work days lost from absences from work and disability.
3. Direct and indirect costs of CVD 2014 to 2020 across the six countries
The burden of disease from CVD translates into an estimated total economic cost of €102.1 billion
among the six study countries in 2014 and is forecast to continuously rise to reach €122.6 billion by 2020.
The total cost of CVD in 2014 consists of €81.1 billion in healthcare costs, productivity losses from
premature mortality of €19.6 billion and €1.4 billion from morbidity. By 2020 healthcare costs
attributable to CVD will have risen to €98.7 billion and the indirect costs from premature mortality and
morbidity to €22.3 billion and €1.6 billion, respectively.
Healthcare costs expected to increase significantly
Healthcare spending on CVD is a significant cost within the six economies at a combined €81.1 billion in
2014. The leading cost items are fairly similar across countries with the largest being expenditure on in-
patient care, followed by pharmaceuticals. In-patient care accounts for around 50% of CVD-related
healthcare expenditure in most economies.
At between 6-11% of their respective total healthcare spending this is also a significant cost to the
individual countries. However, a variation in the size of the burden exists with healthcare costs per capita,
ranging from €384 in Sweden to €124 in Spain. Healthcare costs from CVD are projected to increase
further across all economies until the end of the decade.
© Centre for Economics and Business Research6
Figure 1: Healthcare cost of CVD per capita (in current prices), 2014 and 2020, in €
Source: Cebr analysis
The projected increase in healthcare costs is illustrated in Figure 2 which displays the total healthcare
costs from CVD for the period through to 2020. By the end of the decade, the six countries combined will
face CVD-related healthcare costs of €98.7 billion. Hence, there is a rise in per capita costs in each of the
individual countries. Sweden and Germany face a per capita cost of €455 and €417, respectively. Costs
will also rise in Italy (€297), the UK (€264) and France (€244). Still remaining the lowest, Spain’s per
capita expenditure is also forecast to increase to €180.
Figure 2: Healthcare cost of CVD, forecasts 2014-2020, in €billion
40
in €billion
33.8 2014
35 30.6
30 2015
25 2016
18.2 17.3
20 16.1
12.9 14.0 14.0 2017
15
8.8 2018
10 5.9
3.7 4.5
5 2019
- 2020
France Germany Italy Spain Sweden UK
Source: Cebr analysis
Costs from premature mortality to rise as working age deaths increase to close to 100,000
In the six countries that form the focus of this study CVD results in 1.1 million deaths per year. By 2020
this number will already have risen to 1.2 million. Significantly, deaths among those of working age are
also projected to rise, from 93,584 in 2014 to 99,743 in 2020. This has important implications for the
costs resulting from CVD; the more deaths that occur during working age, the higher the cost burden
from economic output losses – i.e. the productivity loss (details of the approach used are outlined in
Appendix I – Methodology).
© Centre for Economics and Business Research7
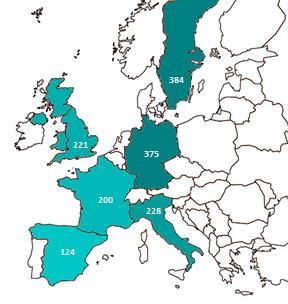
Table 1: Projected absolute number of deaths and workforce deaths from CVD over 2014-2020 period
Total number of deaths from CVD Total number of working-age deaths from CVD
Country 2014 2020 2014-20 2014 2020 2014-2020
France 156,551 176,911 1,169,214 14,030 14,122 98,392
Germany 363,417 389,979 2,631,313 30,703 32,754 222,869
Italy 236,719 252,065 1,712,977 14,518 15,677 105,316
Spain 128,169 141,584 942,943 11,359 12,911 84,769
Sweden 39,362 43,034 289,192 2,385 2,436 16,760
United Kingdom 194,239 211,515 1,422,968 20,589 21,843 147,930
Source: WHO Office for Europe mortality data, UN-DESA for population data; Cebr analysis
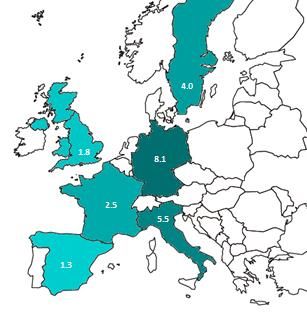
The costs from productivity losses as a result of premature mortality are estimated to stand at €19.6
billion in the six economies in 2014. Per capita cost estimates for costs from premature mortality at
current levels are presented in Figure 3 below to allow comparison between the individual countries;
they range from between €75 per head in the UK to €38 per person in Spain.
Figure 3: Cost from premature mortality per capita in 2014 and 2020, in €
Source: Cebr analysis
By 2020 mortality costs in the six economies are forecast to rise to €22.3 billion in 2020, an increase of
€2.7 billion over a relatively short time period; details by country are shown in Figure 4 below. This
increase is caused by the significant increase in mortality expected among the working age population.
© Centre for Economics and Business Research8
Figure 4: Mortality costs attributable to CVD, forecasts 2014-2020, in €billion
8
6.9
in €billion
7 2014
6.0 5.7
6 2015
4.8
5 4.4 2016
4.0
4
2.6 2.6 2017
3
1.7 2.0
2 2018
0.5 0.7 2019
1
0 2020
France Germany Italy Spain Sweden UK
Source: Cebr analysis
Costs from premature morbidity highest in Germany but biggest increase expected in Italy
CVD also increases morbidity within the workforce leading to quantifiable productivity losses from
absences from work or disability. In 2014, a combined cost of €1.4 billion from CVD-related morbidity is
expected in the six economies. However, the costs vary considerably between the countries, ranging
from €8.1 per capita in Germany to €1.3 per capita in Spain.
Figure 5: Per capita morbidity costs in 2014 and 2020, in €
Source: Cebr analysis
Future estimates for the costs resulting from morbidity were also assessed5; they show that by 2020
costs of morbidity attributable to CVD increase to €1.6 billion, from €1.4 billion in 2014. The results
presented in Figure 6 show that the costs from morbidity increase across all the six study countries.
However, they increase more steeply in some places, notably Italy, than in others such as Spain or
Sweden.
5
However, it has to be noted that the modelling had to rely more on proxies here than for the rest of the report. Whilst this is
common in the existing research (due to a lack of suitable data being available), the consequence is that the results are likely to
somewhat underestimate the real costs (the approach used is detailed in Appendix I- Methodology).
© Centre for Economics and Business Research9
Figure 6: Morbidity costs attributable to CVD, forecasts 2014-2020, in €million
800 726
in € million
700 659 2014
600 2015
500 440
2016
400 337
2017
300
201 2018
200 161 146
92 118
100 61 39 48 2019
- 2020
France Germany Italy Spain Sweden UK
Source: Cebr analysis
Total costs to reach more than €122 billion by end of decade
Overall, total costs are dominated by healthcare costs, accounting for between three quarters and four
fifths of the total cost in each of the countries. This mix of costs is common for advanced economies as
they are often more able to allocate resources to healthcare.
Combining the three individual cost components, the total costs from CVD come to €102.1 billion in 2014
and are projected to rise to €122.6 billion by 2020, which is a substantial increase of 20%. These are
significant costs for each of the six countries (the costs by country are outlined in Figure 7 below),
representing between 0.7% and 1.4% of their GDP in 2014.
Figure 7: Total cost from cardiovascular disease, 2014, in €billion
37.4
in £billions
18.3 18.9
15.6
7.7
4.3
Sweden Spain France Italy UK Germany
1% 0.7% 0.8% 1.3% 1.4% 1.4%
Source: Cebr analysis
© Centre for Economics and Business Research10
Appendix I – Methodology
General approach
The direct cost of CVD is estimated by extracting the relevant country’s health care resource use that
goes towards the treatment of CVD conditions. The health care costs considered include expenditures on
primary, acute, in-hospital and outpatient care, and medication costs. Of particular relevance to the
analysis of the six study countries is the potential effect of CVD on the economy, given the importance of
CVD within the working age population. These are considered indirect costs, defined as losses that stem
from premature death and from disability. Indirect costs are quantified by estimating productivity lost
from mortality and morbidity (i.e. by estimating the output lost due to premature mortality from CVD,
including productivity lost from mortality), absence from work and premature exit from the workforce
stemming from CVD morbidity, including productivity lost from morbidity.
Figure 8: Quantifying the economic cost of CVD
Total economic cost of cardiovascular disease
Direct cost
Indirect cost
Cost-of-illness
Value of output approach
approach
Productivity lost from
Productivity lost from morbidity
Health care costs mortality
Morbidity costs represent
This includes primary, Mortality costs represent the value of foregone
acute, hospital in- and the value of foregone earnings from lost
outpatient care and earnings from premature productivity including (i)
medication costs deaths caused by CVD workloss of currently
employed individuals and
(ii) sickness
1. Current costs
Direct costs: health care
To quantify the direct health care costs we use a bottom up approach that collects information on
several components of the health care cost – primary care, hospital outpatient care, A&E care, hospital
inpatient care and pharmaceutical expenditure. The different components of the direct costs from
cardiovascular disease are calculated by collecting information from National Statistical Services, the
OECD, Eurostat and academic studies.
As the costs are calculated for 2014, the data in most cases came from earlier years. The figures were
therefore adjusted by the respective countries’ inflation indices using the health care sub-component of
the index, which was available from Eurostat.
© Centre for Economics and Business Research11
Indirect cost: productivity foregone due to premature mortality
To calculate the cost from productivity foregone due to premature death mortality statistics from the
World Health Organisation Office for Europe were used. These data were available by gender and age
bands. For each of the individual gender and age band combinations the average years of life lost and
years of working life lost were computed. To this economic activity rates are then applied to narrow
down to the actual working population. Average earnings over the remaining working life span,
discounted appropriately, are then applied. Box 1 below illustrates procedure by use of an example.
Box 1: Illustrative example of PYLL and PYWLL calculations
1. Calculating years of life lost
Potential years of life lost’ (PYLL) is an indicator of premature death. It attempts to measure the number of
years of life lost per year due to death as a result of a specific cause, in our case cardiovascular disease. If an
individual dies before the life expectancy they have potentially lost years of life.
expected years of life - years of life at death = years of life lost
For example, if one assumes that an average expected age of death for a population is 75 years, then if a person
dies at 45 they have lost a potential 30 years (that is, their individual PYLL is 30 years).
i.e.: 75 – 45 = 35
2. Calculating years of working life lost
Potential years of working life lost are calculated in a similar fashion. For example, if one assumes that an
average pension age for a population is 65 years, then if a person dies at 45 this equals a potential 20 years of
working life lost (that is, their individual PYWLL is 20 years).
expected years of working life – years of life at death= years of working life lost
i.e.: 65- 45 =20
Indirect cost: productivity foregone due to premature morbidity
A second part of examining the productivity lost from cardiovascular disease is to estimate Disability
Adjusted Life Years (DALY) lost. This measure includes the impact of disability (e.g. inability to work,
prolonged illness). Similar to previous studies on the cost from cardiovascular disease it has not been
possible to produce these figures for the six study countries because morbidity data for the group of
countries were not available.
Therefore an alternative approach used in existing research is adopted, which uses a proxy for workforce
morbidity. Studies of CVD in the workforce of industrial nations have regularly found that disability
associated with hypertension and heart disease results in a large number of impaired workdays. To
quantify the costs from morbidity induced by cardiovascular disease, absences from work were collected
from national statistics where possible and where this was not possible hospital days were used as a
© Centre for Economics and Business Research12
proxy. Expressing these as the total number of days lost, productivity lost was quantified by multiplying
by average daily wage. In the absence of better data on morbidity this is a common approach employed
in the academic literature.
2. Projections
Future health care costs
Future health care costs are forecasted by creating a disease profile in the population using hospital
admission statistics6. The historic data on hospital admission statistics are overlaid with the expected
future population structure. This allows us to estimate the size of the economic burden between 2014
and 2020 taking into consideration the effect of ageing populations.
Future indirect costs: productivity foregone from premature mortality
The cost from premature mortality in the future is also projected. As a first step in estimating the cost
from premature mortality, mortality from CVD is forecast from 2014-2020. For this estimates of
population mortality by gender and age band from the WHO Office for Europe mortality database are
used. These are combined with population forecast provided by the UN and on this basis forecast for the
years 2014-2020.
Using the mortality forecasts, the cost to the economy from premature mortality is estimated. The future
costs can be quantified by valuing the labour of those dying prematurely at their annual salary,
calculating their life time earnings left and discounting these appropriately. Annual salaries are projected
into the future using forecasts of average earnings growth.
Future indirect cost: productivity foregone from morbidity
Forecasts for the second component of the indirect costs from cardiovascular disease have also been
undertaken. However, it has to be noted that, as with the current indirect cost: productivity foregone
from morbidity, the modelling had to rely more on proxies here than for the rest of the report. Whilst
this is common in the existing research, due to a lack of suitable data being available, as consequence the
results are likely to somewhat underestimate the real costs.
Using historic data on hospital admission statistics available from Eurostat as a proxy for prevalence rates,
these are overlaid with the expected future population structure which allows estimation of the
population affected by cardiovascular disease between 2014 and 2020. The morbidity costs are then
quantified in the same manner as for the current costs.
6
In the absence of better data on prevalence and incidence rates hospital admission statistics are often employed as a proxy.
© Centre for Economics and Business Research13
Appendix II - WHO Definition of CVD
WHO Classification of cardiovascular disease
I00 - Rheumatic fever without mention of heart involvement
(I00–I02)
Acute rheumatic fever I01 -Rheumatic fever with heart involvement
I02 - Rheumatic chorea
I05 - Rheumatic mitral valve diseases
(I05–I09) I06 - Rheumatic aortic valve diseases
Chronic rheumatic I07 - Rheumatic tricuspid valve diseases
heart diseases I08 - Multiple valve diseases
I09 - Other rheumatic heart diseases
I10 - Essential (primary) hypertension
(I10–I15) I 11- Hypertensive heart disease
Hypertensive I12 - Hypertensive renal disease
diseases I13 - Hypertensive heart disease and Hypertensive renal disease
I15 - Renovascular hypertension
I20 - Angina pectoris
I21 - Acute myocardial infarction
(I20–I25) I22 - Subsequent myocardial infarction
Ischemic heart
diseases I23 - Certain current complications following acute myocardial infarction
I24 - Other acute ischaemic heart diseases
I00–I99 – Diseases
I25 - Chronic ischaemic heart disease
of the circulatory
system (I26–I28) I26 - Pulmonary embolism
Pulmonary heart
I27 -Other pulmonary heart diseases
disease and diseases
of pulmonary I28 -Other diseases of pulmonary vessels
circulation
I30 - Acute pericarditis
I31 - Other diseases of pericardium
I32 - Pericarditis in diseases classified elsewhere
I33 - Acute and sub acute endocarditis
I34 - Nonrheumatic mitral valve disorders
I35 - Nonrheumatic aortic valve disorders
(I30–I52) I36 -Nonrheumatic tricuspid valve disorders
Other forms of heart I37 - Pulmonary valve disorders
disease
I38 - Endocarditis, valve unspecified
I39 - Endocarditis and heart valve disorders in diseases classified
elsewhere
I40 - Acute myocarditis
I41 - Myocarditis in diseases classified elsewhere
I42 - Cardiomyopathy
I43 - Cardiomyopathy in diseases classified elsewhere
© Centre for Economics and Business Research14
I50 - Heart failure
I51 - Complications and ill-defined descriptions of heart disease
I52 - Other heart disorders in diseases classified elsewhere
I60 - Subarachnoid haemorrhage
I61 - Intracerebral haemorrhage
I62 - Other non-traumatic intracranial haemorrhage
I63 - Cerebral infarction
I64 - Stroke, not specified as haemorrhage or infarction
(I60–I69)
Cerebrovascular I65 - Occlusion and stenosis of pre-cerebral arteries, not resulting in
diseases cerebral infarction
I66- Occlusion and stenosis of cerebral arteries, not resulting in cerebral
infarction
I67 - Other cerebrovascular diseases
I68 - Cerebrovascular disorders in diseases classified elsewhere
I69 - Sequelae of cerebrovascular disease
I70 - Atherosclerosis
I71 - Aortic aneurysm and dissection
I72 - Other aneurysm
(I70–I79)
I73 - Other peripheral vascular diseases
Diseases of arteries,
arterioles and I74 - Arterial embolism and thrombosis
capillaries I77 - Arterial embolism and thrombosis
I78 -Diseases of capillaries
I79 - Disorders of arteries, arterioles and capillaries in diseases classified
elsewhere
I80 - Phlebitis and thrombophlebitis
I81 - Portal vein thrombosis
I82 - Other venous embolism and venous thrombosis
(I80–I89) I83 - Varicose veins of lower extremities
Diseases of veins,
I84 - Haemorrhoids
lymphatic vessels and
lymph nodes, not I85 - Oesophageal varices
elsewhere classified I86 - Varicose veins of other sites
I87 - Other disorders of veins
I88 - Nonspecific lymphadenitis
I89 - Other non-infective disorders of lymphatic vessels and lymph nodes
I95 - Hypotension
(I95–I99) I97 - Post procedural disorders of circulatory system, not elsewhere
Other and unspecified classified
disorders of the I98 - Other disorders of circulatory system in diseases classified
circulatory system elsewhere
I99 - Other and unspecified disorders of circulatory system
© Centre for Economics and Business ResearchYou can also read