The potential benefits and harms of cancer screening: perspectives from the US Preventive Services Task Force Mark H. Ebell MD, MS
←
→
Page content transcription
If your browser does not render page correctly, please read the page content below
RCSI Royal College of Surgeons in Ireland Coláiste Ríoga na Máinleá in Éirinn

The potential benefits and harms of cancer
  screening: perspectives from the US
     Preventive Services Task Force

           Mark H. Ebell MD, MS
        Professor, University of Georgia,
             Athens, Georgia, USA
 2019 Fulbright Scholar at the HRB Primary Care
    Research Centre, RCSI, Dublin 2, Ireland
BIOSKETCH

• Family physician (GP) and Professor,
  University of Georgia (“UGA”), Athens, GA,
  USA
• Member US Preventive Services Task
  Force, 2012-2015
• Fulbright Scholar at HRB Centre for
  Primary Care Research, RCSI, 2019
• Editor-in-Chief, Essential Evidence Plus
• Research interests: clinical decision-making
  and decision support, meta-analysis,
  clinical prediction rules, cancer screening    UGA X and Hairy Dawg

TODAY’S GOALS

• Comparing cancer screening in
  Ireland and the US
• A brief overview of how USPSTF
  recommendations are created
• Potential benefits and harms of
  cancer screening
• The importance of “overdiagnosis”
  and how to mitigate it

                                      Lake Michigan, 2018
“All screening programs do harm…
some do good as well.”

                 - Sir Muir Gray
CANCER SCREENING: INTERNATIONAL COMPARISONS
THE US AND IRISH HEALTH SYSTEMS COMPARED

                                           United States

              Ireland: 81 years, $4600/person

              US: 78 years, $7800/person
SCREENING PROGRAMMES IN IRELAND AND US
Screening Ireland US
Program
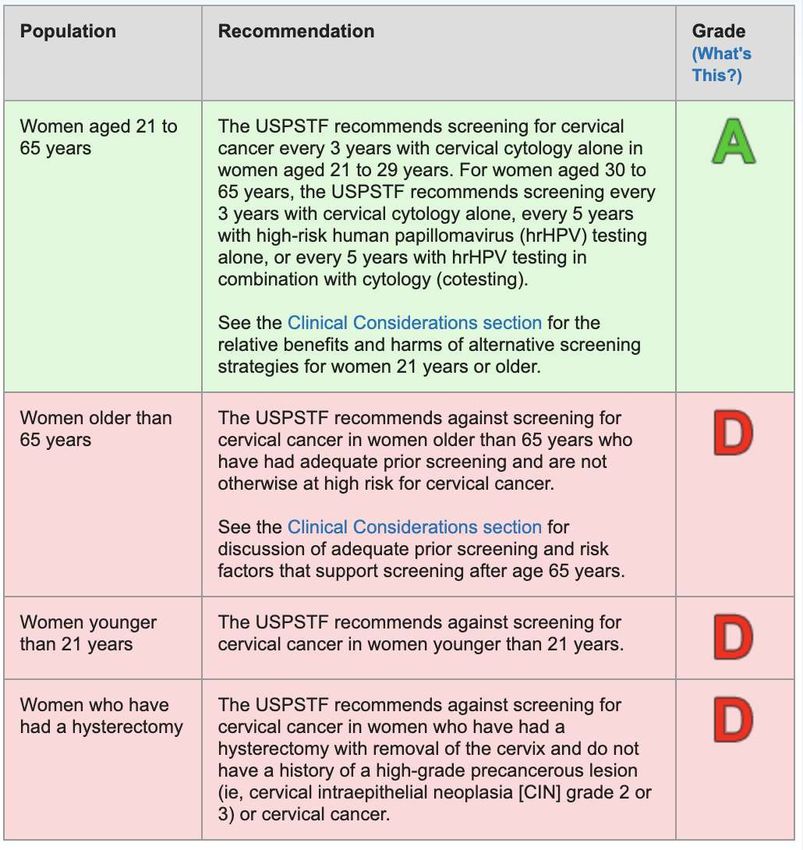
Breast cancer 50 - 69: mammography q 2 yrs 40 - 49: shared decision making
50 - 75: mammography q 2 yrs
Cervical cancer 25 - 44: cytology q 3 yrs 21 - 29: cytology q 3 yrs
45 to 60: cytology q 5 yrs 30 - 65: cytology + HPV or HPV
Reflex HPV testing if abnormal alone q 5 yrs
Bowel cancer 60 - 69: stool based FIT q 2 yrs 50 - 75: any of 7 strategies, most
opt for colonoscopy q 10 yrs
Prostate cancer No national program 55 - 69: shared decision making
Lung cancer No national program 50 - 80: annual low dose CT if 30+
pack years smoking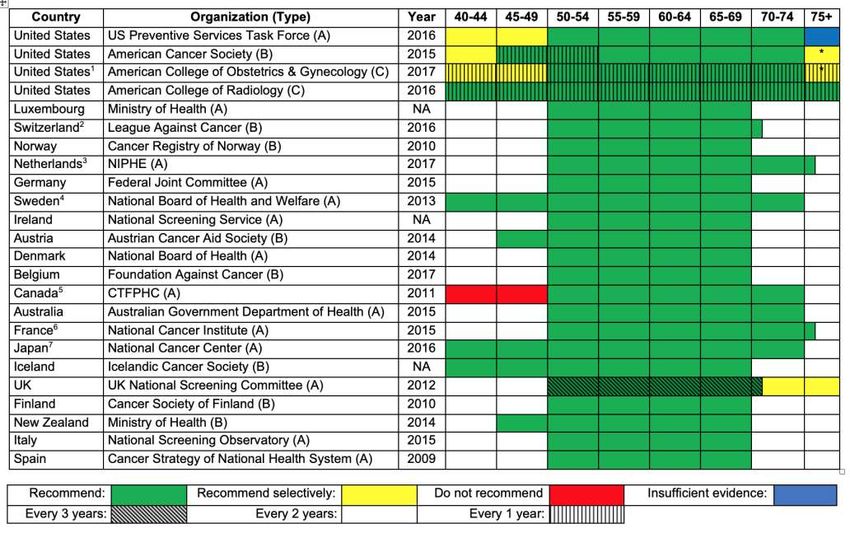
COMPARISON WITH OTHER DEVELOPED ECONOMIES: BREAST
                                                    US

                                                    Ireland

                                        Source: Ebell, et al. Public
                                        Health Rev. 2018 Mar
                                        2;39:7. doi: 10.1186/
                                        s40985-018-0080-0.
KEY DIFFERENCES BETWEEN US AND IRELAND

   Topic                  United States                           Ireland
General      Opportunistic, often not adherent to     Centrally organized, good
             guidelines, overscreening common         adherence, little overscreening
General      11% of women 18-65 have no insurance     Free
General      More aggressive in terms of start and    Later start and/or earlier stop
             stop ages, interval
Colorectal   Colonoscopy every 10 years is dominant Fecal immunochemical test

Lung cancer Recommend low dose CT annually for        Do not recommend
            persons 55-80 with 30+ pack years
Prostate     Shared decision-making for prostate CA   Do not recommend
cancer       screening age 55 - 69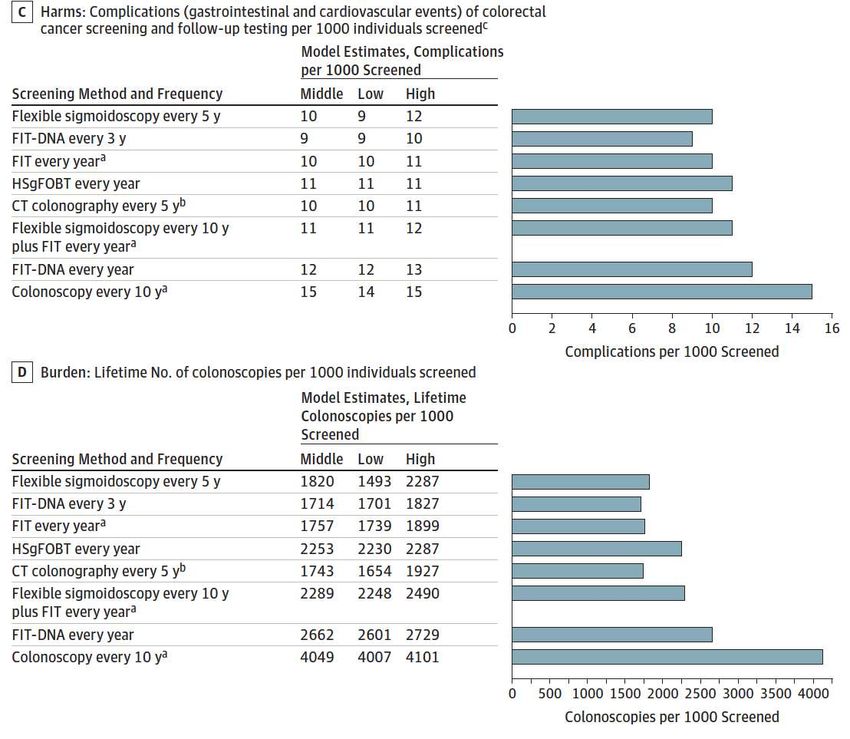
USPSTF AND ITS METHODS
          Me       Doug Owens, current chair

         Bill Phillips (Univ Wash)
THE US PREVENTIVE SERVICES TASK FORCE
• Established 1984 by US government Sample Topics:
and supported by HHS • Cancer screening
• Aspirin and statin use
• 16 primary care physicians (mostly) • Lifestyle recommendations
with expertise in screening, for prevention
prevention, evidence based practice, • Behavioral health
guideline development screening and counseling
• Members have no financial conflict of • Cardiovascular screening
and prevention
interest
• Obstetrical care
• Make recommendations regarding • Infectious disease
screening and primary prevention screening and prevention
• 70+ topics reviewed every 5-7 yearsSample Analytic Framework: Lung Cancer Screening Step 1: Analytic framework key questions Direct evidence pathway Step 2: Systematic Indirect evidence pathway reviews answer each key question Step 3: Subgroup of Task Force develops draft recommendation(s) Step 4: Task Force debate, then public comment period Step 5: Final recommendation(s) published and disseminated
GRADE IS ASSIGNED TO EACH RECOMMENDATION

        Degree of            Net Benefit          Suggestion
        Certainty       (benefit minus harm)     for Practice
A   High certainty     Substantial           Offer or provide
                                             service
B   Moderate to high Moderate to substantial Offer or provide
    certainty                                service
C   Moderate certainty Small or variable     Shared decision-
                                             making
D   Moderate to high None or net harm        Do not offer or
    certainty                                provide
I   Low certainty      Unknown               Variable
EXAMPLE: CERVICAL CANCER SCREENING From Affordable Care Act (“ObamaCare”): “…a health insurance issuer …shall provide coverage for and shall not impose any cost sharing requirements for evidence-based items or services that have a rating of A or B in the current recommendations of the USPSTF”.
WEIGHING POTENTIAL BENEFITS AND HARMS
POTENTIAL BENEFITS AND HARMS OF SCREENING
Key point: we are doing something to a perfectly healthy, happy person.
We have to be very certain that on average, the potential benefits clearly
outweigh the potential harms.
Potential benefits Potential harms
• Reduced disease-specific • Direct harm (e.g. pain, radiation)
mortality • Harm of downstream tests (e.g. biopsies)
• Reduced all-cause mortality • Worry (false positives “cancer scares”)
• Reduced morbidity (treatment • Cost
of early disease may have less
harm than treatment of late • Unintended behavior change (i.e. lung CA
disease) screening and smoking)
• Overdiagnosis (more on that later…)BOWEL SCREENING POTENTIAL BENEFITS: 221 TO 270 LIFE- YEARS GAINED, AND 20 TO 24 DEATHS AVERTED, PER 1000 PERSONS SCREENED. OR ~ 2 DEATHS PER 100 SCREENED AVERTED, ADDING 11 YEARS OF LIFE PER PERSON
Bowel Screening
Potential harms:

Range of 1.7 to 4.1
colonoscopies/person
and 0.9 – 1.5 serious
complication/100
persons screened

Most harms with
colonoscopy based
strategies
BALANCING BENEFITS AND HARMS: CERVICAL CANCER

                                                      ”Flat of the curve” medicine:
                                                      q3 rather than q5 year interval
                                                      increases burden and cost
Cancers averted per 1000 women

                                                      with no increase in benefit

                                                         Important point: more
                                                         screening is not always a
                                                         net good, with diminishing
                                                         returns and increasing
                                                         harms as it intensifies

                                                      Source: Kim JJ, et al. Evidence Syntheses, No. 158s.
                                                      Rockville, MD: Agency for Healthcare Research and
                                                      Quality (US); 2018 Aug.
HOW DO WE MEASURE BENEFIT? • Survival from time of diagnosis, i.e. 5 year survival? • All-cause mortality, i.e. Deaths/100,000/year? • Disease specific mortality, i.e. Cervical cancer deaths/100,000/year?
AN ILLUSORY BENEFIT:
   LONGER SURVIVAL FROM DIAGNOSIS
   • Screening almost always increases survival from the time of diagnosis
   • But that is due to earlier detection, and is not a benefit unless life is
     lengthened overall and mortality reduced        Longer survival from time of diagnosis
                                                         with screening, but same length of life
                                                           15 year survival from diagnosis

     Birth                                                 Cancer detected by            Death at
                                                           screening age 65              age 80
                                                                   10 year survival from dx

     Birth                                                           Cancer detected     Death at
                                                                     due to symptoms     age 80
                                                                     age 70

Lesson: measure benefit of a screening program using mortality reduction, not
increase in survival from diagnosis (i.e. 5 year survival) or shift to earlier stage
SHOULD WE INSIST THAT SCREENING PROGRAMS
REDUCE ALL-CAUSE MORTALITY?
• If 10 year all-cause mortality for a population
of 65 year old women is 15%, but breast
cancer mortality is only 1.5%, then the ratio of
all cause to disease specific mortality is 10
• From our graph, one would need about 8
times as large a study to prove lower all-cause
mortality, compared to what you would need
to prove lower breast cancer specific mortality
• Larger relative risk reduction with disease-
specific mortality is easier to prove
Dobbin K, Ebell M. Should we expect all-cause mortality
reductions in large screening studies? Br J Gen Pract 2018SHOULD WE INSIST THAT SCREENING PROGRAMS
REDUCE ALL-CAUSE MORTALITY? In the absence of
such gigantic studies,
Screening Mortality Fewer deaths/ Confidence we should at least be
program reduction 100,000 screened interval sure the direction of
mortality is the same
Breast cancer Disease 47 (-14 to 108)
for all cause and
(AGE study) All-cause 92 (-110 to 294) disease specific.
Lung cancer Disease 312 (106 to 518)
(NLST study) All-cause 456 (18 to 896)
Disease 50 (-9 to 109) Ovarian CA mortality
Ovarian cancer
down, all-cause up
(UKCTOCS) All-cause -98 (-353 to 167) (worrisome)
Source: Dobbin K, Ebell M. Should we expect all-cause mortality
reductions in large screening studies? Br J Gen Pract 2018HOW DO WE MEASURE BENEFIT?
• Survival from time of diagnosis, i.e.
No!
5 year survival
• All-cause mortality, i.e. Ideal, often not possible,
deaths/100,000/year should at least be in
same direction
• Disease specific mortality, i.e.
Usually the best option
Cervical cancer deaths/100,000/yearA NEWLY RECOGNIZED HARM: OVERDIAGNOSIS
OVERDIAGNOSIS: AN IMPORTANT SOURCE OF HARM
Study of trauma victims in Detroit, 1996, showing rates of
small foci of prostate cancer by age and race:

      Age               African-            Caucasian
                       American
     20-29                8%                      8%
     30-39                 31%                   31%
     40-49                 43%                   37%
     50-59                 46%                   44%
     60-69                 70%                   65%
     70-79                 81%                   83%

    Source: Sakr WA, et al. Age and racial distribution of prostatic intraepithelial neoplasia.
    Eur Urol. 1996; 30(2):138-44.
Old thinking: precancerous lesion symptomatic cancer death
Only paths where
New thinking: several possible paths screening is beneficial
1. Cancer progresses very rapidly (melanoma, pancreatic) or may
metastasize early (ovarian)
2. Cancer progresses more slowly, and cancers detected by screening have
a more favorable outcomes than cancers detected later due to symptoms
(many breast, lung cancers)
3. Cancer progresses more slowly and would be amenable to better
outcomes with earlier treatment (like #2), but something else causes
death (lung cancer patient dies of other smoking complications)
4. Cancer progresses very slowly, is detected by screening, but would never
have caused symptoms (overdiagnosed prostate, lung, or breast cancer)
5. Precancerous lesion’s removal prevents cancer (cervical, colorectal)
6. Precancerous or early stage lesions regress without therapy (cervical,
neuroblastoma)DETECTING OVERDIAGNOSIS: EFFECTIVE PROGRAM
We begin a cancer
screening program in 1990.
We detect more cancer
than before (increased
incidence)
After a few years, mortality
due to that cancer begins to
decline.DETECTING OVERDIAGNOSIS: INEFFECTIVE PROGRAM
We begin a cancer
screening program in 1990.
We detect more cancer than
before (increased incidence)
However, mortality remains
unchangedSource: Kramer BS, Croswell JM. Cancer Screening: The clash of science and intuition. Annu. Rev. Med. 2009. 60:125–37
INCIDENCE AND MORTALITY

Example 1: mix of indolent and
aggressive cancer; increasing
incidence
Example 2: removal of pre-
cancerous lesions leading to
decreased incidence and mortality
Example 3: rampant overdiagnosis
with large increase in incidence
and no effect on mortality

Source: Esserman L, et al. Overdiagnosis and
Overtreatment in Cancer An Opportunity for
Improvement. JAMA 2013; 310(8):797-798
Overdiagnosis in Breast Cancer Screening?
Data from large US cancer registry (CDC)

Top graph: widespread mammography for
women in 40’s began in mid 1980’s

Bottom graph: Large jump in incidence of early
stage cancer: from 112 to 234 cases/100,000/year
(blue line)

But by now, we should have seen similar decline
in late stage cancer. But, we have not: late stage
only decreased from 102 to 94 cases/
100,000/year (red line)

 Source: Bleyer and Welch, N Engl J Med 2013;
 367: 1998
HOW MUCH OVERDIAGNOSIS?
• Rates of overdiagnosis for different screening
  programs
   – Breast cancer: 20% to 30%
   – Prostate cancer: 30% to 50%
   – Lung cancer: 20%
   – Colorectal and cervical cancer: ??
• Overdiagnosis is more common:
   – In older patients, who have more competing
     causes of mortality, and less time for cancer to
     progress and cause harm
   – With shorter intervals between tests, earlier start
     age, later stop age (more aggressive screening)
Source: Overdiagnosis in Prostate Cancer Screening Decision Models: A Contextual Review for the U.S.
Preventive Services Task Force. AHRQ Publication No. 17-05229-EF-3 April 2017
STRATEGIES TO REDUCE OVERDIAGNOSIS
1. Do not screen asymptomatic persons in the absence of RCT
evidence of reduced mortality and acceptable harms
2. Do not screen too often (i.e. annual mammogram) or too long
(i.e. 80 years old)
3. Re-name words like carcinoma and neoplasia to something less
scary:
– Ductal carcinoma in situ or high-grade prostatic intraepithelial
neoplasia or precursor pancreatic lesion IDLE (indolent
lesion of epithelial origin)
4. Develop better protocols and standards for evaluating
incidentalomas (i.e. TI-RADS for thyroid lesions)
5. Develop better biomarkers and prognostic models to separate
truly aggressive cancers from indolent cancersSTRATEGIES TO REDUCE OVERDIAGNOSIS 6. Consider active surveillance rather than immediate aggressive therapy – Standard of care for many prostate cancers, but variable uptake – Trials underway for active surveillance of DCIS, thyroid lesions Source: Haymart, et al. Active Surveillance for Low-Risk Cancers — A Viable Solution to Overtreatment? N Engl J Med 2017; 377:203-206
LESSONS LEARNED
• An evidence-based, transparent, public
  process free of conflict of interest helps
  create guidelines you can trust.
• Health systems should determine optimal
  screening strategies based on a balance of
  benefits, harms, and available resources
• Randomized trials measuring mortality
  provide the best evidence regarding the
  benefit of screening programs
• Overdiagnosis is an most important harm,
  but is poorly understand by physicians and
  patients
• Strategies (and more research) are needed
  to mitigate the harms of overdiagnosis
                                               Inisheer, October 2018
THANK YOU! QUESTIONS?
Inisheer, October 2018CANCER SCREENING PROGRAMMES IN IRELAND BreastCheck: mammography every 2 years for women 50 to 64 years, increasing to 69 by 2021 CervicalCheck: Pap smear every 3 years for women age 25 to 44, every 5 years age 45 to 60 years, with reflex to HPV testing if abnormal BowelScreen: men and women age 60 to 69 years with a fecal immunochemical test (FIT) done at home every two years Source: https://www.hse.ie/eng/services/list/5/cancer/patient/screen/screening.html
ADHERENCE TO CANCER SCREENING IN US VS IRELAND
                             Comparison of Overall Screening Rates
                                                                                Drivers for adherence:
                                                                                Financial incentives vs.
   Bowel cancer                                                                 Central organization

   Breast cancer

  Cervical cancer

                    0   10      20      30             40        50   60   70        80     90
                                             Ireland        US

Source: 2015/2016 Annual Reports of BreastCheck, CervicalCheck and BowelScreen Programs; CDC,
Patterns and Trends in Cancer Screening in the US, https://www.cdc.gov/pcd/issues/2018/17_0465.htm
US
Ireland
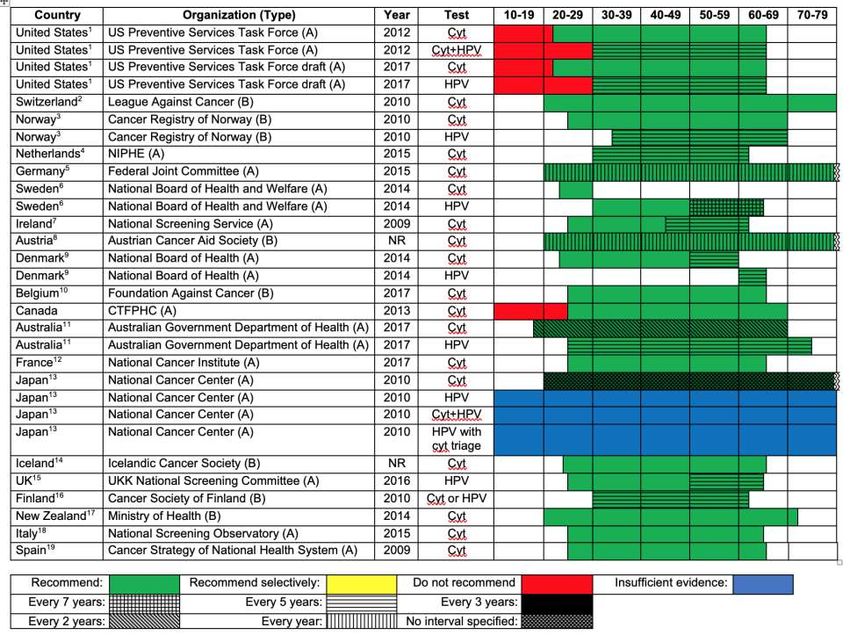
CERVICAL
SCREENING
PROGRAMMES
Source: Ebell, et al. Public Health
Rev. 2018 Mar 2;39:7. doi:
10.1186/s40985-018-0080-0.COMPARISON WITH OTHER DEVELOPED ECONOMIES: BOWEL
US
Ireland
Source: Ebell, et al. Public
Health Rev. 2018 Mar
2;39:7. doi: 10.1186/
s40985-018-0080-0.You can also read