4Q and FY 2020 Earnings Presentation - March 25, 2021 - GAN

Page created by Tom Guzman
 
CONTINUE READING
4Q and FY 2020 Earnings Presentation - March 25, 2021 - GAN
4Q and FY 2020
Earnings Presentation
March 25, 2021
4Q and FY 2020 Earnings Presentation - March 25, 2021 - GAN
Forward Looking Statement and Legal Disclaimer
This presentation has been prepared by GAN Limited (the “Company”) solely for informational purposes based on its own information, as well as information from public
sources. This presentation has been prepared to assist interested parties in making their own evaluation of the Company and does not propose to contain all of the information
that may be relevant. In all cases, interested parties should conduct their own investigation and analysis of the Company and the data set forth in the presentation and any other
information provided by or on behalf of the Company.

Except as otherwise indicated, this presentation speaks as of the date hereof. The delivery of this presentation shall not, under any circumstances, create any implication that
there has been no change in the affairs of the Company after the date hereof.

Certain of the information contained herein may be derived from information provided by industry sources. The Company believes that such information is accurate and that the
sources from which it has been obtained are reliable. The Company cannot guarantee the accuracy of such information and has not independently verified such information.

This presentation contains forward-looking statements within the meaning of the federal securities laws. These forward-looking statements reflect our current views with
respect to, among other things, future events and our financial performance. These statements are often, but not always, made through the use of words or phrases such as
“may,” “might,” “should,” “could,” “predict,” “potential,” “believe,” “expect,” “continue,” “will,” “anticipate,” “seek,” “estimate,” “intend,” “plan,” “strive,” “projection,” “goal,”
“target,” “outlook,” “aim,” “would,” and “annualized” or the negative version of those words or other comparable words or phrases of a future or forward-looking nature. These
forward-looking statements are not historical facts, and are based on current expectation, estimates and projections about our industry, management’s beliefs and certain
assumptions made by management, many of which, by their nature, are inherently uncertain and beyond our control. Accordingly, we caution you that any such forward-looking
statements are not guarantees of future performance and are subject to risks, assumptions, estimates and uncertainties that are difficult to predict. Although we believe that the
expectations reflected in these forward-looking statements are reasonable as of the date made, actual results may prove to be materially different from the results expressed or
implied by the forward-looking statements.

This presentation uses certain non-GAAP financial measures as defined in SEC rules. We report our financial results in conformity with generally accepted accounting principles in
the United States of America, or GAAP, and also communicate with investors using certain non-GAAP financial measures. These non-GAAP financial measures are not in
accordance with, nor are they a substitute for or superior to, the comparable GAAP financial measures. These non-GAAP financial measures are intended to supplement the
presentation of our financial results that are prepared in accordance with GAAP. Based upon feedback from investors and financial analysts, we believe that the supplemental
non-GAAP financial measures we provide are useful to their assessments of our performance and operating trends. In accordance with Regulation G, reconciliations of non-
GAAP financial measures to the most directly comparable GAAP financial measures, including limitations associated with these non-GAAP financial measures, are provided later
in this presentation.

        ©2021 GAN Ltd. (NASDAQ: GAN)                                  Q4 and FY 2020 Earnings | March 25, 2021                                                                            1
4Q and FY 2020 Earnings Presentation - March 25, 2021 - GAN
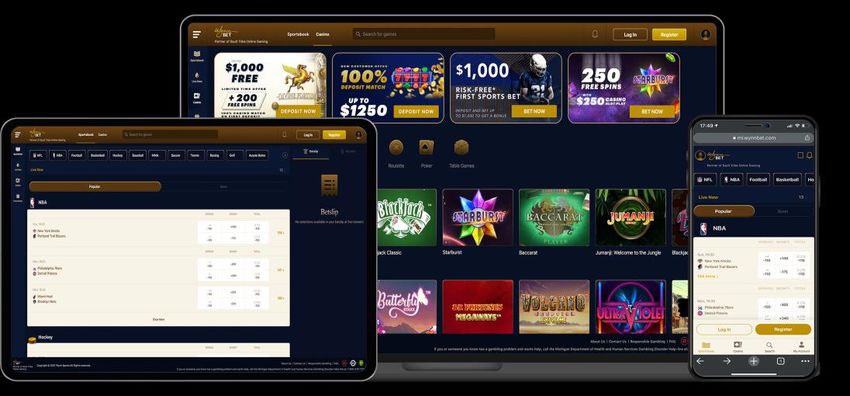
Operational Highlights

©2021 GAN Ltd. (NASDAQ: GAN)   Q4 and FY 2020 Earnings | March 25, 2021   2
4Q and FY 2020 Earnings Presentation - March 25, 2021 - GAN
2020 Key Performance Highlights & Looking Forward to 2021

                                  U.S. B2B Market leadership, strong growth in recurring revenue, major client wins, Sports capability acquired

                                              • #1 B2B U.S. Internet gambling Platform (second year running) by clients’ Gross Operator Revenues
                                              • Core B2B SaaS recurring revenue grew +67% YoY to $25.9M, led by U.S. growth
                                                    • U.S. real money iGaming & online sports betting revenues grew +92% YoY to $12.8M
                                                    • U.S. Simulated Gaming revenue increased +77% YoY to $8.2M
                                                    • Italian real money iGaming revenue increased +17% to $5.0M
                                              • 6 new client wins including PENN National, Wynn Resorts & Churchill Downs
                                              • Acquisition of COOLBET sports tech, risk management & trading capabilities for U.S. launch in 2021
                                              • Significant investment in headcount, “burstable bandwidth”, costs related to U.S. NASDAQ listing, and M&A

                                  Q1 2021: Revenue guidance of $24M - $25M on $200M+ of Gross Operator Revenue

                                              • Michigan: Simultaneous launch of 3x clients on 1/22 securing 21%+ combined total market share YTD 1
                                              • Tennessee: Launch of Churchill Downs as 6th B2C operator of online sports betting (GAN’s 6th real money State)
                                              • Client wins: Seneca (NY), Gila River (AZ) for Simulated Gaming & Westgate Resorts’ SuperBook® (CO, NJ) real money
                                              • Patent: Licensing deal completed ($3M) setting U.S. market value of $75 per Linked reward card
                                              • COOLBET: $12M+ revenue in Q1 up +70% YoY and operating at >20% EBITDA margin

                                  2021 Guidance: $100M - $105M revenue from $900M+ in Gross Operator Revenue
                                   1 Market   share numbers are derived from publically available data from the Michigan Gaming Control Board and Eilers and Krejcek, numbers are YTD as of February 28, 2021.

   ©2021 GAN Ltd. (NASDAQ: GAN)                                    Q4 and FY 2020 Earnings | March 25, 2021                                                                                                      3
4Q and FY 2020 Earnings Presentation - March 25, 2021 - GAN
Unlocking Scale and Shareholder Value
Executed transformational up-list to NASDAQ, completed follow-on offering, delivered significant incremental shareholder value

                                                                                                                                 Market Capitalization for
                 From AIM to NASDAQ                                                             COOLBET Acquisition
                                                                                                                                   Shareholder Value

                      $168M                                                                         $187M                            $743M
              in new capital + U.S. investors,                                            equity value of COOLBET, adding       GAN market cap increased over
                  visibility and valuation                                                  strategic, high-growth B2C                 10x in 20201
                                                                                                revenue and EBITDA
                                                                                             at a competitive multiple

 1 GAN   market capitalization of $69.0M on 12/31/2019, with a close of $743M market cap on 12/31/2020

         ©2021 GAN Ltd. (NASDAQ: GAN)                                                Q4 and FY 2020 Earnings | March 25, 2021                                   4
4Q and FY 2020 Earnings Presentation - March 25, 2021 - GAN
Competitive Advantage: Driving New Client Wins
Multi-State proven U.S. technology solution, Strategic Patent, superior conversion funnel, analytics framework & U.S. data
mountain

     New Clients: Real Money iGaming & Sports

           Select new RMiG contracts in 2020:
           • Churchill Downs, national contract for iGaming and online sports betting
           • Wynn Resorts, landmark 10-year deal for Michigan iGaming & sports
           • Cordish Group, for Pennsylvanian iGaming

           Q1 2021: Westgate Resorts’ SuperBook® (CO Sports, NJ Sports & Casino)

     New Clients: Simulated Gaming

           Select new client wins in 2020:
           • Snoqualmie, major Native American casino in Washington
           • Route 66, Native American casino in New Mexico
           • PENN National, major commercial casino operator, nationwide

           Q1 2021: Seneca Gaming, major Native American casino in New York and Gila
           River and southwest operator in Arizona

     ©2021 GAN Ltd. (NASDAQ: GAN)                                Q4 and FY 2020 Earnings | March 25, 2021                    5
Competitive Landscape
   Fast-growing Michigan provides an at-a-glance comparison opportunity: How are B2B technology vendors faring online?

                                                                                                                 Powering Michigan’s Online Gambling Market

                                                                                                                    Three major clients operating online in Michigan:
                                                                                                                    • FanDuel Group, leveraging GAN’s Platform for iGaming
                                                                                                                    • Churchill Downs, Twin Spires iGaming and online sports betting
                                                                                                                    • Wynn Resorts, WynnBET iGaming & sports
                                                                                                                    $132M in first 5 weeks Gross Operator Revenues in Michigan 21%+ of total
                                                                                                                    Michigan online gambling enabled by GAN, YTD

           Continued leadership among B2B peers

               Breakdown of B2B Casino & Sports online gross revenue, by key technology vendor,
               delivered to Michigan operators YTD1:

               • 68% delivered by GAN (iGaming & Sports)
               • 22% delivered by KAMBI (Sports only)
               • 10% delivered by all other U.S. B2B vendors, combined

               GAN leads in delivering online gambling in the fastest-growing State in the U.S.

1 All   market share numbers are derived from publically available data from the Michigan Gaming Control Board, numbers are from January & February 2021.

                ©2021 GAN Ltd. (NASDAQ: GAN)                                                 Q4 and FY 2020 Earnings | March 25, 2021                                                          6
Outlook: Continuing Momentum in 2021
    Successful launch in Michigan & Tennessee, COOLBET growth, first patent license of 2021 completed

                         Michigan ‘Big Bang’ & Multi-State in Tennessee                                                                                                       COOLBET Acquisition

                                                        • FanDuel’s Online Casino, Churchill Downs’                                          • Acquisition announced 11/16/2020: Closed 1/1/2021
                                                          Twin Spires & Wynn Resorts launched 1/22
                                                                                                                                             • Secured first client for B2B Sports contract in U.S. (VA), pending licensure
                                                        • Apple ‘native’ IOS App, Android App,
                                                          Desktop & Mobile Web launched ‘Day One’                                            • COOLBET International operations exceeding expectations in Latin America &
                                                                                                                                               Europe
                                                        • 125+ Online Casino games
                                                          from 4x RGS integrations
                                                                                                                                                                        Content & Strategic U.S. Patent
                                                        • 26%+ Michigan’s Internet gambling market
                                                          operating on GAN technology YTD1
                                                                                                                                             • Super RGS and exclusive iGaming content procurement strategy now well
                                                        • Tennessee launch of TwinSpires.com for                                               advanced, strongly positioned for 2021 revenue contribution
                                                          Churchill Downs on 3/18 leveraging GAN’s
                                                          ‘One Account, Any State’ tech capability                                           • 13+ years remaining on U.S. patent for integrating online with retail

                                                                                                                                             • $3M Patent license deal expected Q4 2020 - closed early Q1 2021

                                                                                                                                             • Substantial pipeline of incremental U.S. Patent licensing deals

                                                                                                                                             • Balance sheet strength enables heightened enforcement & monetization

1 Market   share numbers are derived from publically available data from the Michigan Gaming Control Board and Eilers and Krejcek, numbers are YTD as of February 28, 2021.

                 ©2021 GAN Ltd. (NASDAQ: GAN)                                                  Q4 and FY 2020 Earnings | March 25, 2021                                                                                       7
Financial Results

©2021 GAN Ltd. (NASDAQ: GAN)   Q4 and FY 2020 Earnings | March 25, 2021   8
Revenue Drivers and KPIs
#1 U.S. iGaming platform in 2020, with over $500M in GOR and 21% market share

                                                                                                                                                     U.S. iGaming
                                                  Gross Operator Revenue                                                                     GOR and iGaming Market Share

                                                                                                                                      $400                                  21%    22%
                                                                                                                                                                                   21%
                                                                                                                                                                                   21%
                                                                                                                                      $300
                                                                                                                                                                                   20%
   $ in millions

                                                                                                                      $ in millions
                                                                                                                                                                                   20%
                                                                                                                                      $200                                         19%
                                                                                                                                                18%                                19%
                                                                                                                                                                                   18%
                                                                                                                                      $100
                                                                                                                                                                                   18%
                                                                                                                                                                                   17%
                                                                                                                                                  $93                       $348
                                                                                                                                        $0                                         17%
                                                                                                                                                  2019                      2020

     Key Highlights

   •                Growth in U.S. iGaming business outpaced the market, up 273% year-over-year vs. 230% for the total addressable market - as a
                    result of execution and increased market share

                   ©2021 GAN Ltd. (NASDAQ: GAN)                            Q4 and FY 2020 Earnings | March 25, 2021                                                                      9
Revenue Performance
Strong growth in core enterprise platform business driven by momentum in iGaming and Simulated
       $ in millions

                                                                                                                                                    RMiG

                                                                                                                                       73%
                                                                                                                          27%
                                                                                                              SimGaming

   Key Highlights

   •    Annual revenue increased 17% year-over-year to $35.2M in 2020; $3.0M patent revenue pushed to Q1, as announced February 9th
   •    Organic growth of our core B2B business, excluding the 2019 impact of UK B2C and patent licensing, performed extremely well, with revenue
        increasing 62% year-over-year

       ©2021 GAN Ltd. (NASDAQ: GAN)                      Q4 and FY 2020 Earnings | March 25, 2021                                                          10
Adjusted EBITDA
Strong growth in core enterprise platform business driven by momentum in iGaming and Simulated

                                                       Adjusted EBITDA                                                                     Capital Expenditures

                                                                                                                               $6

                                                                                                                                                                  $5.9
                                                                                                                               $5
   $ in millions

                                                                                                               $ in millions
                                                                                                                               $3
                                                                                                                                    $2.9
                                                                                                                               $2

                                                                                                                               $0
                                                                                                                                    2019                          2020

     Key Highlights

   •                Year-over-year, Gross Profit in our core business increased $11.3M and 107%, excluding the 2019 impact of UK B2C and patent licensing, which
                    helped mitigate the significant investments we made to position the company for 2021 and beyond
   •                A portion of the capital raised was deployed to software development, as we continue to enhance the platform and our capabilities, such as for
                    “one account, any product, any state”

                   ©2021 GAN Ltd. (NASDAQ: GAN)                          Q4 and FY 2020 Earnings | March 25, 2021                                                        11
1Q and FY 2021 Guidance
Significant momentum and anticipated favorable Q1 results on both B2B organic and B2C accretive growth
                                        Weekly Total GOR Trends                                                                         Total RMiG GOR Trends

                         $25                                                                                           $25

                         $20                                                                                           $20

                         $15                                                                                           $15                                            $6

                                                                                                       $ in millions
         $ in millions

                         $10                                                                                           $10

                         $5                                            $20                                              $5                                           $13
                                      $10                                                                                          $9
                         $0                                                                                             $0
                                 Week of 12/6/20                  Week of 3/14/21                                            Week of 12/6/20                    Week of 3/14/21

                                      Total GOR          4 week rolling average                                                            RMG (No MI)   MI

   Key Highlights

   •    Guidance of annual revenue of $100M to $105M, with $24M to $25M for the first quarter.
   •    Focus on long-term AEBITDA in 2021; investments in 2020 related to NASDAQ listing and COOLBET are complete

       ©2021 GAN Ltd. (NASDAQ: GAN)                                     Q4 and FY 2020 Earnings | March 25, 2021                                                                  12
Appendix

©2021 GAN Ltd. (NASDAQ: GAN)   Q4 and FY 2020 Earnings | March 25, 2021   13
U.S. GAAP P&L
  (Unaudited, in thousands of US$)                                          Three Months Ended December 31,       Year Ended December 31,
                                                                             2020                    2019      2020                    2019
  Total Revenue                                                              8,900                  10,691    35,159                  29,971
  RMiG
      Revenue                                                                5,978                  9,291     25,610                  24,228
      Cost of revenue (1)                                                    2,250                  (155)      7,486                  4,833
      Impairment of internal-use software                                      -                     626         -                     626
      RMiG segment gross profit                                              3,728                  8,820     18,124                  18,769
      Segment gross profit margin %                                           62%                    95%        71%                    77%
  Simulated Gaming
      Revenue                                                                2,922                  1,400      9,549                   5,743
      Cost of revenue (1)                                                    1,323                   526       2,985                   2,270
      Simulated Gaming segment gross profit                                  1,599                   874       6,564                   3,473
      Segment gross profit margin %                                           55%                    62%        69%                     60%

  Cost of revenue - depreciation and amortization                             778                    808      2,968                   4,253
  Total gross profit                                                         4,549                  8,886     21,720                  17,989
  Gross profit margin %                                                       51%                    83%       62%                     60%

  Sales and marketing                                                        1,264                   955       5,046                  3,487
  Product and technology                                                     2,939                  1,310     11,032                  3,413
  General and administrative (1)                                             8,519                  3,052     24,825                  8,435
  Operating costs - depreciation and amortization                             106                     21        289                     63
  Total operating costs and expenses                                         12,828                 5,338     41,192                  15,398

  Operating income (loss)                                                   (8,279)                 3,548     (19,472)                 2,591
  Other (income) expense, net                                                 16                     (5)        392                      13
  Income (loss) before income taxes                                         (8,295)                 3,553     (19,864)                 2,578
  Income tax expense                                                          34                     165        353                     574
  Net income (loss)                                                         (8,329)                 3,388     (20,217)                 2,004

     ¹ Excludes depreciation and amortization

   ©2021 GAN Ltd. (NASDAQ: GAN)                     Q4 and FY 2020 Earnings | March 25, 2021                                                   14
U.S. GAAP Balance Sheet

         (Unaudited, in thousands of US$)               As of December 31                                                             As of December 31
         ASSETS                                         2020         2019               LIABILITIES AND STOCKHOLDERS' EQUITY          2020        2019
         Current assets                                                                 Current liabilities
         Cash                                          152,654      10,279              Accounts payable                              4,707       2,645
         Accounts receivable, net                       8,056       5,604               Accrued expenses                              8,538       3,157
         Prepaid expenses                               1,912        575                Contract liabilities                          1,083       3,023
         R&D tax credit receivable                        -         1,127               Operating lease liabilities                   262          289
         Other current assets                           874         1,181               Other current liabilities                     2,722       1,179
         Total current assets                          163,496      18,766              Total current liabilities                    17,312      10,293

         Property and equipment, net                    1,320        303                Operating lease Liabilities                   313          693
         Capitalized software development costs, net    6,648       4,784               Other noncurrent liabilities                   57          55
         Operating lease right-of-use assets            577         1,051               Total liabilities                            17,682      11,041
         Intangible assets, net                         468          348
         Other assets                                   737          934                Total stockholders' equity                   155,564     15,145

         Total assets                                  173,246      26,186              Total liabilities and stockholders' equity   173,246     26,186

  ©2021 GAN Ltd. (NASDAQ: GAN)                            Q4 and FY 2020 Earnings | March 25, 2021                                                        15
Adjusted EBITDA Reconciliation
                                                                                                                       Three Months Ended                               Year Ended
                                    (Unaudited, in thousands of US$)
                                                                                                                          December 31,                                 December 31,

                                                                                                                      2020                 2019                 2020                  2019

                                    Net income (loss)                                                                (8,329)               3,388              (20,217)               2,004
                                    Income tax expense                                                                 34                   165                  353                  574
                                    Other (income) expense, net                                                        16                   (5)                  392                   13
                                    Depreciation and amortization                                                     884                   829                 3,257                4,316
                                    Share-based compensation and related expense                                     1,387                  99                 10,181                 367
                                      Initial public offering transaction related                                       -                    -                  2,831                   -
                                    Impairment of internal-use software                                                 -                   626                    -                  626
                                    Tax related provisions                                                              -                    -                   939                    -
                                    Adjusted EBITDA                                                                  (6,008)               5,102               (2,264)               7,900

Use of Non-GAAP Financial Measures
This presentation uses certain non-GAAP financial measures as defined in SEC rules. We report our financial results in conformity with generally accepted accounting principles in the United States of America, or GAAP, and also
communicate with investors using certain non-GAAP financial measures. These non-GAAP financial measures are not in accordance with, nor are they a substitute for or superior to, the comparable GAAP financial measures. These non-
GAAP financial measures are intended to supplement the presentation of our financial results that are prepared in accordance with GAAP. Based upon feedback from investors and financial analysts, we believe that the supplemental
non-GAAP financial measures we provide are useful to their assessments of our performance and operating trends. In accordance with Regulation G, reconciliations of non-GAAP financial measures to the most directly comparable
GAAP financial measures are provided hereafter.

Adjusted EBITDA is a non-GAAP financial measure that is provided as supplemental disclosure which is defined as net income (loss) before interest costs, income taxes, depreciation and amortization, impairments, share-based
compensation expense and related expense, initial public offering related costs and other items which our Board of Directors considers to be infrequent or unusual in nature.

Management uses Adjusted EBITDA to measure its financial performance. Specifically, it uses Adjusted EBITDA (1) as a measure to compare its operating performance from period to period, as it removes the effect of items not directly
resulting from core operations and (2) as a means of assessing its core business performance against others in the industry, because it eliminates some of the effects that are generated by differences in capital structure, depreciation,
tax effects and unusual and infrequent events. The presentation of Adjusted EBITDA is not intended to be used in isolation or as a substitute for any measure prepared in accordance with GAAP. Adjusted EBITDA, as defined, may not be
comparable to similarly titled measures used by other companies in the industry, and Adjusted EBITDA may exclude financial information that some investors may consider important in evaluating the Company’s performance.

       ©2021 GAN Ltd. (NASDAQ: GAN)                                                    Q4 and FY 2020 Earnings | March 25, 2021                                                                                                                16
Revenue Drivers and KPIs – Full Year
YoY Increases in Active Player Days and ARPDAU; Take Rate stable excluding 2019 UK B2C and patent licensing

                     Active Player-Days(1)
                                  (in millions)                                                                             ARPDAU(2)                                                                            GAN TAKE RATE(3)

  30                                                                                          $20                                                                                           10%
                                                                                                                                                                                                                   1.3%
  24                                                                                          $16                                                                                             8%
                                                                                                                                                                                                                   1.4%

  18                                                                                          $12                                                                                             6%                   1.8%                         1.6%

  12                                                                                            $8                                                                                            4%

                                                                                                                                                                                                                     5%                         4.8%
   6                                                                                            $4                                                                                            2%
                      $24.5                                $29.3                                                    $12.9                               $18.6
   0                                                                                            $0                                                                                            0%
                       2019                                 2020                                                     2019                                2020                                                      2019                         2020

                                                                                                                                                                                                  Platform &           Development   2019         2019 Patent
                                                                                                                                                                                                  Content Fees         Services &    WinStar
                                                                                                                                                                                                                       Other         U.K. B2C
   Key Highlights

   •     ARPDAU increased as U.S. iGaming recurring revenue more than doubled as a percentage of total revenue; overall Simulated recurring ARPDAU
         increased from approximately $1.00 to $1.50

   ¹ GAN defines Active Player-Days as unique individuals who log on and wager each day (either wagering with real money or playing with virtual credits used in Simulated Gaming), aggregated during the calendar period
   ² GAN defines ARPDAU as Gross Operator Revenue divided by the identified number of Active Player-Days
   ³ Take Rate is a measure of all GAN revenue over Gross Operating Revenue generated on GAN’s Platform

        ©2021 GAN Ltd. (NASDAQ: GAN)                                                                 Q4 and FY 2020 Earnings | March 25, 2021                                                                                                                   17
Revenue Drivers and KPIs – Quarterly Trend
GAN Take Rate decreased vs. prior due to 2019 impact of UK B2C and patent licensing, and increase of PA with higher tax rates

                     Active Player-Days(1)
                                  (in millions)                                                                             ARPDAU(2)                                                                            GAN TAKE RATE(3)

                                                                                                                                                          $23.02
                                         9.0       9.0                                                                                                                                               16.1%
                                                                                                                                                                $18.93
                                                                       7.5                                                                  $15.72                       $18.31             10.8%
                                                                                7.2

                                                              5.6                                                        $14.89
                                                                                                                                  $13.43                                                                       7.6%
            5.3               5.4                                                                              $11.52
                      4.8                                                                                                                                                                                                          8.9%                 7.2%
   4.6                                                                                                $11.22
                                                                                                                                                                                                                            6.8%          5.4%   6.4%          6.7%
                                                                                             $8.63

   Q4       Q1        Q2        Q3       Q4        Q1        Q2        Q3       Q4            Q4        Q1        Q2        Q3       Q4        Q1        Q2        Q3       Q4               Q4        Q1        Q2         Q3     Q4      Q1    Q2      Q3    Q4
   18       19        19        19       19        20        20        20       20            18        19        19        19       19        20        20        20       20               18        19        19         19     19      20    20      20    20

   Key Highlights
   •     ARPDAU declined QoQ as Simulated Gaming increased from 21% of revenue in Q3 to 29% of revenue in 4Q
   •     Take rate declined QoQ, as Platform and Content Fee revenue consisted a higher percentage of overall revenue vs. 3Q

   ¹ GAN defines Active Player-Days as unique individuals who log on and wager each day (either wagering with real money or playing with virtual credits used in Simulated Gaming), aggregated during the calendar period
   ² GAN defines ARPDAU as Gross Operator Revenue divided by the identified number of Active Player-Days
   ³ Take Rate is a measure of all GAN revenue over Gross Operating Revenue generated on GAN’s Platform

         ©2021 GAN Ltd. (NASDAQ: GAN)                                                              Q4 and FY 2020 Earnings | March 25, 2021                                                                                                                           18
GAN.com

                                                                    @GameAccountNetwork
                                                                       IR@GAN.com

©2021 GAN Ltd. (NASDAQ: GAN)   Q4 and FY 2020 Earnings | March 25, 2021                   19
You can also read