Gray Television, Inc. Investor Presentation - NYSE:GTN
←
→
Page content transcription
If your browser does not render page correctly, please read the page content below
Gray Television, Inc.
Investor Presentation
NYSE:GTN
May 2021

Updated for March 31, 2021 Financial Information

4370 Peachtree Road, NE, Atlanta, GA 30319 | P 404.504.9828 | F 404.261.9607 | www.gray.tv

                                                                                             0
GRAY TELEVISION, INC.

             Leading the Industry with the Highest
           Quality Portfolio of Local Television Stations

Financial data reflects results “as reported” except where “Combined Historical Basis” (or “CHB”) is noted. Revenue is
presented net of agency commissions. Ratings data derived from Comscore, Inc. (“Comscore”). ”Completed
Transactions” includes all acquisitions or dispositions completed as of December 31, 2020. See Glossary at end for
definitions. If Appendix is not included, see full presentation located at www.gray.tv for Non-GAAP Reconciliations.
                                                                                                                         1
Gray Announces
Two Acquisitions          TV markets reaching

Transforming It     113   36% US TVHH

Into the Nation’s   89%
                           Markets with #1/#2
                           Ranked Stations

Second Largest
Broadcaster

                                                2
Gray Television’s New National Footprint

                                           3
Two Excellent Acquisitions

                                                       February 1: Gray to Acquire Quincy Media

    Combination Highlights(1)               ▪   On February 1, 2021, Gray announced its acquisition of Quincy Media, Inc.
                                                for $925 million in cash. On April 29, 2021, Gray announced the
                                                divestiture of 10 of Quincy’s stations in seven overlap markets to Allen
▪   79 #1 Rated TV Stations
                                                Media Broadcasting, LLC for $380 million.

▪   $3.1 Billion in 2019/2020 CHB           ▪   Acquisition to add 8 new markets, each with the #1 or #2 ranked
    Blended Revenue                             television station. Closing expected in Q3 2021, following expected receipt
                                                of regulatory and other approvals

▪   Combined Quincy + Meredith              ▪   Purchase price represents a multiple of 6.9x ’19/’20 EBITDA including $23
    is anticipated to be                        million of expected year-1 annualized synergies.
    approximately 50% accretive
    to blended 2021/2022 FCF

                                                 May 3: Gray to Acquire Meredith Local Media Group
▪   Highest CHB OCF(2) / TVHH in
    the Industry
                                            ▪   On May 3, 2021, Gray announced its agreement to acquire Meredith
                                                Corporation’s Local Media Group for $2.7 billion in cash. Gray will divest
▪ Both transactions announced                   one of its currently owned television stations in the companies’ only
  and Company
Source: expected    to close
               filings, Nielsenin 2021
                                and             overlap market.
Comscore
(1) Gives effect to all other pending       ▪   Acquisition to add 11 new markets, including the #1 or #2 ranked
    acquisitions and required regulatory
    divestitures                                television station in 8 markets. Closing expected in Q4 2021, following
(2) Combined Historical Basis Operating         receipt of regulatory and other approvals.
    Cash Flow as defined in the Senior
    Credit Agreement is equivalent to the   ▪   Purchase price represents a multiple of 7.9x ’19/’20 operating cash flow
    presentation of Adj. EBITDA
                                                including $55 million of expected year-1 annualized synergies.

                                                                                                                              4
Combined Company Snapshot
($ in Millions)                                                                                                 Meredith Local Media Group                             Pro Forma
                                                                         Gray + Quincy (1)                                                       Gray + RemainCo
                                                                                                                       (RemainCo)                                        Impact

Financial Profile
2019 / 2020 CHB Blended Net Revenue                                          $2,372                                              $770               $3,141               32%
2019 / 2020 CHB Blended OCF                                                    $889                                              $286               $1,230 (2)           38%
% Margin                                                                       37%                                               37%                  39%

Scale
Markets                                                                         101                                                12                    113             12%
Gross TV Household Reach                                                      25.0%                                            11.2%                   36.2%

Asset Quality
Markets with #1 / #2 Ranked Stations                                              93                                                8                  101                9%
2018 CHB Political Revenue                                                      $262                                             $135                 $397               52%
2020 CHB Political Revenue                                                      $473                                             $219                 $692               46%
2020 CHB Gross Retransmission Revenue                                           $904                                             $366               $1,270               41%

                                                                                                                                         1
                                                                             27                                                                         32
                                                                                                                                                                  60
                                                                                             59                        5
                     Big 4
               Network Affiliated                                     29
                                                                                                                                                  30
                   Channels
                                                                                                                                             7

                                                                                  57                                       1
                                                                                                                                                             64

Source: Nielsen and Comscore
Note: RemainCo financial information compiled from unaudited financial statements of Local Media Group
(1) Pro forma for the divestiture of Quincy’s seven overlap markets and Gray’s station in Flint, MI; includes $23 million of synergies
(2) Includes $55 million of synergies
                                                                                                                                                                          5
Gray Will be the Second Largest TV Broadcast
      Group with the Highest Quality Assets
                                                                  2019 / 2020 CHB Blended Adj. EBITDA(1)

                                             $1,837

                                                              $1,230

                                                                                $959             $925
TV Broadcast Affiliate                                                                                            $889

   Group Owners                                                                                                                    $660

                                                                                                                                                    $435
                                                                                                                                                                     $320                  $286
                                                                                                                                                                                                           $180

                                                                                                                                                            (4 )                (4 )                                  (5 )
                                             Nexstar          Gray +         Sinclair (TV)      TEGNA            Gray +           Scripps          Hearst          Cox Media           Meredith Local   Graham (TV)
                                                             RemainCo (2 )                                       Quincy (3 )                                       Group - TV           Media Group
                                                                                                                                                                                        (RemainCo)
Financial
Adj. EBITDA / TVHH                             $24.5            $28.1            $20.5            $19.4            $29.4             $7.6            $19.3            $20.4                 $21.2           $21.4

Operational
Markets                                          115              113                87               52             101                76              26               20                    12                 6
# 1 Rated Stations                                 28               79               18               12               76                 9                9                4                     3               2
% Markets with
                                                24%              70%              21%              23%              75%              12%              35%              20%                   25%             33%
#1 Rated Stations
Markets with
                                                   68             101                49               30               93               14              17                  8                     8               4
#1 / #2 Rated Stations
% Markets with
                                                59%              89%              56%              58%              92%              18%              65%              40%                   67%             67%
#1 / #2 Rated Stations
% Nielsen TVHH                                  62%              36%              39%              39%              25%              72%              19%              13%                   11%                7%

Source: Company filings, Wall Street research, BIA Investing in Television Market Report, Nielsen and Comscore
Note: Dollars in millions, except Adj. EBITDA / TV household; RemainCo financial information compiled from unaudited financial statements of Local Media Group
(1) Adj. EBITDA for Gray is Operating Cash Flow as defined in the Senior Credit Agreement
(2) Includes $55 million of synergies
(3) Pro forma for the divestiture of Quincy’s seven overlap markets and Gray’s station in Flint, MI; includes $23 million of synergies
(4) EBITDA estimates are derived from 2019 BIA revenue and extrapolate ’19A/’20E based on peer revenue growth and average peer EBITDA margin
(5) Based on 2020 broadcast revenue of $525 million and extrapolated based on estimated television peer revenue growth and ’19A/’20A EBITDA margin for Graham’s broadcast segment                           6
An Industry Leading Power
                    The following data is for
                      Gray Television, Inc.
                             BEFORE
                  giving effect to the pending
                      Quincy and Meredith
                          Acquisitions.
                                                 7
Diversified Revenue
Approximate Advertising
2020 Revenues
Revenue Contributions 2019-2020
3% 3%
Local 9%
Local News
National Network Prime
32% 13%
Political 3% Network News
36% 50%
Retransmission
9% Network Sports
Production Companies
8% Syndication
16%
18%
Other
Other-TV Stations
2020 Big 4 2020 2020
Affiliates Revenues Broadcast Cash Flow
All Others All Others
8% 8%
25 9%
10%
37%
55 36%
28 14% 15%
52 32% 31%
8Well Positioned for Political Revenue
Political Revenue Per TV
Household
Gray’s Local News Stations
Serve the Most Competitive $17.57
Political Areas
2021 Gubernatorial Races (2) $9.63
Gray Stations in 4 VA markets. $8.80
2022 Gubernatorial Races (37) 2016 2018 2020
Gray stations in 28 states: AK, AL, AR,
AZ, CO, FL, GA, HI, IA, ID, IL, KS, ME,
MI, MN, NE, NH, NY, NV, OH, OK, SC, SD, Revenue per company filings shown in millions of dollars. TV Household
estimates from Comscore. Gray data for 2016 is CHB for all transactions
TN, TX, VT, WI, WY completed as of 12/31/16 and Gray data for 2018 is CHB for all
transactions completed as of 12/31/19.
2022 US Senate Races (34)
Gray stations in 27 states: AK, AL, AR, Political Advertising Revenue
AZ, CO, FL, GA, HI, IA, ID, IL, IN, KS, KY, $430
LA, MO, NC, ND, NY, OH, OK, VT, NH, NV,
SC, SD, WI $186 $235
$31 $68
2022 House Races 2016 CHB 2017 CHB 2018 CHB 2019 CHB 2020
All Districts, All Markets
In Millions
Gray data is CHB for all transactions completed as of 12/31/19.
9Strong Network and Distribution Positions
MVPD Subscribers
Year-End Retransmission Revenue ($ in millions)
Renewal
Retransmission Revenue
Schedule
Retransmission Expense (“Reverse Comp.”)
55% - 2020 Retransmission Revenue net of Expense
(and 2023) $1,000
$867 $867
25% - 2021
(and 2024) $796 $799
$800
20% - 2022 $677
(and 2025)
$600 496 496
420 $540 422
351
$444
2021 $400 $355 282
$277
206
165
$201
$200 $152 136
376 371 377 371
98 326
$75 70 238 258
2022 20 141
190
82 103
55
$0
2014 2015 2016 2017 2018 2019 2020 2016 2017 2018 2019 2020
As Reported CHB
2023
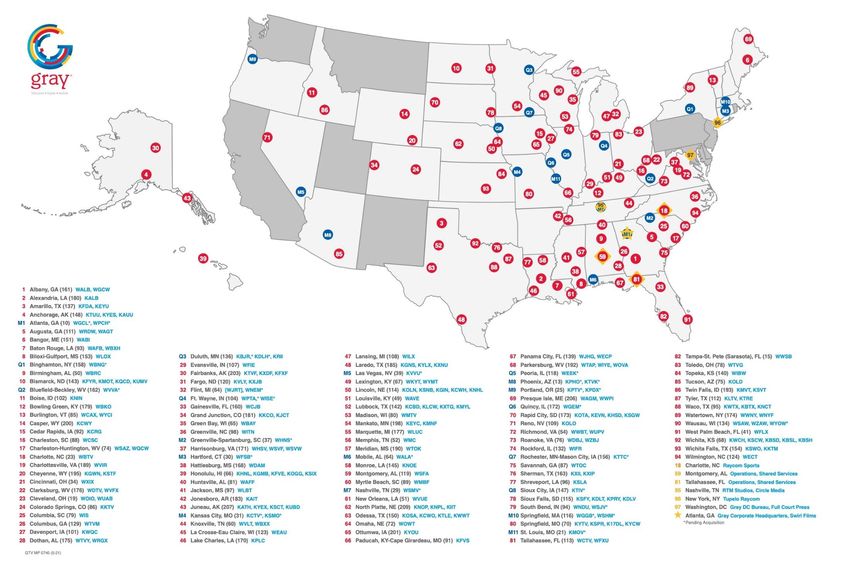
10Successful Digital Ventures
RECORD BREAKING GROWTH FOR OVER 1,000 CHANNELS
GRAY’S PLATFORM IN 2020 OVER 2019: STREAMED ACROSS ALL PLATFORMS
2020 SESSIONS: +24%
2020 VIDEO PLAYS: +13%
2020 USERS: +37%
2020 PAGE VIEWS: +13%
1.1 BILLION MONTHLY AGGREGATE USERS IN 2020
Gray’s in-house Digital Agency Servicing over 2,200 campaigns monthly.
With a suite of 15+ products and service offerings.
Premion delivers Provides a free,
brand-safe CTV and OTT ad-supported national
impressions at scale, with streaming service with live and
full transparency for on-demand video streaming
channels, with both local and
advertisers, across 125+
unique programming. 11
premium networks.Consistent Growth (As Reported Basis)
($ in millions)
Revenue 369% Net Income 754%
$3,000 $450 $410
$2,381 $400
$2,500
$2,122 $350
$2,000 $300 $262
$250 $211
$1,500 $179
$1,084 $200
$812 $883 $150
$1,000
$508 $597
$100 $48 $62
$500 $39
$50
$0 $0
2014 2015 2016 2017 2018 2019 2020 2014 2015 2016 2017 2018 2019 2020
Total Stockholders’ Equity 712%
Operating Income 388%
$800 $752 $2,000
$1,753
$1,800
$700
$1,600 $1,464
$600 $1,400
$478 $1,187
$500 $1,200 $993
$389
$400 $1,000
$291 $800
$300 $234 $493
$600 $429
$200 $154 $140 $400 $216
$100 $200
$0 $0
2014 2015 2016 2017 2018 2019 2020 2014 2015 2016 2017 2018 2019 2020
12Robust Free Cash Flow
Generation and Conversion
Presidential Non-Election Midterm Election Non-Election Presidential
2019 CHB 2020
Election Year Year Year 2018 OCF Year 2019 OCF Election Year
Average
2016 OCF Buildup 2017 OCF Buildup Buildup Buildup 2020 OCF Buildup
FCF Per Diluted Share FCF Per Diluted Share FCF Per Diluted Share FCF Per Diluted Share FCF Per Diluted Share FCF Per Diluted Share
$2.04 $4.75 $2.32 $3.53 $2.96 $5.32 $2.72 $3.58 $5.76 $4.65
FCF as a Percentage of FCF as a Percentage FCF as a Percentage FCF as a Percentage FCF as a Percentage FCF as a Percentage
OCF of OCF of OCF of OCF of OCF of OCF
49% 50% 57% 44% 58% 58% 43% 50% 59% 55%
($ in millions) $1,000
$914 $942(2) $900
$830
$800
$804
$718
$700
$690
$633(2)
$534 $559 $600
$400 $458
$358 $500
$301 $273
$455(2)
$400
$300(2) $299(2)
$70 $57 $263 $74 $69 $69 $75 $300
$81
$52 $52 $52 $52 $52
$148 $171 $52
$52 $200
$216 $216 $56 $216
$44 $35 $216 $216 $198 $100
$180
$93 $91 $102
$66 $64 $38 $70 $47
$15 $2 $34 $23 $23 $0
CHB CHB CHB CHB Average
2016 2017 2018 2019 2020 19CHB/20
Taxes Cash Interest excluding amortization of deferred financing costs/premiums (1) Preferred Dividends Capex Free Cash Flow
(1) CHB interest expense for 2016, 2017, 2018 and 2019 estimated with incremental indebtedness and estimated cash interest relating to acquisition debt financing as if the
acquisition debt financing had occurred on the first day of the period reported
13
(2) As reported OCF is equal to Broadcast Cash Flow less Cash Corporate Expenses plus Pension Expense less Pension ContributionsSuccessful Integration of Acquisitions
And Meaningful Deleveraging
Financial Leverage Net of All Cash (as defined in our Senior Credit Facility)
6.0x
Guidance
YE 2021(1) Net 5.1x
Leverage Ratio: 4.8x
4.4x
3.4x 4.2x 3.95x 3.88x
Approximately 5.3x
Projected total debt 2.9x 3.0x 2.4x
(excluding preferred 4.3x
3.6x 2.7x 2.7x
stock) net of all cash,
assuming no M&A other
than the Quincy Media
2.6x 3.0x
and Meredith acquisitions
7.1 1.9x 2.0x
on trailing 8-quarter
0.8x 1.2x 1.2x
basis 0.6x
2014 2015 2016 2017 2018 2019 2020 1Q2021
As of the respective period end:
Total debt netting all cash (in millions) $1,201(3) $1,134 $1,456 $1,399 $1,154 $3,548 $3,262 $3,217
L8QA(4) OCF(2) (in millions) $200 $235 $288 $336 $383 $816 $826 $829
Note: Financial leverage excludes preferred stock
(1) Secured debt netting all cash on hand as of the respective balance sheet date
(2) Operating Cash Flow (“OCF”) as defined under the existing credit agreement, which includes Unsecured Debt Netting All Cash / OCF(2)
adjustments for all transactions completed as of the respective balance sheet dates
(3) For 2014 and 2021, total debt netting all cash includes $10 million and $1 million in undrawn letters
Secured Debt Netting All Cash(1) / OCF(2)
of credit, respectively
(4) Last eight quarter average OCF as calculated in the applicable quarterly compliance certificate 14Staggered Debt Maturity Profile
No Maturities until 2024
($ in Millions)
$2,500
$300 Million Revolver Due Jan 2026 ($299 Million Undrawn; $1 Million Letter of Credit Issued)
$299
Term Loan B Due Feb 2024 (L+225)
$2,000
Term Loan C Due Jan 2026 (L+250)
$4.0 Billion Total
Senior Notes Due Jul 2026 (5.875%)
Principal Amount of
$1,500
Senior Notes Due May 2027 (7.000%) $1,190 Debt Outstanding
Senior Notes due October 2030 (4.750%) at March 31, 2021
$1,000
$500 $800
$700 $750
$595
$0
2021 2022 2023 2024 2025 2026 2027 2028/ 2030
2029
Note: For illustrative purposes, excludes Incremental Term Loan B amortization
15As Reported 1Q 2021
Three Months Ended March 31,
% Change % Change
2021 to 2021 to
2021 2020 2020 2019 2019
Revenue (less agency commissions):
Broadcasting $ 530 $ 515 3% $ 481 10 %
Production companies 14 19 (26)% 37 (62)%
Total revenue $ 544 $ 534 2% $ 518 5%
Political advertising revenue $ 9 $ 36 (75)% $ 3 200 %
Operating expenses (1):
Broadcasting $ 361 $ 335 8% $ 356 1%
Production companies $ 17 $ 19 (11)% $ 35 (51)%
Corporate and administrative $ 18 $ 15 20 % $ 48 (63)%
Net income (loss) $ 39 $ 53 (26)% $ (18) 317 %
Non-GAAP Cash Flow (2):
Broadcast Cash Flow $ 168 $ 181 (7)% $ 123 37 %
Broadcast Cash Flow Less
Cash Corporate Expenses $ 153 $ 168 (9)% $ 78 96 %
Free Cash Flow $ 78 $ 85 (8)% $ 17 359 %
Transaction related expenses inclded in operating expenses (3)
Broadcasting $ - $ - $ 36
Production companies $ - $ - $ -
Corporate and administrative $ 1 $ - $ 32
(1) Excludes depreciation, amortization and (gain) loss on disposal of assets.
(2) See definition of non-GAAP terms and a reconciliation of the non-GAAP amounts to net income included elsewhere herein.
(3) Transaction Related Expenses are incremental expenses incurred specific to acquisitions and divestitures, including but not limited to, legal and professional fees, severance and incentive compensation
and contract termination fees.
16As Reported Year-End
Year Ended December 31,
% Change % Change
2020 to 2020 to
2020 2019 2019 2018 2018
(dollars in millions)
Revenue (less agency commissions):
Broadcasting $ 2,320 $ 2,035 14 % $ 1,084 114 %
Production companies 61 87 (30)% -
Total revenue $ 2,381 $ 2,122 12 % $ 1,084 120 %
Political advertising revenue $ 430 $ 68 532 % $ 155 177 %
Operating expenses (1):
Broadcasting $ 1,340 $ 1,325 1% $ 596 125 %
Production companies $ 52 $ 74 (30)% $ -
Corporate and administrative $ 65 $ 104 (38)% $ 41 59 %
Net income $ 410 $ 179 129 % $ 211 94 %
Non-GAAP Cash Flow (2):
Broadcast Cash Flow $ 999 $ 729 37 % $ 493 103 %
Broadcast Cash Flow Less Cash Corporate Expenses $ 945 $ 636 49 % $ 457 107 %
Free Cash Flow $ 559 $ 273 105 % $ 263 113 %
Transaction related expenses included in operating expenses (3):
Broadcasting $ - $ 45 $ 3
Production companies $ - $ - $ -
Corporate and administrative $ 1 $ 34 $ 8
(1) Excludes depreciation, amortization and (gain) loss on disposal of assets.
(2) See definition of non-GAAP terms and a reconciliation of the non-GAAP amounts to net income included elsewhere herein.
(3) Transaction Related Expenses are incremental expenses incurred specific to acquisitions and divestitures, including but not limited to, legal and professional fees, severance and incentive
compensation and contract termination fees.
17Appendix: Non-GAAP Reconciliations,
Disclaimers, and Definitions
18Non-GAAP Reconciliation
Reconciliation of Non-GAAP terms on As Reported Basis, in millions
Thre e Months Ende d
March 31,
2021 2020 2019
Net income (loss) $ 39 $ 53 $ (18)
Adjustments to reconcile from net income (loss) to
Free Cash Flow:
Depreciation 25 21 20
Amortization of intangible assets 26 26 29
Non-cash stock-based compensation 4 4 3
Non-cash 401(k) expense 1 - -
Gain on disposal of assets, net (4) (6) (10)
Miscellaneous expense (income), net (1) 1 (3)
Interest expense 48 52 58
Income tax expense 15 18 3
Amortization of program broadcast rights 9 9 10
Payments for program broadcast rights (9) (10) (14)
Corporate and administrative expenses before
depreciation, amortization of intangible assets and
non-cash stock-based compensation 15 13 45
Broadcas t Cas h Flow 168 181 123
Corporate and administrative expenses before
depreciation, amortization of intangible assets and
non-cash stock-based compensation (15) (13) (45)
Broadcas t Cas h Flow Le s s Cas h Corporate Expe ns e s 153 168 78
Interest expense (48) (52) (58)
Amortization of deferred financing costs 3 3 3
Preferred stock dividends (13) (13) -
Common stock dividends (8) - -
Purchases of property and equipment (13) (27) (18)
Reimbursements of property and equipment purchases 4 6 12
Fre e Cas h Flow $ 78 $ 85 $ 17
19Non-GAAP Reconciliation
Reconciliation of Non-GAAP terms on As Reported Basis, in millions
Year Ended
December 31,
2020 2019 2018 2017
Net income $ 410 $ 179 $ 211 262
Adjustments to reconcile from net income to
Free Cash Flow:
Dep reciation 96 80 54 52
Amortization of intangible assets 105 115 21 25
Non-cash stock-based comp ensation 16 16 7 8
Gain on disp osal of assets, net (29) (54) (17) (74)
M iscellaneous exp ense (income), net 5 (4) (6) -
Interest exp ense 191 227 107 95
Loss on early extinguishment of debt 12 - - 3
Income tax exp ense 134 76 77 (69)
Amortization of p rogram broadcast rights 38 39 21 21
Non-cash 401(k) exp ense 6 5 4 -
Pay ments for p rogram broadcast rights (39) (43) (22) (21)
Corp orate and administrative exp enses before
dep reciation, amortization of intangible assets and
non-cash stock-based comp ensation 54 93 36 27
Broadcast Cash Flow (1) 999 729 493 329
Corp orate and administrative exp enses before
dep reciation, amortization of intangible assets and
non-cash stock-based comp ensation (54) (93) (36) (27)
Broadcast Cash Flow Less Cash Corporate Expenses (1) 945 636 457 302
Contributions to p ension p lans (3) (3) (2) (3)
Interest exp ense (191) (227) (107) (95)
Amortization of deferred financing costs 11 11 5 4
Preferred stock dividends (52) (52) - -
Purchase of p rop erty and equip ment (110) (110) (70) (35)
Reimbursements of p rop erty and equip ment p urchases 29 41 14 -
Income taxes p aid, net of refunds (70) (23) (34) (2)
Free Cash Flow $ 559 $ 273 $ 263 $ 171
(1) Amounts in 2017 have been reclassified to give effect to the implementation of ASU 2017-07.
20Non-GAAP Reconciliation
Reconciliation of Non-GAAP terms on a Combined Historical Basis, in millions
Year Ended
December 31,
2019 2018 2017
Net income $ 157 $ 288 $ 648
Adjustments to reconcile from net income to
Free Cash Flow:
Dep reciation 81 86 86
Amortization of intangible assets 115 117 124
Non-cash stock-based comp ensation 16 15 14
Gain on disp osal of assets, net (35) (7) (155)
M iscellaneous (income) exp ense, net (3) 4 1
Interest exp ense 227 227 227
Loss from early extinguishment of debt - - 5
Income tax (benefit) exp ense 76 74 (354)
Amortization of p rogram broadcast rights 40 42 41
Common stock contributed to 401(k) p lan
excluding corp orate 401(k) contributions 4 4 -
Pay ments for p rogram broadcast rights (44) (42) (41)
Corp orate and administrative exp enses excluding
dep reciation, amortization of intangible assets and
non-cash stock-based comp ensation 92 72 54
Broadcast Transaction Related Exp enses 45 3 3
Broadcast other adjustments 8 11 13
Broadcast Cash Flow (1) 779 894 666
Corp orate and administrative exp enses excluding
dep reciation, amortization of intangible assets and
non-cash stock-based comp ensation (92) (72) (54)
Broadcast Cash Flow Less Cash Corporate Expenses (1) 687 822 612
Contributions to p ension p lans (3) (2) (3)
Corp orate Transaction Related Exp enses 34 14 1
Sy nergies and other adjustments - 80 80
Operating Cash Flow as Defined in S enior Credit Facility (1) 718 914 690
Interest exp ense (227) (227) (227)
Amortization of deferred financing costs 11 11 11
Preferred dividends (52) (52) (52)
Purchase of p rop erty and equip ment (110) (88) (57)
Reimbursement of p urchases of p rop erty and equip ment 41 14 -
Income taxes p aid, net of refunds (23) (38) (64)
Free Cash Flow $ 358 $ 534 $ 301
(1) Amounts in 2017 have been reclassified to give effect to the implementation of ASU 2017-07. 21Reconciliation of Total Leverage Ratio (in millions)
Eight Quarte rs
Ende d
March 31, 2021
Net income $ 648
Adjustments to reconcile from net income to Operating
Cash Flow as defined in our Senior Credit Agreement:
Depreciation 181
Amortization of intangible assets 218
Non-cash stock-based compensation 32
Gain on disposal of assets, net (77)
Interest expense 408
Loss on early extinguishment of debt 12
Income tax expense 221
Amortization of program broadcast rights 75
Common stock contributed to 401(k) plan 12
Payments for program broadcast rights (81)
Pension benefit (2)
Contributions to pension plans (6)
Adjustments for stations acquired or divested, financings and expected
synergies during the eight quarter period 2
Transaction Related Expenses 15
Ope rating Cas h Flow as de fine d in our Se nior Cre dit Agre e me nt $ 1,658
Ope rating Cas h Flow as de fine d in our Se nior Cre dit Agre e me nt,
divide d by two $ 829
March 31, 2021
Adjus te d Total Inde bte dne s s :
Total outstanding principal, including current portion $ 4,035
Letters of credit outstanding 1
Cash (819)
Adjus te d Total Inde bte dne s s , Ne t of All Cas h $ 3,217
Total Le ve rage Ratio, Ne t of All Cas h 3.88
22Non-GAAP Terms
From time to time, Gray supplements its financial results prepared in accordance with accounting principles generally accepted in the United States of America
(“GAAP”) by disclosing the non-GAAP financial measures Broadcast Cash Flow, Broadcast Cash Flow Less Cash Corporate Expenses, Operating Cash Flow as
defined in Gray’s Senior Credit Agreement, Free Cash Flow and Total Leverage Ratio, Net of All Cash. These non-GAAP amounts are used by us to approximate
the amount used to calculate key financial performance covenants contained in our debt agreements and are used with our GAAP data to evaluate our results
and liquidity. These non-GAAP amounts may be provided on an As-Reported Basis as well as a Combined Historical Basis.
“Broadcast Cash Flow” or “BCF” Net income or loss plus loss from early extinguishment of debt, non-cash corporate and administrative expenses,
non-cash stock based compensation, depreciation and amortization (including amortization of intangible assets and
program broadcast rights), any loss on disposal of assets, any miscellaneous expense, interest expense, any income
tax expense, non-cash 401(k) expense, Broadcast Transactions Related Expenses and broadcast other adjustments
less any gain on disposal of assets, any miscellaneous income, any income tax benefits and payments for program
broadcast rights.
“Broadcast Cash Flow Less Cash Net income or loss plus loss from early extinguishment of debt, non-cash stock based compensation, depreciation
Corporate Expenses” and amortization (including amortization of intangible assets and program broadcast rights), any loss on disposal of
assets, any miscellaneous expense, interest expense, any income tax expense, non-cash 401(k) expense, Broadcast
Transactions Related Expenses and broadcast other adjustments less any gain on disposal of assets, any
miscellaneous income, any income tax benefits and payments for program broadcast rights.
“Free Cash Flow” or “FCF” Net income or loss plus loss from early extinguishment of debt, non-cash stock based compensation, depreciation
and amortization (including amortization of intangible assets and program broadcast rights), any loss on disposal of
assets, any miscellaneous expense, any income tax expense, non-cash 401(k) expense, Broadcast Transactions
Related Expenses, broadcast other adjustments, certain pension expenses, Corporate Transaction Related Expenses,
synergies, other adjustments and amortization of deferred financing costs less any gain on disposal of assets, any
miscellaneous income, any income tax benefits, payments for program broadcast rights, pension income,
contributions to pension plans, preferred dividends, purchase of property and equipment (net of reimbursements)
and income taxes paid (net of any refunds received).
“Operating Cash Flow” or “OCF” Defined in our Senior Credit Agreement as net income or loss plus loss from early extinguishment of debt, non-cash
stock based compensation, depreciation and amortization (including amortization of intangible assets and program
broadcast rights), any loss on disposal of assets, any miscellaneous expense, interest expense, any income tax
expense, non-cash 401(k) expense, Broadcast Transactions Related Expenses, broadcast other adjustments, certain
pension expenses, Corporate Transaction Related Expenses, synergies and other adjustments less any gain on
disposal of assets, any miscellaneous income, any income tax benefits, payments for program broadcast rights,
pension income and contributions to pension plans.
“Total Leverage Ratio, Our Total Leverage Ratio, Net of All Cash is determined by dividing our Adjusted Total Indebtedness, Net of All Cash
Net of All Cash” by our Operating Cash Flow as defined in our Senior Credit Agreement, divided by two. Our Adjusted Total
Indebtedness, Net of All Cash represents the total outstanding principal of our long-term debt, plus certain other
obligations as defined in our Senior Credit Agreement, less all cash (excluding restricted cash). Our Operating Cash
Flow as defined in our Senior Credit Agreement, divided by two, represents our average annual Operating Cash Flow
as defined in our Senior Credit Agreement for the preceding eight quarters.
These non-GAAP terms are not defined in GAAP and our definitions may differ from, and therefore not be comparable to, similarly titled measures used by other
companies, thereby limiting their usefulness. Such terms are used by management in addition to and in conjunction with results presented in accord-ance with
GAAP and should be considered as supplements to, and not as substitutes for, net income and cash flows reported in accordance with GAAP. 23Disclaimers, Definitions,
and Non-GAAP Financial Data
This presentation contains certain forward looking statements that are based largely on Gray Television, Inc.’s (“Gray”, “Gray
Television”, “GTN” or the “Company”) current expectations and reflect various estimates and assumptions by Gray. These statements
may be identified by words such as “estimates”, “expect,” “anticipate,” “will,” “implied,” “assume” and similar expressions. Forward
looking statements are subject to certain risks, trends and uncertainties that could cause actual results and achievements to differ
materially from those expressed in such forward looking statements. Such risks, trends and uncertainties which in some instances are
beyond Gray’s control, include Gray’s inability to complete the integration of our acquisition of Quincy, the inability to achieve
expected synergies therefrom on a timely basis or at all, estimates of future retransmission revenue, future expenses and other
future events. Gray is subject to additional risks and uncertainties described in Gray’s quarterly and annual reports filed with the
Securities and Exchange Commission from time to time, including in the “Risk Factors,” and management’s discussion and analysis of
financial condition and results of operations sections contained therein. Any forward looking statements in this presentation should be
evaluated in light of these important risk factors. This presentation reflects management’s views as of the date hereof. Except to the
extent required by applicable law, Gray undertakes no obligation to update or revise any information contained in this presentation
beyond the published date, whether as a result of new information, future events or otherwise.
Combined Historical Basis reflects financial results that have been compiled by adding Gray’s historical revenue and broadcast
expenses to the historical revenue and broadcast expenses of the stations acquired in the completed transactions and subtracting the
historical revenues and broadcast expenses of stations divested in the completed transactions as if they had been acquired or
divested, respectively, on January 1, 2016 (the beginning of the earliest period presented).
Combined Historical Basis financial information does not include any adjustments for other events attributable to the completed
transactions except “Broadcast Cash Flow,” “Broadcast Cash Flow Less Cash Corporate Expenses,” “Operating Cash Flow,” “Operating
Cash Flow as Defined in the Senior Credit Agreement” and “Total Leverage Ratio, Net of All Cash” each give effect to expected
synergies, and “Free Cash Flow” on a Combined Historical Basis gives effect to the financings and certain expected operating
synergies related to the completed transactions. “Operating Cash Flow,” “Operating Cash Flow as Defined in the Senior Credit
Agreement” and “Total Leverage Ratio, Net of All Cash” on a Combined Historical Basis also reflect the add-back of legal and other
professional fees incurred in completing acquisitions. Certain of the Combined Historical Basis financial information has been derived
from, and adjusted based on, unaudited, unreviewed financial information prepared by other entities, which Gray cannot
independently verify. We cannot assure you that such financial information would not be materially different if such information were
audited or reviewed and no assurances can be provided as to the accuracy of such information, or that our actual results would not
differ materially from the Combined Historical Basis financial information if the completed transactions had been completed at the
stated date. In addition, the presentation of Combined Historical Basis, “Broadcast Cash Flow,” “Broadcast Cash Flow Less Cash
Corporate Expenses,” “Operating Cash Flow,” “Operating Cash Flow as Defined in the Senior Credit Agreement,” “Total Leverage
Ratio, Net of All Cash,” “Free Cash Flow,” and the adjustments to such information, including expected synergies resulting from such
transactions, may not comply with GAAP or the requirements for pro forma financial information under Regulation S-X under the
Securities Act.
24Gray Television, Inc.
4370 Peachtree Rd., NE
Atlanta, Georgia 30319
www.gray.tv
25You can also read