Third quarter 2019 conference call - November 1, 2019 - TC Energy
←
→
Page content transcription
If your browser does not render page correctly, please read the page content below

Third quarter 2019 conference call
November 1, 2019
Forward looking information and non‐GAAP measures
This presentation includes certain forward looking information, including future oriented financial information or financial outlook, which is intended to help
current and potential investors understand management’s assessment of our future plans and financial outlook, and our future prospects overall. Statements
that are forward-looking are based on certain assumptions and on what we know and expect today and generally include words like anticipate, expect, believe,
may, will, should, estimate, intend or other similar words.
Forward-looking statements do not guarantee future performance. Actual events and results could be significantly different because of assumptions, risks or
uncertainties related to our business or events that happen after the date of this presentation. Our forward-looking information in this presentation includes
statements related to future dividend and earnings growth and the future growth of our core businesses, among other things.
Our forward looking information is based on certain key assumptions and is subject to risks and uncertainties, including but not limited to: our ability to
successfully implement our strategic priorities and whether they will yield the expected benefits, our ability to implement a capital allocation strategy aligned
with maximizing shareholder value, the operating performance of our pipeline and power and storage assets, amount of capacity sold and rates achieved in our
pipeline businesses, the amount of capacity payments and revenues from our power generation assets due to plant availability, production levels within supply
basins, construction and completion of capital projects, costs for labour, equipment and materials, the availability and market prices of commodities, access to
capital markets on competitive terms, interest, tax and foreign exchange rates, performance and credit risk of our counterparties, regulatory decisions and
outcomes of legal proceedings, including arbitration and insurance claims, changes in environmental and other laws and regulations, our ability to effectively
anticipate and assess changes to government policies and regulations, competition in the pipeline, power and storage sectors, unexpected or unusual weather,
acts of civil disobedience, cyber security and technological developments, and economic conditions in North America as well as globally. You can read more
about these risks and others in our October 31, 2019 Quarterly Report to Shareholders and 2018 Annual Report filed with Canadian securities regulators and
the SEC and available at www.tcenergy.com.
As actual results could vary significantly from the forward-looking information, you should not put undue reliance on forward-looking information and should not
use future-oriented information or financial outlooks for anything other than their intended purpose. We do not update our forward-looking statements due to
new information or future events, unless we are required to by law.
This presentation contains reference to certain financial measures (non-GAAP measures) that do not have any standardized meaning as prescribed by U.S.
generally accepted accounting principles (GAAP) and therefore may not be comparable to similar measures presented by other entities. These non-GAAP
measures may include Comparable Earnings, Comparable Earnings per Common Share, Comparable Earnings Before Interest, Taxes, Depreciation and
Amortization (Comparable EBITDA), Funds Generated from Operations, Comparable Funds Generated from Operations, Comparable Distributable Cash Flow
(DCF) and Comparable DCF per Common Share. Reconciliations to the most directly comparable GAAP measures are included in this presentation and in our
October 31, 2019 Quarterly Report to Shareholders filed with Canadian securities regulators and the SEC and available at www.tcenergy.com.

                                                                                                                                                                    2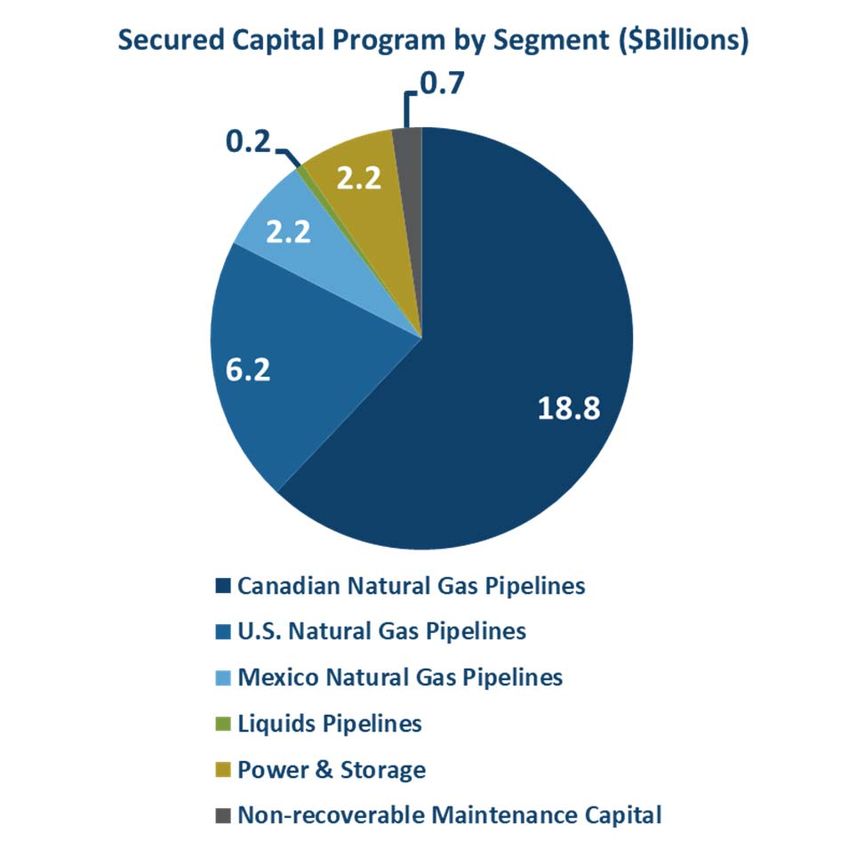
Russ Girling
President & CEO

                   3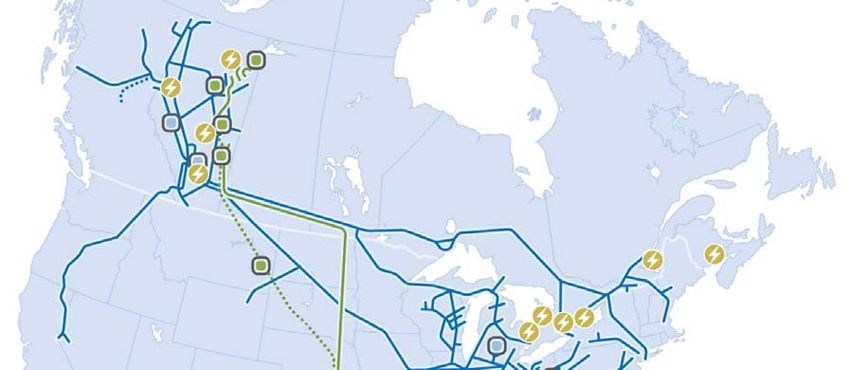
Third quarter 2019 accomplishments
Generated strong financial results
  • Comparable earnings were $1.04 per common share
  • Comparable funds generated from operations of $1.8 billion
Advanced $30 billion secured capital program
  • Placed ~$8.2 billion of projects into service through the first nine months of 2019
  • Approximately $2.5 billion of additional projects expected to be complete by end of year
Progressed $20+ billion of projects under development
  • Received Draft Supplemental Environmental Impact Statement (DSEIS) for Keystone XL
  • Continued to advance Bruce Power life extension program
Positioned to fund secured capital program without any additional common equity
  • Expect $6.3 billion from sale of Coolidge, Northern Courier, Columbia Midstream and Ontario natural gas‐fired power plants
  • Discontinued practice of issuing common shares from treasury to satisfy purchases under Dividend Reinvestment Plan (DRP)
Strong performance expected to continue
   • 2019 comparable earnings per share expected to be higher than 2018
   • Financial position remains solid, well positioned to fund secured capital program and achieve targeted credit metrics

                       High‐quality, diversified asset portfolio continues to benefit
                                 from supportive market fundamentals
                                                                                                                                 4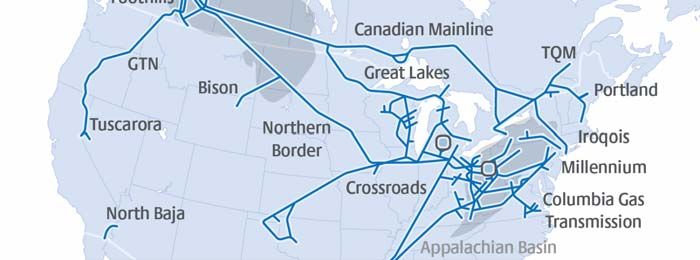
Financial highlights – Three months ended September 30 (Non‐GAAP)
                        Comparable                                                                              Comparable                                                             Comparable funds
                earnings per common share*                                                                        EBITDA*                                                          generated from operations*
                          (Dollars)                                                                              ($Millions)                                                               ($Millions)

                               4% increase                                                                     14% increase                                                                     15% increase

*Comparable Earnings per Common Share, Comparable EBITDA and Comparable Funds Generated from Operations are non-GAAP measures. See the forward looking information and non-GAAP measures slide at the front of this presentation for more
information.                                                                                                                                                                                                                                5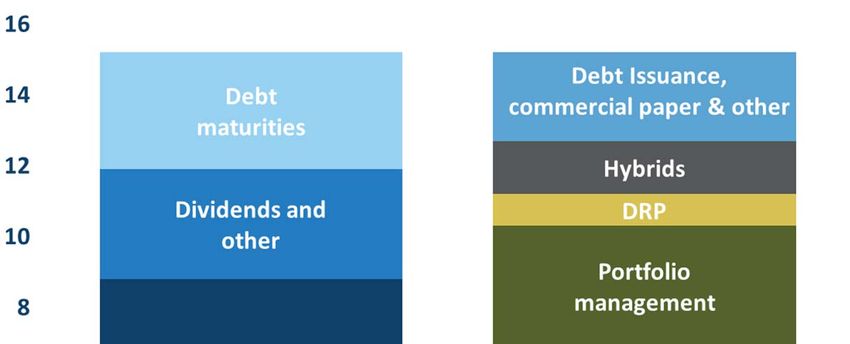
Financial highlights – Nine months ended September 30 (Non‐GAAP)
                        Comparable                                                                              Comparable                                                             Comparable funds
                earnings per common share*                                                                        EBITDA*                                                          generated from operations*
                          (Dollars)                                                                              ($Millions)                                                               ($Millions)

                              10% increase                                                                     15% increase                                                                     14% increase

*Comparable Earnings per Common Share, Comparable EBITDA and Comparable Funds Generated from Operations are non-GAAP measures. See the forward looking information and non-GAAP measures slide at the front of this presentation for more
information.                                                                                                                                                                                                                                6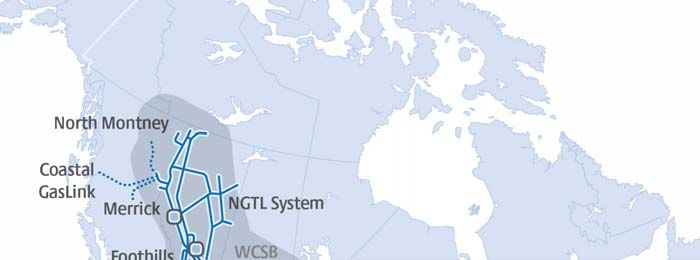
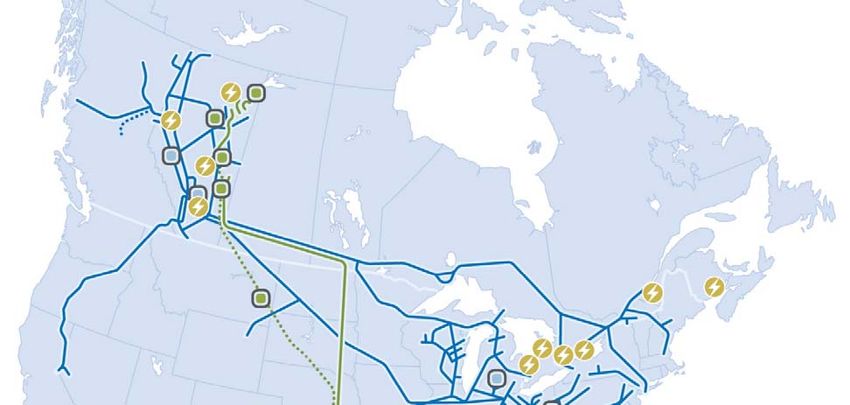
Natural Gas Pipelines recent developments
Canadian Natural Gas Pipelines
 • Announced $1.2 billion West Path Delivery Program
 • Now advancing $10 billion NGTL System expansion program that will
   add 3.5 Bcf/d of delivery capacity
 • Construction continues on the $6.6 billion Coastal GasLink project that
   will have an initial capacity of 2.1 Bcf/d
U.S. Natural Gas Pipelines
 • Initiated US$0.3 billion GTN XPress project
 • Now advancing US$1.5 billion of capacity additions that also includes
     East Lateral XPress, Louisiana XPress and Grand Chenier XPress
Mexico Natural Gas Pipelines
• Sur de Texas pipeline began commercial operations in September
   following execution of amending agreement with CFE
• Phased in‐service of Villa de Reyes expected to commence in early 2020
• Construction of the central segment of Tula is dependent on the timing
   of successful Indigenous negotiations

  Premier system connects prolific gas supplies
            to high growth markets
                                                                             7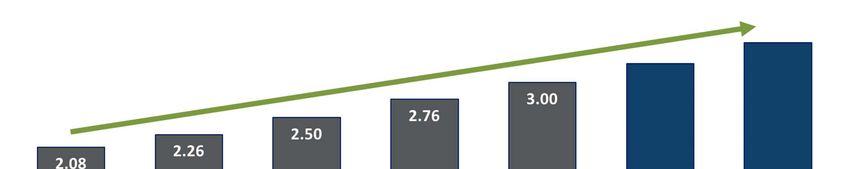
Liquids Pipelines recent developments
•   Assets continue to produce strong operating results
•   Completed the sale of 85 per cent equity interest in Northern Courier
•   Keystone XL continues to advance
      • Received new Presidential Permit in March which supersedes the
         2017 permit
      • Nebraska Supreme Court affirmed Nebraska Public Service
         Commission’s route approval in August
      • Draft SEIS issued by U.S. Department of State in October
      • The SEIS is expected to be issued by the end of 2019

           Contiguous path from supply to market
                                                                            8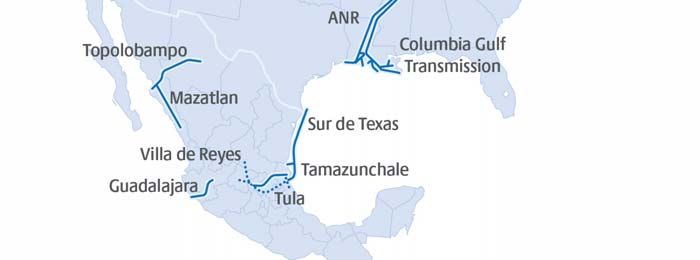
Power and Storage recent developments
•   Ontario natural gas‐fired power plants
     • $2.87 billion asset sale expected to close by the end of first
         quarter 2020
•   Bruce Power
      • Unit 6 Major Component Replacement expected to begin in
         early 2020
      • Power price increased to ~$78 per MWh on April 1, 2019 to
         reflect $2.2 billion investment in project and ongoing asset
         management program
•   Combined generating capacity of ~4,200 megawatts following sale
    of Ontario natural gas‐fired plants
•   Continue to pursue new low‐risk investment opportunities within
    our core North American markets

    ~95% of generating capacity underpinned by
               long‐term contracts
                                                                        9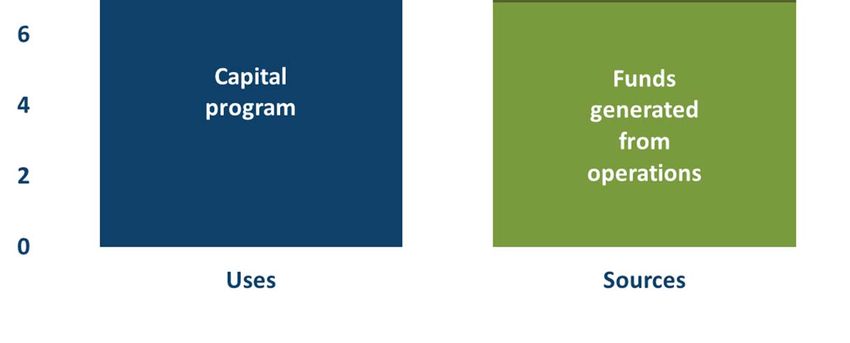
Advancing $30 billion secured capital program through 2023
                                                                  Estimated Capital                                        Invested to                Expected
                                              Project
                                                                       Cost*                                                  Date*               In‐Service Date*
             NGTL System                                                       2.5                                                   2.4                2019
             Modernization II                                               US 1.1                                               US 0.7              2019‐2020
             Villa de Reyes                                                 US 0.9                                               US 0.7                 2020
             NGTL System                                                       2.1                                                   0.8                2020
             Other Liquids Pipelines                                           0.1                                                     ‐                2020
             Canadian Natural Gas Pipelines Regulated Maintenance              1.8                                                   0.4             2019‐2021
             U.S. Natural Gas Pipelines Regulated Maintenance               US 2.1                                               US 0.4              2019‐2021
             Liquids Pipelines Recoverable Maintenance                         0.1                                                     ‐             2019‐2021
             Non‐recoverable Maintenance                                       0.7                                                   0.2             2019‐2021
             NGTL System                                                       2.6                                                   0.1                2021
             Other U.S. Natural Gas Pipelines                               US 1.5                                               US 0.1              2019‐2022
             Canadian Mainline                                                 0.4                                                   0.1             2019‐2022
             Bruce Power Life Extension**                                      2.2                                                   0.9             2019‐2023
             NGTL System                                                       2.8                                                     ‐               2022+
             Coastal GasLink                                                   6.6                                                   0.8                2023
             Tula                                                           US 0.8                                               US 0.6                   ‐
             Foreign Exchange Impact (1.32 exchange rate)                      2.0                                                   0.8                  ‐
             Total Canadian Equivalent                                                                         30.3                      9.0

                       ~$2.5 billion of NGTL expansion facilities expected to be completed by year end
* Billions of dollars. Certain projects are subject to various conditions including corporate and regulatory approvals. ** Our proportionate share.                  10
Dividend growth outlook
Annual growth of 8 to 10 per cent through 2021
Supported by expected growth in earnings and cash flow
and continued strong coverage ratios
11Key takeaways
Proven strategy – Low risk business model
• ~95% of comparable EBITDA from regulated assets or long‐term contracts
Business continued to produce strong results in third quarter 2019
• Demand for our services has never been greater
Visible growth
• Advancing $30 billion of secured growth projects
• $20+ billion of projects under development
• Additional organic growth expected from existing businesses
Dividend poised to grow
• Increased by 8.7 per cent in February 2019 to $3.00 per share on an
annualized basis
• Expect annual growth of 8 to 10 per cent through 2021
Financial strength and flexibility
• Recent portfolio management activities expected to generate $6.3 billion
• On track to achieve targeted credit metrics without the need for any
additional common equity under DRP
Delivered 14% annual total shareholder return since 2000
12Don Marchand
Executive VP & CFO
13Consolidated results of operations
(millions of dollars, except per share amounts)
Three months ended September 30 Nine months ended September 30
2019 2018 2019 2018
Net Income Attributable to Common Shares 739 928 2,868 2,447
Specific items (net of tax):
Loss on sale of Columbia Midstream assets 133 ‐ 133 ‐
Loss on Ontario natural gas‐fired power plants held for sale 133 ‐ 133 ‐
Gain on partial sale of Northern Courier (115) ‐ (115) ‐
Gain on sale of Coolidge generating station ‐ ‐ (54) ‐
Alberta corporate income tax rate reduction ‐ ‐ (32) ‐
U.S. Northeast power marketing contracts ‐ (8) 6 (3)
Risk management activities 80 (18) (58) 90
Comparable Earnings(1) 970 902 2,881 2,534
Net Income Per Common Share $0.79 $1.02 $3.09 $2.72
Specific items (net of tax):
Loss on sale of Columbia Midstream assets 0.14 ‐ 0.14 ‐
Loss on Ontario natural gas‐fired power plants held for sale 0.14 ‐ 0.14 ‐
Gain on partial sale of Northern Courier (0.12) ‐ (0.12) ‐
Gain on sale of Coolidge generating station ‐ ‐ (0.06) ‐
Alberta corporate income tax rate reduction ‐ ‐ (0.03) ‐
U.S. Northeast power marketing contracts ‐ (0.01) 0.01 ‐
Risk management activities 0.09 (0.01) (0.06) 0.10
Comparable Earnings Per Common Share(1) $1.04 $1.00 $3.11 $2.82
Weighted Average Basic Common Shares Outstanding (millions) 932 906 927 898
(1) Non-GAAP measure and excludes specific items. See the forward looking information and non-GAAP measures slide at the front of this presentation for more information. 14Business segment results(1)
(millions of dollars)
Three months Nine months
ended September 30 ended September 30
2019 2018 2019 2018
Comparable EBITDA(2)
Canadian Natural Gas Pipelines 572 522 1,656 1,561
U.S. Natural Gas Pipelines 796 715 2,625 2,223
Mexico Natural Gas Pipelines 153 153 440 455
Liquids Pipelines 575 467 1,720 1,311
Power and Storage 252 207 622 585
Corporate (4) (8) (12) (25)
Total 2,344 2,056 7,051 6,110
Third quarter 2019 Comparable EBITDA increased $288 million versus the same period in 2018. Principal variances included:
• Canadian Natural Gas Pipelines – Higher mainly due to increased depreciation on the Canadian Mainline
• U.S. Natural Gas Pipelines – Higher primarily due to Columbia growth projects placed in service, partially offset by decreased earnings from
Bison and from the sale of certain Columbia Midstream assets
• Liquids Pipelines – Higher mainly due to greater volumes on the Keystone Pipeline System and increased earnings from liquids marketing
activities, partially offset by the sale of an 85 per cent interest in Northern Courier
• Power and Storage – Higher primarily due to an increase in the realized power price and output at Bruce Power, partially offset by the sale of
our interests in the Cartier Wind power facilities and the Coolidge generating station
(1) For more information see the October 31, 2019 Quarterly Report to Shareholders; (2) Non-GAAP measure and excludes specific items. See the forward looking information and non-GAAP measures slide at the front of this presentation for more information. 15Other income statement items(1)
(millions of dollars)
Three months Nine months
ended September 30 ended September 30
2019 2018 2019 2018
Comparable EBITDA(2) 2,344 2,056 7,051 6,110
Depreciation and amortization (610) (564) (1,839) (1,669)
Comparable EBIT(2) 1,734 1,492 5,212 4,441
Interest expense (573) (577) (1,747) (1,662)
Allowance for funds used during construction 120 147 358 365
Interest income and other(3) 49 48 85 166
Income tax expense(3) (260) (108) (687) (425)
Net income attributable to non‐controlling interests (59) (59) (217) (229)
Preferred share dividends (41) (41) (123) (122)
Comparable Earnings(2) 970 902 2,881 2,534
Principal variances between third quarter 2019 and the same period in 2018 included:
• Depreciation and amortization – Higher due to increased depreciation in the Canadian Natural Gas Pipelines segment, which is fully
recovered in tolls, and also due to new projects placed into service
• AFUDC – Lower due to Columbia Gas and Columbia Gulf growth projects placed in service, partially offset by investment in the NGTL System
and Mexico projects
• Income tax expense(3) ‐ Higher due to increased comparable earnings before income taxes and lower foreign tax rate differentials, partially
offset by lower flow‐through income taxes on Canadian rate‐regulated pipelines
(1) For more information see the October 31, 2019 Quarterly Report to Shareholders; (2) Non-GAAP measures and excludes specific items. See the forward looking information and non-GAAP measures slide at the front of this presentation for more
information; (3) Excludes specific items to arrive at comparable earnings. 16Comparable distributable cash flow
(millions of dollars, except per share amounts)
Three months Nine months
ended September 30 ended September 30
2019 2018 2019 2018
Comparable Funds Generated From Operations(1) 1,802 1,571 5,292 4,641
Dividends on preferred shares (40) (40) (120) (118)
Distributions paid to non‐controlling interests (50) (57) (164) (174)
Non‐recoverable maintenance capital expenditures(2) (55) (61) (178) (191)
Comparable Distributable Cash Flow(1) 1,657 1,413 4,830 4,158
Comparable Distributable Cash Flow Per Common Share(1) $1.78 $1.56 $5.21 $4.63
Dividends Declared per Common Share $0.75 $0.69 $2.25 $2.07
Coverage Ratio 2.4x 2.3x 2.3x 2.2x
(1) Non-GAAP measure. See the forward looking information and non-GAAP measures slide at the front of this presentation for more information.
(2) Includes non-recoverable maintenance capital expenditures from all segments including cash contributions to fund our proportionate share of maintenance capital expenditures for our equity investments which are primarily related to Bruce Power. 17Funding program continued to advance in third quarter
Strong, predictable and growing cash flow from operations
• Comparable funds generated from operations of $1.8 billion in the quarter
Accessed capital markets on compelling terms
• Issued US$1.1 billion of 60‐year hybrid securities at a rate of 5.50 per cent and $1.0 billion of 10‐ and 30‐year
medium‐term notes at fixed rates of 3.00 per cent and 4.18 per cent, respectively
Realized $2.85 billion of aggregate proceeds from portfolio management activities
• Closed the partial monetization of Northern Courier in July 2019 for total gross proceeds of $1.15 billion
• Closed the sale of certain Columbia Midstream assets for US$1.3 billion (~$1.7 billion Canadian) in August 2019
• Additional $2.9 billion to be realized from sale of Ontario gas‐fired power plants in first quarter 2020
Discontinued issuance of common shares from treasury under DRP commencing with dividends declared October 31, 2019
Significant steps taken to fund capital program, strengthen the balance sheet,
achieve targeted credit metrics and eliminate share count growth
182019 Funding program complete
$Billions
• $7.8 billion raised in 2019 through an
array of attractive funding options
• $3.4 billion from monetization of Coolidge,
Northern Courier and certain Columbia
Midstream assets
• Additional $2.9 billion to be realized on
sale of Ontario gas‐fired power plants in
first quarter 2020
• $3.5 billion of senior debt and hybrid
capital raised in Canadian and U.S. markets
• ~$925 million of proceeds from Dividend
Reinvestment Plan (DRP)
• DRP from treasury ceased
2019 financing requirements in place
Moving back to historical self‐funding model
19Delivering long‐term shareholder value
Track Visible Attractive, growing Strong
record growth dividend financial position
14% average annual $30 billion secured Dividend raised 8.7% Numerous levers
total shareholder through 2023 in February 2019 available to fund
return since 2000 4.5% yield future growth
Advancing
$20+ billion of 8‐10% expected CAGR Simple,
through 2021 understandable
additional projects in corporate structure
development
Proven resilience through all points of the business cycle 20Question & answer period
21Third quarter 2019 conference call November 1, 2019
Appendix – Reconciliation of non‐GAAP measures
       (millions of dollars)
                                                                                                                                          Three months                     Nine months
                                                                                                                                       ended September 30               ended September 30
                                                                                                                                           2019     2018                    2019     2018

                                        Comparable EBITDA(1)                                                                                 2,344             2,056       7,051     6,110
                                         Depreciation and amortization                                                                        (610)             (564)     (1,839)   (1,669)
                                         Interest expense                                                                                     (573)             (577)     (1,747)   (1,662)
                                         Allowance for funds used during construction                                                          120               147         358       365
                                         Interest income and other included in comparable earnings                                              49                48          85       166
                                         Income tax expense included in comparable earnings                                                   (260)             (108)       (687)     (425)
                                         Net income attributable to non‐controlling interests                                                  (59)              (59)       (217)     (229)
                                         Preferred share dividends                                                                             (41)              (41)       (123)     (122)
                                        Comparable Earnings(1)                                                                                 970               902       2,881     2,534
                                        Specific items (net of tax):
                                         Loss on sale of Columbia Midstream assets                                                             (133)              ‐         (133)        ‐
                                         Loss on Ontario natural gas‐fired power plants held for sale                                          (133)              ‐         (133)        ‐
                                         Gain on partial sale of Northern Courier                                                               115               ‐          115         ‐
                                         Gain on sale of Coolidge generating station                                                              ‐               ‐           54         ‐
                                         Alberta corporate income tax rate reduction                                                              ‐               ‐           32         ‐
                                         U.S. Northeast power marketing contracts                                                                 ‐               8           (6)        3
                                         Risk management activities                                                                             (80)             18           58       (90)
                                        Net Income Attributable to Common Shares                                                                739             928        2,868     2,447

(1) Comparable EBITDA and Comparable earnings are non-GAAP measures. See the non-GAAP measures slide at the front of this presentation for more information.
Appendix – Reconciliation of non‐GAAP measures continued
(millions of dollars)
Three months Nine months
ended September 30 ended September 30
2019 2018 2019 2018
Net Cash Provided by Operations 1,585 1,299 5,256 4,516
(Decrease)/increase in operating working capital (140) 284 (329) 130
Funds Generated from Operations(1) 1,445 1,583 4,927 4,646
Specific items:
Current income tax expense on sale of Columbia Midstream assets 357 ‐ 357 ‐
U.S. Northeast power marketing contracts ‐ (12) 8 (5)
Comparable Funds Generated from Operations(1) 1,802 1,571 5,292 4,461
(1) Funds generated from operations and comparable funds generated from operations are non-GAAP measures. See the non-GAAP measures slide at the front of this presentation for more information.You can also read