CORPORATE INFORMATION - 2018 FRAC-SAND AND INDUSTRIAL SANDS - AMI Silica
←
→
Page content transcription
If your browser does not render page correctly, please read the page content below

FRAC-SAND AND INDUSTRIAL SANDS

  CORPORATE INFORMATION
          2018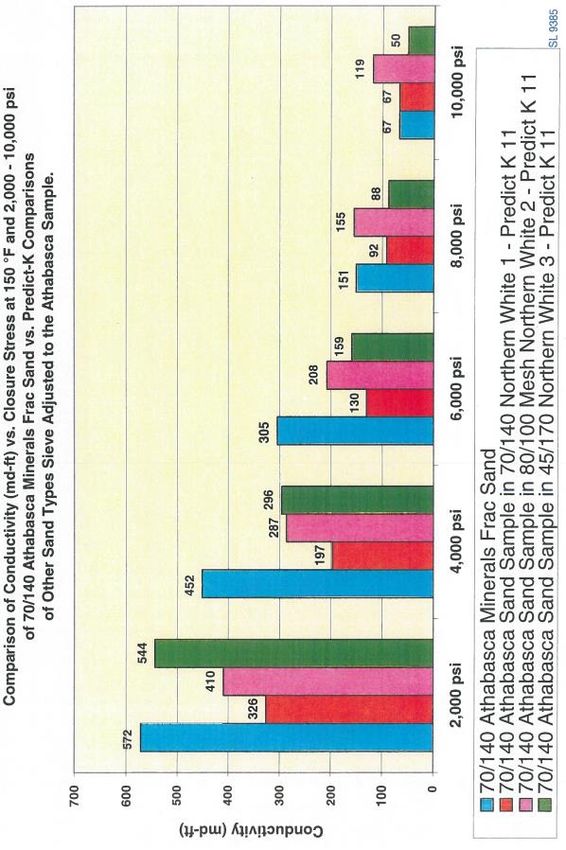
Disclaimer and Confidentiality
    This presentation contains certain forward-looking statements and forward-looking information (collectively referred to in this presentation as “forward-
    looking information”) within the meaning of applicable Canadian securities laws. All statements other than statements of present or historical fact is
    forward-looking information. In particular, but without limiting the foregoing, this presentation contains forward-looking information pertaining to the
    following: Supply of Frac Sand & Projections, AMI Silica Inc. and the Firebag Frac Sand project.
    In addition to the assumptions contained within the body of this presentation, the forward-looking information in this presentation is based on certain
    key expectations and assumptions of AMI including: growth for frac-sand markets, ability to successfully integrate initiatives with material contracts, and
    no material adverse changes to the business of AMI. Although management of AMI consider these assumptions to be reasonable based on information
    currently available to them, these assumptions may prove to be incorrect.
    Forward looking information is subject to known and unknown risks, uncertainties and other factors that may cause the actual results, level of activity,
    performance or achievements of AMI to be materially different from those expressed or implied by such forward-looking information. Such risks and
    other factors may include, but are not limited to: general business, economic, competitive, political and social uncertainties; general capital market
    conditions and market prices for securities; commodity pricing risk including pricing for silica sand and other aggregates; resources may not have the
    quality of quantity that management anticipates; changes in reclamation obligations estimates; delay or failure to receive board or regulatory approvals;
    the actual results of future development or operations; competition; changes in project parameters as plans continue to be refined; accidents and other
    risks inherent in the aggregates and construction industries; lack of insurance; changes in legislation, including environmental legislation, affecting AMI;
    the timing and availability of external financing on acceptable terms; and the lack of qualified, skilled labour or loss of key individuals. A description of
    additional assumptions used to develop such forward-looking information and a description of additional risk factors that may cause actual results to
    differ materially from forward-looking information can be found in AMI’s disclosure documents on the SEDAR website at www.sedar.com. Although AMI
    has attempted to identify important factors that could cause actual results to differ materially from those contained in forward-looking information, there
    may be other factors that cause results not to be as anticipated, estimated or intended. Readers are cautioned that the foregoing list of factors is not
    exhaustive. As such, readers are further cautioned not to place undue reliance on forward-looking information as there can be no assurance that the
    plans, intentions or expectations upon which they are placed will occur.
    Forward-looking information contained in this presentation is expressly qualified by this cautionary statement. The forward-looking information
    contained in this presentation represents the expectations of AMI as of the date of this presentation and, accordingly, is subject to change after such
    date. However, AMI expressly disclaims any intention of obligation to update or revise any forward-looking information, whether as a result of new
    information, future events or otherwise, except as expressly required by applicable securities law.
    AMI disclosed a National Instrument 43-101 Technical Report (“Firebag Resource Report”) for the Firebag Frac-Sand Project in September 2014. A full
    copy of the Firebag Resouce Report can be viewed on SEDAR and on the Corporation’s website.

2   2018-09-13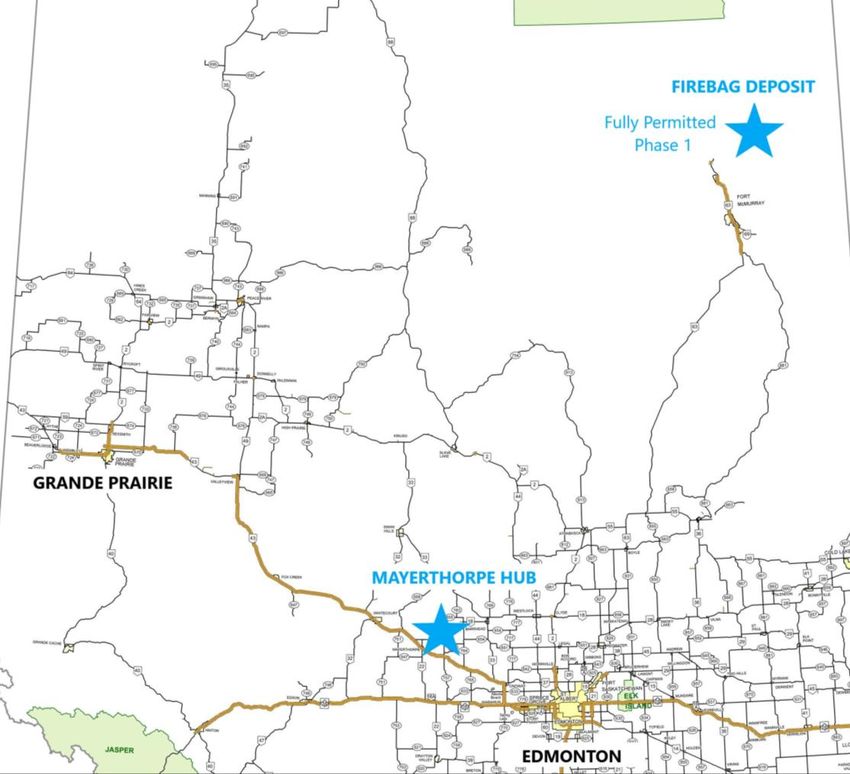
Outline
    1.     BUSINESS OVERVIEW
    2.     MARKET OVERVIEW
    3.     MONETIZING FIREBAG DEPOSIT
    4.     EXECUTION PLAN

3   2018-09-13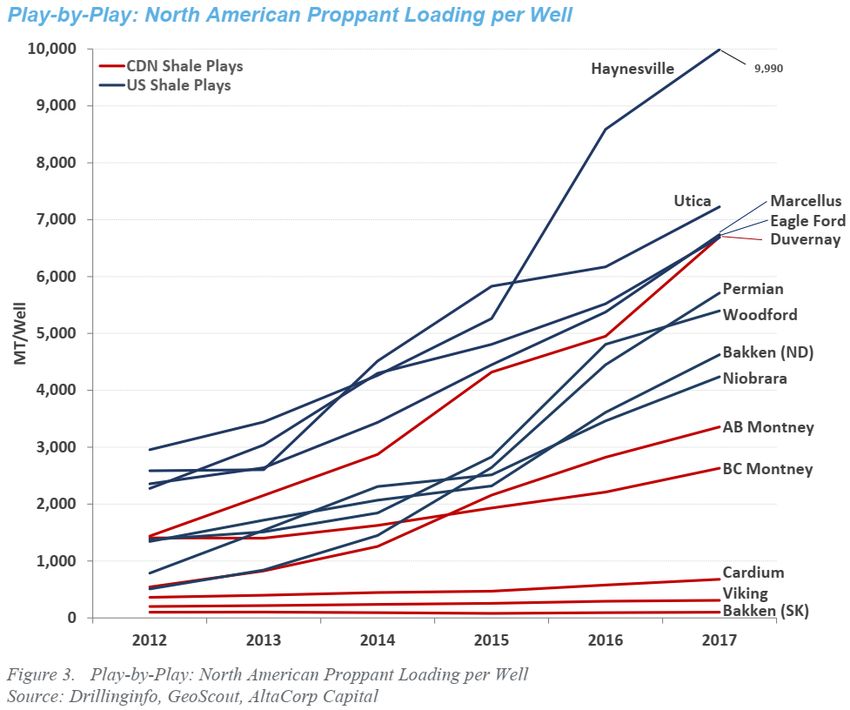
1. Business Overview

4   2018-09-13
1. Business Overview
                                                      Aggregates Management Inc

                       P&L Division               P&L Division                            P&L Division

                 Athabasca Minerals              AMI Silica                        Aggregates Marketing          Future Divisions
                 www.athabascaminerals.com     www.amisilica.com                   www.aggregatesmarketing.com
                                                                                                                      Athabasca
                                                                                                                    Environmental
                                               Enterprise Venture                      Buyers & Suppliers
                      Base Aggregates
                        Production
                                               350k MT/yr Phase 1                         Transport Co.            AMI Trucking &
                                                                                                                     Logistics

                                                Phased Expansion                        Pit Mgmt Services
                  Athabasca Minerals Pits
                        (Owned)                                                                                   AMI Paving & Road
                                             Storage and Distribution                   Equipment Sales                Building

                                                    Phase 2                               Phase-2 (Adv.
                       M&A Target-1
                                                 (1 million T/yr)                        Tech Platform)

                                                              Acquire additional             Introduce
                        M&A Target-2                              deposits                Blockchain and
                                                                                          Smart Contracts
                                                 3rd Party Sources
5   2018-09-13                                    - Marketing &
                                                    Distribution
1. Business Overview (contd.)
www.AMISilica.com
A WHOLLY OWNED SUBSIDIARY OF ATHABASCA MINERALS INC.
6 2018-09-131. Business Overview (contd.)
Key Strategies for AMI Silica
1. Become a midstream service
provider and supplier of Silica-Sand
A. Sources include premium Firebag
deposit (Athabasca Minerals Inc.)
B. Additional sand deposit under due-
diligence near Montney/Duvernay
C. 3rd party sources of sand will be
marketed to develop a comprehensive
offering at strategic hub (future)
7 2018-09-131. Business Overview (contd.)
Key Strategies for AMI Silica
2. Strategically locate all facilities,
starting with the processing, storage
and distribution hub located in the
active Duvernay formation
• Site is accessible by rail (CN)
8 2018-09-131. Business Overview (contd.)
Key Strategies for AMI Silica
3. Vertical Integration
A. Trucking division being developed in partnership
with existing sand-trucking company
B. Last-mile hauling options and well-site solutions
to bring added value to clients
C. Integral truck trans-load facility at our Hub
Industrial Use
7%
10%
Frac-Sand 4. 100% of produced sand is sold into either Frac-Sand or
83%
Construction
Industrial Sands markets (Zero-Waste)
/ Other
9 2018-09-131. Business Overview (contd.)
The Four Key Strategies allow AMI Silica to provide added value to its customers, with each
strategy providing a subsequent positive benefit for our clients.
1. Midstream Model:
A. This strategy enables us to provide multiple options for sand, based on our customers’ quality
requirements (ie premium domestic - Firebag or Tier-2 domestic)
B. We will develop additional deposits in Montney and Duvernay regions to provide better logistics
solutions for our clients in the area
2. Strategic Hub:
A. Having a processing hub in the heart of Duvernay integrates into our midstream model, allowing
us to bring additional deposits into a central, well-located hub.
B. This strategic hub has rail-access (CN line) and existing utilities within an industrial designation
in the Town of Mayerthorpe, reducing our operations cost and retaining flexibility in future
execution models
C. Strategic location, integrated with Strategy #3, Vertical Integration, also allows us to reach the
key activity areas in Duvernay, Deep Basin and Montney formations
10 2018-09-131. Business Overview (contd.)
3. Vertical Integration:
A. We will integrate a trucking operation, in partnership with an existing logistics operator,
that will allow us to reduce our cost and have greater control over the dedicated fleet,
reducing the risk of delays or demurrage costs to our clients (the in-basin model)
B. An integrated trucking operation also allows us to reach into the Montney without
requiring a rail operation in Year-1 at very competitive prices, while still retaining the
flexibility of a trucking model and lower costs associated with rubber transloads
C. We will develop a last-mile and well-site solution that works with our existing customers’
execution plan, whether it be on-site silo storage or sand containers.
4. Zero-waste:
A. By marketing all of our sand in the frac-sand (>90%) and industrial markets (up to 10%), we
will not only reduce our cost but also reduce risks associated with transporting raw sand
from mine(s) to our central hub
11 2018-09-131. Business Overview (contd.)
We will deliver value to our clients by building a flexible, low-cost
execution model while placing emphasis on relationships over profits
(The AMI approach)
12 2018-09-132. Market Overview 13 2018-09-13
2. Market Overview
     A. Canadian Demand
           I.     6.5 million metric tonnes (MT) in 2018
                  (forecast)
           II.   Expected to grow to over 8.0 million MT
                 by 2020 (Average CAGR of 20%)
           III. Major Plays
                i.   Duvernay Intensity: 8,900 MT/well
                     2018 Forecast: 1.3 million MT
                ii. Montney Intensity: 2,900 MT/well
                     2018 forecast 3.6 million MT
                iii. Deep Basin intensity: 1,000 MT/well
                     2018 Forecast: 0.7 million MT

14   2018-09-13
2. Market Overview (contd.)
A. Canadian Demand
IV. Proppant Intensity expected to increase to
match US Shale Plays (6,000 MT/well average)
15 2018-09-132. Market (contd.)
Annual Sand Supply (000's MT) Annual Sand Supply (000's MT)
1,000, 12%
Premium Domestic
1,800, 32%
Domestic
Imported
Domestic
Imported
3,800, 48%
3,800, 68%
3,200, 40%
Current State (2017)
Sand Source Annual Canadian Forecast (MT/yr)
2017 (est) 2019+ (F)
Domestic 1,800,000 3,200,000 Future State (2019+)
Premium Domestic (AMI Silica) Nil Up to 1,000,000
• Increasing market demand could support up to 1 million MT/yr of
Northern White 3,800,000 3,800,000 premium domestic (e.g. AMI’s Firebag sand deposit qualifies)
TOTAL 5,600,000 8,000,000 • Market demand will support the entry of ‘AMI Silica Inc’ premium
domestic sand
16 2018-09-132. Market (contd.)
C. Market Price
I. CAD $140 / MT + in Fox Creek for Wisconsin Northern White (40/70)
II. CAD $120 - $130 / MT in Fox Creek for Domestic (40/70) after transload
i. Typical discount of ~$10 - $20 / MT relative to Northern White
ii. Domestic 40/70 FOB Fox Creek price (after transload) is $130 / MT as of June 2018
17 2018-09-132. Market (contd.)
D. Imported Sand Economics
I. Northern White sand break-even cost is CAD $100 - $133 / MT + in Fox Creek area at
transload facilities
WISCONSIN SAND IMPORTS
$89-$106
Unloading Cost
$6 CAD/mt - $12 CAD/mt
$95-$118 $21-$31
SG&A, Interest, Depreciation]
~$5 - ~$15 CAD/mt WISCONSIN
Loading Cost: $6 CAD/mt
Break-even $100-$133 Processing Cost: $15-$25 CAD/mt
18 2018-09-133. Monetizing Firebag Deposit 19 2018-09-13
3. Monetizing Firebag Deposit
                                                                     Firebag
     • Premium Domestic                                              Mine Site

       Frac-Sand (between                                                                                     Not to Scale

       Tier 1 and Tier 2)                                                          Stockpile
                                                                                                Processing
                                                                                 (year-round

     • 45,000,000 MT of
                                                                                    access)    Plant Option

       inferred resource
       (NI 43-101)
     • Minimal overburden
       allowing open-pit
       style excavation       Demand in 200km radius
                                                                                                                   Size Fraction    AMI Deposit (MT)   Percentage
                                                                                                                             +20        419,000          0.9%
                              Duvernay Play (emerging)                                                                   20/40         4,402,000         9.7%
                            2018E Demand: 1.3 million M
                                                               Processing,                                               40/70        21,231,000         46.8%
                             Average utilization per well     Storage and
                               2017E 8,000 mt /well         Distribution Hub                                            70/140        16,244,000         35.8%
                                                            Mayerthorpe                                                      -140      3,027,000         6.8%
                                    Deep Basin
                            2018E Demand: 0.7 million MT

20   2018-09-13
3. Monetizing Firebag Deposit (contd.)
Processing, Distribution and
Storage Hub at Mayerthorpe, AB
(Industrial zoned lot under LOI,
Development Permit applications
starting)
STRATEGICALLY
LOCATED AMI HUB
⚫
Mayerthorpe
Within 1.5 hours trucking distance of
active drilling areas
21 2018-09-133. Monetizing Firebag Deposit (contd.)
Re-use and Repurpose of Sand By-Products (“Zero-Waste Sand Operation”)
• Firebag Venture will meet AMI Silica’s objective of Zero-Waste. Firebag deposit will
consist of:
• Frac-Sand (83%)
• Composition allows for more
than one product type
• Frac-Sand & Industrial Use (10%) 7%
• 20/40 Frac-Sand
Industrial Use
• Concrete-related 10% Frac-Sand
• Sandblasting 83% Construction / Other
• Construction / Other (7%)
• Water Treatment / Sand Filters
• Golf-Courses
• Bedding Sand
100% of sand by-product is re-purposed
22 2018-09-133. Monetizing Firebag Deposit (contd.)
Market Differentiators for Firebag
• Premium domestic Frac-Sand (lab test results compare well with Tier-1 and Tier-2
properties)
• Strategically located processing, storage and distribution hub in Mayerthorpe
• Industrial zoned lot for processing plant with unrestricted highway access (full-
load, year-round), minimal site-work needed
• Fully permitted to start mining operations (Phase 1)
• Premium domestic frac-sand and high-quality industrial sand
• Low-cost trucking partnership to optimize supply-chain
• 100% of product is marketed and sold
23 2018-09-133. Monetizing Firebag Deposit (contd.)
StimLab Results (Q1 2015) PREMIUM DOMESTIC
Grade Roundness Sphericity K-Value
20/40 0.7 0.7 5K
30/50 0.7 0.6 7K
40/70 0.7 0.7 8K
100 Mesh 0.6 0.6 8K
Evaluation Method: ISO 13503-2:2006/API RP19C:2008
24 2018-09-133. Monetizing Firebag Deposit (contd.)
Comparison tests by
StimLab show superior
performance to Tier-2
Brady sand for 40/70
up to 8,000 psi closure
stress and superior
performance to Tier-1
Northern White sand
for 2,000 psi
25 2018-09-133. Monetizing Firebag Deposit (contd.)
Comparison tests by
StimLab show superior
performance to Tier-1
Northern White sand
for 100 mesh up to
8,000 psi closure stress
26 2018-09-134. Execution Plan 27 2018-09-13
4. Execution Plan
     Major Milestones                             OPERATIONAL TARGET: mid-2019*
                                                  (*subject to financing & municipal permits)

     Processing Site Validation:                      July 2018 COMPLETE
     Feasibility Package & Equipment Selection:       July 2018 COMPLETE
     Capex & Opex Validation:                         August 2018
     Mayerthorpe Land Lease & Permits:                September 2018
     Capital Financing / JV Funding / FID:            November 2018
     Long-Lead Order Placement:                       November 2018
     Initial Extraction to Interim Staging:           Winter 2018-19

28   2018-09-13
4. Execution Plan (contd.)
Capex of CAD $48 million
Estimate supported by:
• 2018 Q3 Detailed Equipment Quotes from industry leading suppliers
• 2018 Q3 Detailed quotes received from multiple suppliers for Silos, Conveyors
and Dust Collection system
• Estimate Review to Class IV – Class V detail (underway)
CERTAINTY IN CAPEX
29 2018-09-134. Execution Plan (contd.)
Operational Data
• Utilities
• Gas: Utilizing industry leading efficient dryers
• Power: Local utility supplied capacity for wash, dry and material handling
• Water recycling of up to 90%, utilizing a water-efficient wash plant
• Key Notes
• Equipment suppliers providing operational performance guarantees
• Automated plant operations to reduce labour costs
• Reputable suppliers with proven performance in the industry
30 2018-09-134. Execution Plan (contd.)
Firebag
Mine Site
Logistics Details
20 km Not to Scale
• Mine is fully permitted for extraction
Stockpile
operations (year-round Processing
access) Plant Option
• Winter road access for 2018 / 2019 season
with summer access in Year 2+
600 km
• Stockpile near Highway 63
580 km
• Trucking partnership for transport to
operational hub in Mayerthorpe, AB
Demand in 200km radius
Duvernay Play (emerging)
2018E Demand: 1.3 million M
Processing,
Average utilization per well Storage and
2017E 8,000 mt /well Distribution Hub
Deep Basin
Mayerthorpe
2018E Demand: 0.7 million MT
31 2018-09-13Thank You
Investor Relations Contact
Dean Stuart
dean@boardmarker.net
(403) 617-7609
32 2018-09-13You can also read