Half year results presentation - 26 Weeks to 30 June 2019 - The Restaurant Group
←
→
Page content transcription
If your browser does not render page correctly, please read the page content below
Half year results presentation
26 Weeks to 30 June 2019
2019 H1 Highlights- A diversified business aligned to structural
growth trends

                              •     Market leading like-for-like sales performance continues
    Wagamama                  •     Addressing strong pipeline of growth opportunities
                              •     Site conversion and cost synergy programmes on track

                              •     Like-for-like sales consistently ahead of passenger growth
                                                                                                                  > 70%
    Concessions               •     Further development of brand portfolio with partnerships                      Outlet
                              •     Advanced discussions on adjacent market opportunities                        EBITDA*

                              •     Strong like-for-like sales outperformance vs market continues
       Pubs                   •     Customer ratings remain consistently high
                              •     Healthy pipeline of new site opportunities

                              •     On-going initiatives to improve food offering, service standards and brand
                                    proposition                                                                   < 30%
      Leisure                 •     Progress in brand perception and employee engagement                          Outlet
                                                                                                                 EBITDA*
                              •     Estate management discipline continues

*H1 2019 (Jan—June) Pro-forma outlet EBITDA

2       2019 Half year results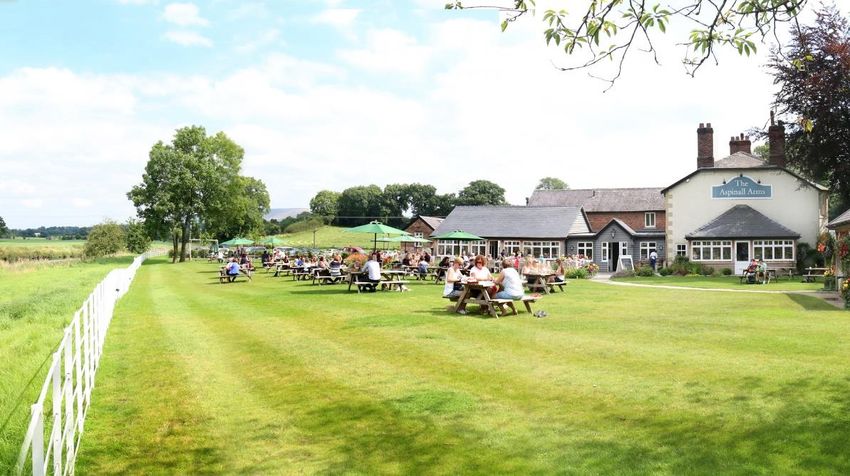
Financial review

2019 Half year results

3
Group financial summary HY2019
                                                                                                   2019 HY       2018 HY
                                                                                                     £m            £m      % Change
Column1

Revenue                                                                                                  515.9    326.1     +58.2%

Like-for-like %                                                                                                             +4.0%

EBITDA*                                                                                                  61.4     38.4      +60.1%

EBITDA margin %*                                                                                     11.9%        11.8%

EBIT / Operating profit*                                                                                 36.5     21.3      +70.8%

Operating margin %*                                                                                      7.1%     6.5%

PBT*                                                                                                     28.1     20.7      +35.6%

Earnings per share*                                                                                      4.5p     5.9p      (23.4%)
* Adjusted (pre-exceptional charge)

    • Interim dividend of 2.1p, in line with policy

Note: Earnings per share adjusted for bonus element following the rights issue in both financial years

4        2019 Half year results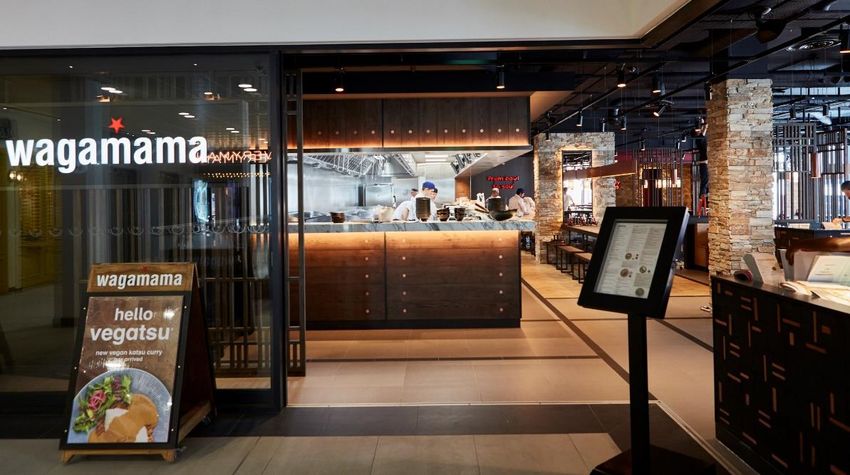
Revenue performance

                             •    Like-for-like sales up 3.7% for the first 34 weeks of the financial year
    TRG Group                •    Like-for-like sales up 0.2% for the most recent 6 weeks

                                                    •   Continued to significantly outperform the market
                                 Wagamama

                                                    •   Concessions like-for-like sales continue to outpace
                                 Concessions            passenger growth
                                  and Pubs          •   Pubs like-for-like sales continue to outperform the overall
                                                        pub restaurant sector

                                                    •   Like-for-like sales in the first half of year benefited from soft
                                                        comparatives
                                   Leisure
                                                    •   Recent trading saw modest like-for-like sales decline

5   2019 Half year results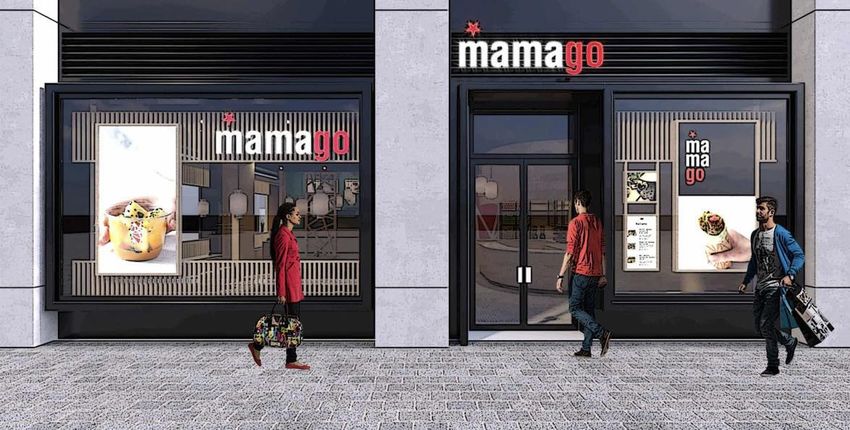
Group cost headwinds expected FY2019

    £m
                                                                            3            (10)
                                                         4
                                        5
                                                                                                          17
                15

         Wage Inflation             Purchase       Rent and rates     Utilities       Mitigation   Net cost increase
                                  cost inflation

    • Mitigating c.40% of 2019 cost increases (excluding Wagamama synergies):
          – Consistent progress in managing and optimising the supplier base
          – Continued focus on labour scheduling with peer group analysis
          – Improved terms obtained in negotiations with landlords for rent reviews
          – On-going appeals with local councils on business rates

6        2019 Half year results
Wagamama synergy programme on track to deliver £22m in 2021

                              Planned Synergies Allocation (circa %)                           On track to deliver at least £15m of
                                                                                                     cost synergies in 2021
                                                                                           •    Main opportunities in food, drink
                                                     Site                                       and consumables expenditure
                                                     Overhead           Wagamama
                              Food &                                                              o   Rate equalisation
       Cost                    Drinks                                                             o   Economies of scale
     Synergies                                      ~30%
                                                                       ~60%                •    Shared operations expertise
                                          ~50%
                                                                               ~40%        •    Consolidation of professional
                                                    ~20%                                        services

                                                     Central Cost             Legacy TRG

                                                                                                 On track to deliver £7m of site
                                                                                                  conversion synergies in 2021

       Site                                                                                •    Stevenage and Bletchley opened late
    conversion                                                                                  August
    Synergies                                                                              •    6 sites to convert between Sep - Nov
                                                                                           •    Expect c.50% ROIC*
                             Bletchley Conversion
                                                                                           •    At least 7 more sites in 2020
    * Return on Invested Capital (ROIC)

7          2019 Half year results
Group acquisitions and capital expenditure HY2019
                                                                                           2019 HY        2018 HY
                                      Column1                                                £m             £m
Dev elopment expenditure - opened sites                                                     10.3             8.4

Dev elopment expenditure - H2 openings                                                       9.1             2.9

Leisure site conv ersions to Wagamama                                                        0.9             0.0

Refurbishment and maintenance expenditure                                                   14.0             8.8

Total fixed asset additions                                                                 34.3            20.1

Number of new units                                                                          4               16

    • We opened 2 Concessions sites, 1 Pub and 1 Wagamama site in the US in the 1st half

    • Refurbishment and maintenance expenditure in the half included major refurbishments of 5 Wagamama sites, 2 Pubs
      and 1 Concessions unit

8       2019 Half year results
Group cash flow HY 2019
                                               2019 HY   2018 HY                 Commentary
Column1                                          £m        £m
Adjusted operating profit*                      36.5      21.3
    Working capital                             (8.8)     (13.0)   • Continued focus on Leverage:
    Non-cash adjustments                        (0.4)      0.2
                                                                     – Pro-forma net debt / EBITDA is 2.3x
    Depreciation                                25.0      17.0
Cash inflow from operations                     52.3      25.6     • Analytical review:
   Net interest paid                            (7.3)     (0.4)
                                                                     – Working capital outflow expected to
    Tax paid                                    (4.0)     (2.1)
                                                                       be temporary reflecting seasonality
    Refurbishment and maintenance                                      of the business
                                                (14.0)    (8.9)
    capital expenditure
Free cash flow                                  27.0      14.2       – Onerous lease provision included
    Dev elopment capital expenditure            (20.3)    (11.3)       £1.8m of one off costs to exit sites
    Mov ement in capital creditor               (4.0)      1.7
                                                                     – Post acquisition costs primarily relate
    Utilisation of onerous lease prov isions    (6.7)     (5.7)
                                                                       to transaction costs
    Post acquisition costs                      (20.7)      -
    Other items                                 (1.0)     (0.0)
Cash outflow                                    (25.7)    (1.1)
Group net debt at start of period              (291.1)    (23.1)
Group net debt at end of period                (316.8)    (24.2)
* Adjusted (pre-exceptional items)

9    2019 Half year results
Impairment of Leisure sites

                                                                                       Casual Dining Market remains
            Portfolio Analysis                         Market overcapacity
                                                                                                challenged

 • 76 Frankie and Benny’s sites           Branded Restaurants                     Restaurant LFL Sales
   identified as structurally                                                     Rolling 12 months                        Peach Tracker
   unattractive                                         +27%          5,780                                                Adjusted*
                                                                                    2%
 • A further 42 sites identified across
   other Leisure brands                                 4,539
                                                                                    1%
 • In total, this equates to a third of
   our Leisure sites                                                                0%

                                                                                   -1%
                                                       Dec-13         Dec-18
                                          Source: CGA/Alix Partners                -2%
                                                                                     Jan-18               Jul-18         Jan-19            Jul-19
                                          • Capacity adjustment is slow
                                          • Reduction of circa 1% over the last   * Adjust for the impact of the World Cup and extreme weather
                                            12 months                             Source: Peach Tracker

10   2019 Half year results
Group exceptional charges HY2019
Impairment of Onerous lease Integration Total
property, plant & provisions costs
equipment
Column1 £m £m £m £m
Exited sites - (0.4) - (0.4)
Distressed/closed sites 102.1 11.1 - 113.2
Integration costs - - 3.0 3.0
HY 2019 Exceptional charge 102.1 10.7 3.0 115.7
• Impairment charge relates to sites within our Leisure business that were identified as structurally unattractive and a more
cautious view on the medium-term outlook for our Leisure business
• £5.7m of the onerous lease provision related to newly identified sites and £5.4m relates to an increased charge on sites
previously provided for in our Leisure business
11 2019 Half year resultsFY19 Guidance
• 2019 development capital expenditure – £50m to £55m
– 4 new Pubs
– At least 5 new Concessions sites in 2019, and initial expenditure on units in Manchester terminal redevelopment (opening in 2020)
– 5 new Wagamama sites (2 UK , 1 airport , 2 US)
– 8 Leisure site conversions to Wagamama
– Roll-out of delivery kitchens and pilot of Wagamama Grab & Go concept, “Mamago”
• 2019 refurbishment and maintenance capital expenditure – £30m to £35m
– 5 transformational refurbishments of Wagamama UK sites
– 2 Pubs and 1 Concessions refurbishment projects
• Depreciation expected to be between £47m to £49m
• Interest guidance:
– Debt interest expected to be between £15m to £16m
– Provision interest expected to be c.£1m
• Trading remains broadly in line with our full year expectations
12 2019 Half year resultsOperational highlights 2019 Half year results 13
A diversified business aligned to structural growth trends
                                        Wagamama                    Concessions                   Pubs                          Leisure

                                • UK leader in pan-           • Market leader in UK      • Market leading               • Casual dining
                                  Asian cuisine                 airports                   proposition and                restaurants spanning
                                                                                           strong operational             the UK across
                                • Market leading              • Strong brand and           capability                     multiple brands
                                  performance                   operational
                                • Well aligned to key           capabilities create      • Healthy organic              • Optimising
 Diversified                      structural trends;            high barriers to entry     pipeline of new sites          performance but
 growth                           speed, convenience,                                                                     exposed to
 business                                                     • Consistent track         • Freehold asset base            increasing structural
                                  delivery and healthy          record of growth           valued in excess of
                                  options                                                                                 headwinds
                                                                and site renewals          £95m
                                                                                                                        • Capitalising on “off-
                                                                                                                          trade” opportunities

                                  142 own sites and 57
                                                                      70 sites                   83 sites                      352 sites
                                    franchised sites

                                                             > 70% Outlet EBITDA*                                      < 30% Outlet EBITDA*

 Multiple                                                                                                       Delivery &
                                 Wagamama                 UK              Premium        International                            Food-to-go
 growth                                                                                                          delivery
                                    UK                Concessions           pubs         opportunities                             formats
 drivers                                                                                                         kitchens

*HY 2019 (Jan—June)Pro-forma outlet EBITDA

14      2019 Half year results
Our priorities
1
Deliver the benefits of the Wagamama acquisition
2
Grow our Concessions and Pubs businesses
3
Optimise our Leisure brands
15 2019 Half year results1
Continued positive momentum
Lowest Level of Team Turnover Leading Net Promoter Score
Top 10 UK casual dining NPS
80% 44 41
36 35 34 31 31
75% 30 30 30
70%
65%
BOH
Wagamama
Bill’s
Nando’s
Five Guys
Turtle Bay
YO Sushi
Côte
Pizza Express
Las Iguanas
Wahaca
60%
FOH
55%
Jul-17 Jan-18 Jul-18 Jan-19 Jul-19
Source: BrandVue NPS - June 30th, 2019
Market Leading UK LFL sales Strong Adjusted EBITDA Progression
Restaurant Market Wagamama
Rolling 12 months £’m
15%
10% 51.4
5% 44.6
42.3
-
-5%
Q3
Q3
Q2
Q2
Q2
Q1
Q1
Q1
Q4
Q4
FY17 FY18 FY19 Apr-18 Dec-18 Jun-19
Note: Results as per TRG financial year quarters
Source: Peach Tracker, Restaurants
16 2019 Half year results1
Key developments in the UK core business
Menu Developments Transformational Refurbishments Multi-channel Growth
Bluewater post refurbishment Sales and Channel Participation
12%
Delivery 9% 4%
Take out 4%
Eat in 86% 84%
H1 2018 H1 2019
• Launch of extended vegan range • 5 completed this year creating • Strong in restaurant cover
• New, lighter ‘Kokoro’ bowls 200 additional covers growth
launched • Anticipate at least 45% return on • Operational improvements and
• Improved drinks and desserts invested capital strong partnership with
range Deliveroo driving delivery growth
17 2019 Half year results1
Progressing on multiple growth avenues
New Sites • Selective approach to high quality openings
and o 3 in 2019
Concessions o 4 to 5 in 2020
(UK)
The Bower, Old Street design
• Opened own site in Hackney in late July
Delivery • Expect to open at least two further sites in
Kitchen 2019
• Proposition developed
• 1st site secured on Fenchurch street
Food-to-go
• Due to open in Q4
Mamago design
• Improved trading momentum
• Progressing with our review of strategic
US
options
Nomad, New York
18 2019 Half year resultsOur priorities
1
Deliver the benefits of the Wagamama acquisition
2
Grow our Concessions and Pubs businesses
3
Optimise our Leisure brands
19 2019 Half year results2
Growing our Concessions business
• Sales continue to outpace passenger
growth
• 85% of sites received renewals beyond
original contract term
Existing
Estate • Further trial and rollout of technologies
that enhance customer convenience:
– Waiting time screens
– Pay-at-table and order and pay
Sonoma, Gatwick Airport
• Expect to open at least 5 new sites in 2019 New Brand Partnerships
• Secured 6 sites in Manchester airport
terminal redevelopment opening in 2020:
New Sites
– Expected to reach maturity in 2022
• Further development of brand portfolio
with partnerships
• Exploring adjacent opportunities
New growth
opportunities • Actively exploring potential for
international sites
20 2019 Half year results2
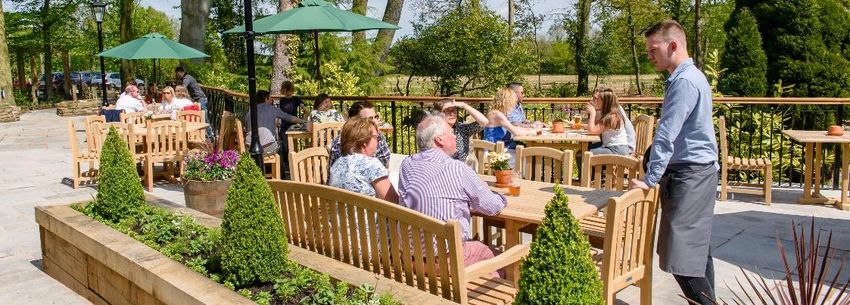
Growing our Pubs business
Consistent Outperformance Continues • Continued menu evolution:
– Extended vegan range
LFL Sales vs Coffer Peach Tracker (6 month moving average) – Enhanced low/no alcohol range
8% • Increased utilisation of the existing
space:
6% LFL Sales – Accommodation
drivers – Function spaces
4%
• Multiple technology initiatives
2% improving customer engagement
- • Strong social reviews maintained at
Jan-17 Jul-17 Jan-18 Jul-18 Jan-19 Jul-19 4.4 / 5
Source: Peach Tracker, Pub-Restaurants
• On track for 4 new sites in 2019
• Continued selective approach to site
Estate expansion
expansion
The Oakley Arms, Brewood
21 2019 Half year resultsOur priorities
1
Deliver the benefits of the Wagamama acquisition
2
Grow our Concessions and Pubs businesses
3
Optimise our Leisure brands
22 2019 Half year results3
Frankie & Benny’s: key initiatives
Food
Proposition Improving Engagement
Social Media Rating*
4.2
4.0
Brand
Engagement 3.8
3.6
3.4
May- Aug- Nov- Feb- May- Aug-
18 18 18 19 19 19
Leveraging
Existing
Estate
*Source: Yext Reviews – 3 month moving average (out of 5)
23 2019 Half year results3
Chiquito: key initiatives
Food
Proposition Improving Engagement
Social Media Rating*
4.2
4.0
Brand
Refresh 3.8
3.6
3.4
May- Aug- Nov- Feb- May- Aug-
18 18 18 19 19 19
Leveraging
Existing
Estate
*Source: Yext Reviews – 3 month moving average (out of 5)
24 2019 Half year results3
Leisure estate next steps
Lease Profile Recent Progress
Proportion of Leisure estate as at Number of sites
3rd September 2019
368 352
8 3 5
29%
11%
9% 9%
7% 8% 7% 6% 6% 6%
Estate Conversions Break Closed 3rd Sep-19
YE 2018 or lease
1
10+
3
4
5
7
9
6
8
2
expiry
No. of years to first exit date
Closures
• Median 6 years to first exit date • 7 further conversions planned in 2020
• Expect to exit at least of 50% of sites coming up at lease • Progress being made with landlords in recent lease
expiry or break clause reflecting our cautious view of events, achieving:
the casual dining sector – Increased lease flexibility
– Rent reductions
25 2019 Half year resultsSummary • Enlarged group strongly orientated towards growth • Wagamama acquisition plan on track • Like-for-like sales growth ahead of passenger growth in Concessions with multiple opportunities ahead • Pubs continue to outperform the market with opportunities for further growth • Continuing challenges in Leisure business, addressed through targeted initiatives and disciplined estate management • Trading remains broadly in line with our full year expectations 26 2019 Half year results
CEO Overview: only one month in but key priorities for next six
months are clear
     1
                                  •   Maintain industry leading like-for-like sales growth rates
           Deliver the            •   Build on obsession with fresh food and unique colleague culture
           benefits of the
                                  •   Identify next set of site conversions
           Wagamama
           acquisition            •   Focused on delivering cost synergies
                                  •   Review International opportunities

     2                            •   Continue to drive Concessions like-for-like growth ahead of passenger numbers
           Grow our               •   Exploit new airport sites and other infrastructure hubs potential
           Concessions and
           Pubs businesses        •   Maintain Pubs like-for-like sales outperformance vs market
                                  •   Build on strength of Pub site portfolio with selective additions

     3                            •   Full review of food, service and brand propositions of our Leisure brands
           Optimise our           •   Exit at least 50% of sites at lease expiry or break
           Leisure brands
                                  •   Rigorous site by site negotiations with landlords on leases being renewed

27       2019 Half year results
Q&A 2019 Half year results 28
Appendices

2019 Half year results

29
Estate movements schedule

                              Estate at   Openings   Closures   Conversions   Estate at
                              30/12/18                                        03/09/19
Column1
Frankie & Benny's               248          -         (7)          (3)         238

Wagamama UK                     134          1                      2           137

Pub Restaurants                  81          3         (1)           -           83

Chiquito                         83          -          -           (4)          79

Concessions                      71          2         (3)           -           70

Wagamama US                      5           1         (1)           -           5

Delivery Kitchen                 1           2          -            -           3

Other Leisure Brands             37          -         (1)          (1)          35

Total TRG                       660          9         (13)         (6)         650

30   2019 Half year results
You can also read