HY20 RESULTS PRESENTATION - 28 FEBRUARY 2020 - Open Briefing

Page created by Lori Ramirez
 
CONTINUE READING
HY20 RESULTS PRESENTATION - 28 FEBRUARY 2020 - Open Briefing
HY20 RESULTS
PRESENTATION
28 FEBRUARY 2020

HORIZON OIL LIMITED | ABN 51 009 799 455
HY20 RESULTS PRESENTATION - 28 FEBRUARY 2020 - Open Briefing
01—
OVERVIEW
HY20 RESULTS PRESENTATION - 28 FEBRUARY 2020 - Open Briefing
Recent Events Update
•   Recent weeks challenging following media articles pertaining to PNG licence transactions dating back to 2011

•   Strong and proactive Company and Board response to allegations

        •   Independent external investigation commenced with Herbert Smith Freehills and Deloitte

        •   Independent board committee established to oversee investigation

        •   CEO suspended on 12 February 2020, with new CEO Chris Hodge appointed

•   Recent allegations exacerbated PNG challenges including licence tenure issues, lack of progress in commercialisation of
    the discovered resources and recent shift by PNG Government in requiring improved fiscal returns from resource projects.
    In light of the above matters and uncertainties, together with reference to comparable market transactions, led to a
    US$67.3 million impairment of the Group’s PNG portfolio to a carrying value of US$5.7 million

•   Base business strong with continued material cashflow generation until late into this decade

•   Company remains poised for seizing growth opportunities

                                                                                                       28 FEBRUARY 2020   PAGE 3
HY20 RESULTS PRESENTATION - 28 FEBRUARY 2020 - Open Briefing
HY20 HIGHLIGHTS
Production Volume           Sales Revenue                 EBITDAX
754,862 bbls                US$53 million                 US$31 million

Net Debt Reduced            Underlying Profit after Tax    Cash on Hand
US$7.4 million              US$6.2 million                 US$22 million

HY20 RESULTS PRESENTATION                                            28 FEBRUARY 2020   PAGE 4
HY20 RESULTS PRESENTATION - 28 FEBRUARY 2020 - Open Briefing
HY20 DELIVERING ON OBJECTIVES
STRONG PRODUCTION AND CASHFLOW PROVIDING PATHWAY TO FURTHER GROWTH

                            • Continued strong high margin                           • Progressive debt reduction
    Strong                    production from Maari and           Progressive Debt     with Net Debt reduced to
    Production &              Beibu                               Reduction            US$7.4 million

    Cashflow                • Cash operating costs averaged                          • On track to net cash by
                              approximately US$20/bbl                                  30 June 2020

                            • Drilling success in Block 22/12,                       • Continued sound HSSE
    Drive Growth              leading to pursuit of further       Sustainability       performance at Horizon Oil’s
                              infill, appraisal and exploration                        operated and non-operated
                              opportunities                                            assets

                            • Commenced evaluation of
                              inorganic growth opportunities

HY20 RESULTS PRESENTATION                                                            28 FEBRUARY 2020   PAGE 5
HY20 RESULTS PRESENTATION - 28 FEBRUARY 2020 - Open Briefing
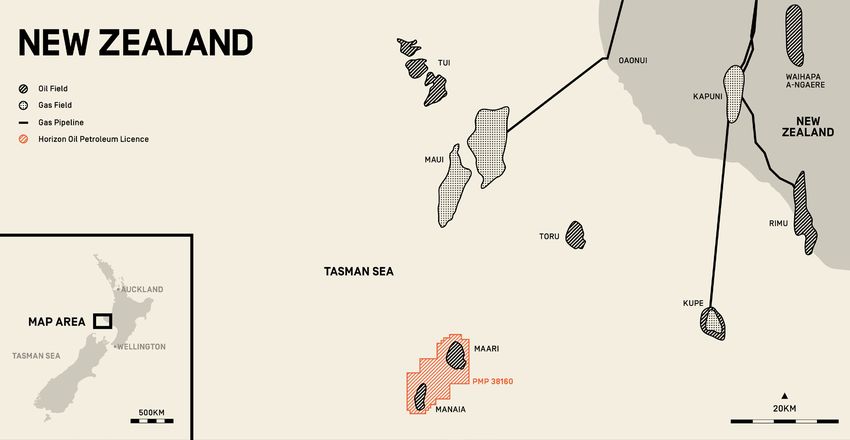
02—
FINANCIAL
RESULTS
HY20 RESULTS PRESENTATION - 28 FEBRUARY 2020 - Open Briefing
HY20 FINANCIAL RESULTS
 (US$ million)                             HY 2020    HY 2019      Change (%)
                                                                                Sales volume reverted to approximate net
 Production volume, bbls                   754,862    801,904           [6%]    working share of production following early
                                                                                recoupment of cost recovery entitlement in
 Sales volume, bbls                         770,744   1,021,218         [25%]   China.

 Revenue                                      52.7        63.6          [17%]
                                                                                Realised oil price of US$68.34 per barrel,
 EBITDAX                                       31.3       44.3         [29%]    inclusive of US$2.8 million hedging gain.

 Statutory (loss)/profit after tax           (62.8)       20.1        [>100%]   Operating costs of US$32.5 million were 12%
                                                                                lower than the prior year.
 Add/(less) financing costs – unrealised        1.7       (11.4)       [115%]
 movement in value of options
 Add impairment expense                        67.3           -        >100%    US$67.3 million non-cash impairment recorded
                                                                                on the Group’s PNG assets.
 Underlying profit after tax                   6.2          8.7        [28%]

 Cash on hand                                  22.1       20.4            8%

 Cashflow from operating activities            24.2       34.3          [29%]
                                                                                A further US$20.0 million in debt repaid during
                                                                                the half-year. Net debt reduced by 89% to
 Net debt                                       7.4       64.2         (89%)
                                                                                US$7.4 million.

HY20 RESULTS PRESENTATION                                                              28 FEBRUARY 2020   PAGE 7
HY20 KEY CASHFLOW DRIVERS
US$ MILLION
                                2.8
                                               -19.0

                                                              -7.3
                        49.9                                              -2.2

                                                                                                      -20.1
                                                                                       24.2

                                                                                                                      -1.1             -2.4

      21.5                                                                                                                                          22.1

 Cash & cash Crude oil sales   Hedging      Operating      Corporate &   Interest     Net cash         Debt     Investment in     Exploration Cash & cash
equivalents at               settlements    costs (excl        tax                  inflows from   repayment & oil & gas and      expenditure equivalents at
 30 June 2019                              amortisation)                              operating     lease costs other assets                   31 December
                                                                                      activities                                                   2019

  Strong net operating cashflow generation             Disciplined investment in exploration and              Reduced interest costs and maintenance of
  used to materially reduce debt                       development activities to drive growth                 low general & administrative expenditure

HY20 RESULTS PRESENTATION                                                                                               28 FEBRUARY 2020   PAGE 8
HY20 UNDERLYING PROFIT DRIVERS
14      US$m
 12
10            8.7
 8
                                                                                                                                                                                  6.2
 6
 4
                                                                                                                (0.7)                                     6.4
 2                                                                                                                                 (1.8)
                                    [13.9]
 0                                                                                           4.6
-2
-4
                                                                         6.2
-6                                                    [3.2]
-8
-10
          Underlying            Cost recovery  Production Volume Net realised oil      Operating costs   Other income/costs   Exploration and      Financing costs            Underlying
        Profit after tax      volumes recouped                   price, inclusive of                                           development                                  Profit after tax
         for HY 2019                                            hedge settlements                                                expenses                                    for HY 2020

      The impact of recoupment of cost recovery                     Cost discipline maintained with low general                 Financing costs reduced following
      volumes substantially mitigated by higher                     & admin expenditure and modest                              refinancing and repayment of debt
      realised oil price and lower operating costs                  exploration/development expenditure

  HY20 RESULTS PRESENTATION                                                                                                                     28 FEBRUARY 2020   PAGE 9
CALENDAR YEAR FINANCIAL HIGHLIGHTS
    OIL SALES (mmbbls)                                                                            REVENUE1 (US$m)
                                                                                                     130                                                                               80
                                                                                                     120                                                                      4.2
                                                                                                                                                             24.5                      70
                                                             0.39                                     110
       5-year average: 1.55 mmbbls                                           0.06                    100                                                                               60
                                                                                                      90
                             0.15                                                                     80                                                                      59.1     50
                                            0.29                                                                                                             59.0

                                                                                                                                                                                            US$/bbl
                                                                                                       70

                                                                                              US$m
                                                             0.97            0.92                              48.5                          15.2                                      40
                                                                                                      60                       7.3
           0.86
                             0.89                                                                      50                                                                              30
                                            0.82                                                       40                     34.6
                                                                                                                                             42.6
                                                                                                       30                                                                              20
                                                                                                               43.6                                          43.8             48.2
                                                             0.65            0.63                      20
           0.48                                                                                                                                                                        10
                             0.34                                                                      10                     24.4
                                            0.29                                                                                             15.5
                                                                                                        0                                                                              0
          CY 2015           CY 2016        CY 2017      CY 2018            CY 2019                            CY 2015       CY 2016        CY 2017        CY 2018         CY 2019

                     Beibu cost recovery    Beibu    Maari                                                  Beibu cost recovery          Beibu       Maari          Net realised sales price 1
                                                                                              1   inclusive of hedge settlements

  Oil sales volume above 5-year average level                       Base sales revenue exclusive of cost                             Greater production and revenue
  with early recoupment of cost recovery                            recovery increased for both Beibu and                            diversification following acquisition of
  volume                                                            Maari driven by higher net realised oil price                    additional Maari interest in 2018

HY20 RESULTS PRESENTATION                                                                                                                        28 FEBRUARY 2020   PAGE 10
CALENDAR YEAR FINANCIAL HIGHLIGHTS
    EBITDAX AND COST PER BBL                                                                        UNDERLYING PROFIT BEFORE TAX (US$m)
                                                           88.3
             90                                                                   30
                       77.3                                             80.0                                                                                       34.8
             80                                                                                                                                     32.1
                                                                                  25
             70
             60                                                                   20
                                                 51.3

                                                                                          US$/bbl
             50
      US$m

                                    40.5                                          15                    5.9
             40                                                                                                                    6.1
             30                                                                   10
             20
                                                                                  5
             10                                                                                                  -11.1
              0                                                                   0
                   CY 2015         CY 2016      CY 2017   CY 2018     CY 2019                         CY 2015   CY 2016          CY 2017          CY 2018         CY 2019

             EBITDAX          Cash opex/produciton bbl    G&A and others/production bbl

  Continued strong EBITDAX driven by                                 Maintenance of low general and                       Underlying profit of US$34.8 million with
  sustained production and maintenance of                            administrative expenditure
CALENDAR YEAR FINANCIAL HIGHLIGHTS
    FREE CASH FLOW (US$m)                                                                               NET DEBT (US$m)

                                                                                                             127.7
                                                                                                                            120.8

                65.5                                              67.6             62.7
                                                                                                                                              94.3
                                 35.3             40.2

                                                                                                                                                               64.2
                                 -18.7                                             -5.8
                -42.5                            -13.7            -35.6

                                                                                                                                                                                7.4
               CY 2015         CY 2016          CY 2017          CY 2018         CY 2019

         Investing CF       Operating CF         FCF*                                                       CY 2015        CY 2016           CY 2017          CY 2018         CY 2019
   * Free Cash Flow represents cash flows from operating activities less investing cash flows
   (net of acquisition payments)

  Sustained growth in free cash flow with disciplined                    Accelerated debt reduction following 2018                   89% reduction in net debt for CY19 and on track to
  investment in exploration and development                              refinancing which consolidated debt, simplified             Net Cash position by 30 June 2020
  activities                                                             capital structure and lowered funding costs

HY20 RESULTS PRESENTATION                                                                                                                        28 FEBRUARY 2020   PAGE 12
03—
OUTLOOK &
PORTFOLIO
UPDATES
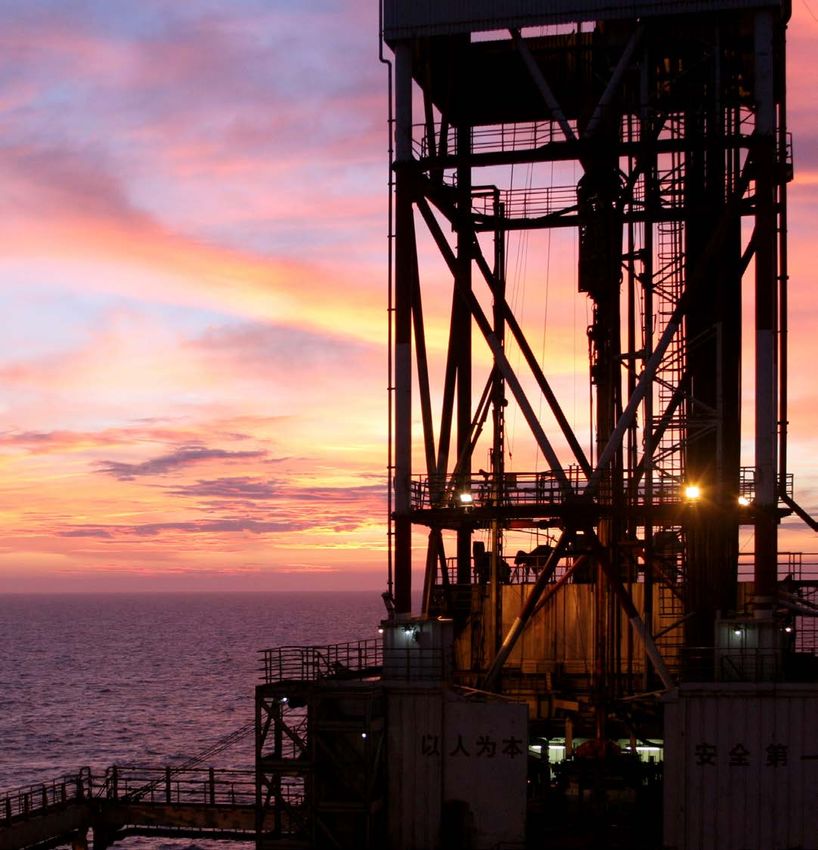
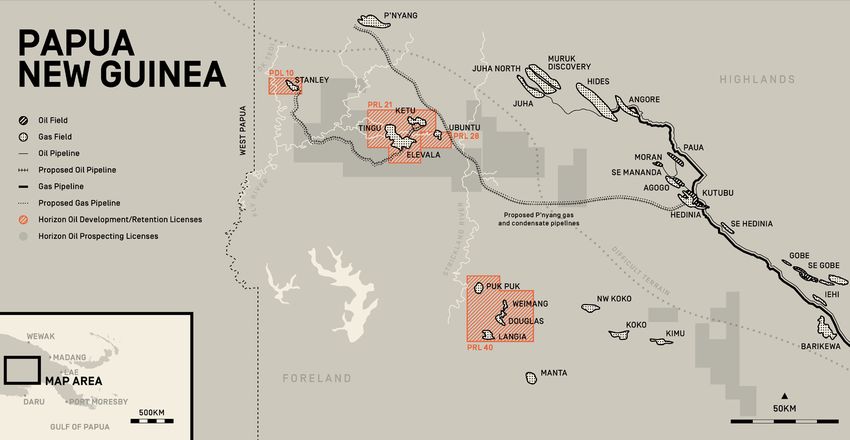
OVERVIEW OF PORTFOLIO                            Block 22/12 (Beibu Gulf]   26.95% / 55%

         •     Asia Pacific focus
                                                                                            PDL 10 (Stanley)                  30%
         •     Material joint venture interests                                             PRL 21 (Elevala/Ketu)             30.15%
                                                                                            PRL 28 (Ubuntu)                   30%
         •     High margin, long life oil production                                        PRL 40 (Puk Puk/Douglas)          20%
               assets in China and New Zealand                                              PPL 372                           95%
               generating strong cashflow                                                   PPL 373                           100%
                                                                                            PPL 574                           80%
         •     Significant holding in material
               condensate rich gas resources and
               adjacent exploration acreage in PNG

                                                                                                                              PMP 38160 (Maari/Manaia)   26%

HY20 RESULTS PRESENTATION                                                                                              28 FEBRUARY 2020   PAGE 14
2P Reserves: 4.4 mmbbls
          2C Resources: 2.0 mmbbls

          As at 30 June 2019

HY20 RESULTS PRESENTATION            28 FEBRUARY 2020   PAGE 15
CHINA BLOCK 22/12
 BLOCK 22/12 PRODUCTION HISTORY & OUTLOOK
 16,000
                                                                                                                                                                                                                                                                                                                                          Annual        Average     •   Current gross daily production rate
                                                                                                                                                                                                                                                                                                                                           Gross      Daily Gross
 14,000
                                                                                                                                                                                                                                                                                                                                        Production,   Production,
                                                                                                                                                                                                                                                                                                                                                                        above 10,000 bopd – above average
                                                                                                                                                                                                                                                                                                                                          mmbbls         bopd           historical daily production rate.
 12,000
                                                                                                                                                                                                                                                                                                                              CY 2013      3.02          9,882
 10,000                                                                                                                                                                                                                                                                                                                                                             •   Production rates maintained since
                                                                                                                                                                                                                                                                                                                              CY 2014      4.08          11,194         first production over 6 years ago
  8,000                                                                                                                                                                                                                                                                                                                                                                 through infill and nearfield drilling,
                                                                                                                                                                                                                                                                                                                              CY 2015      3.43          9,404          installation of additional water
  6,000                                                                                                                                                                                                                                                                                                                                                                 handling capacity and production
                                                                                                                                                                                                                                                                                                                              CY 2016      3.28          8,981
                                                                                                                                                                                          Average daily gross production                                                                                                                                                optimizing well workovers.
  4,000
                                                                                                                                                                                          2020 Production                                                                                                                     CY 2017      3.04          8,326
  2,000                                                                                                                                                                                   Historical average                                                                                                                                                        •   Maturing plans for further infill drilling,
                                                                                                                                                                                                                                                                                                                              CY 2018      3.60          9,857          together with WZ 12-8E field
      -                                                                                                                                                                                                                                                                                                                                                                 development production to offset
                                                                                                                                                                                                                                                                                                                              CY 2019      3.43          9,399
                     Jun-2013

                                                                 Jun-2014

                                                                                                             Jun-2015

                                                                                                                                                         Jun-2016

                                                                                                                                                                                                     Jun-2017

                                                                                                                                                                                                                                                 Jun-2018

                                                                                                                                                                                                                                                                                             Jun-2019
                                Sep-2013

                                                                            Sep-2014

                                                                                                                        Sep-2015

                                                                                                                                                                    Sep-2016

                                                                                                                                                                                                                Sep-2017

                                                                                                                                                                                                                                                            Sep-2018

                                                                                                                                                                                                                                                                                                        Sep-2019
                                           Dec-2013

                                                                                       Dec-2014

                                                                                                                                   Dec-2015

                                                                                                                                                                               Dec-2016

                                                                                                                                                                                                                           Dec-2017

                                                                                                                                                                                                                                                                       Dec-2018

                                                                                                                                                                                                                                                                                                                   Dec-2019
          Mar-2013

                                                      Mar-2014

                                                                                                  Mar-2015

                                                                                                                                              Mar-2016

                                                                                                                                                                                          Mar-2017

                                                                                                                                                                                                                                      Mar-2018

                                                                                                                                                                                                                                                                                  Mar-2019
                                                                                                                                                                                                                                                                                                                                                                        natural reservoir decline.
                                                                                                                                                                                                                                                                                                                              Average      3.41         9,570

 Block 22/12 continues to                                                                                                                                           Long life production – current WZ                                                                                                                         Low cash operating costs –                  Current WZ 6-12 and WZ 12-8 field
 generate approximately 60-70%                                                                                                                                      6-12 and WZ 12-8 field lives                                                                                                                              currently less than US$15/bbl               abandonment costs prepaid in
 of Horizon Oil cashflow                                                                                                                                            forecast to 2028                                                                                                                                          produced                                    sinking fund

HY20 RESULTS PRESENTATION
CHINA BLOCK 22/12
During HY20
•   Crude oil sales were 410,811 barrels with cost recovery
    volumes of 2,474 barrels at a net realised price of US$65.19
    per barrel.

•   Production from the Group’s interest in the Beibu Gulf fields
    was 444,740 barrels of oil with average gross production
    rate of 8,969 bopd.

•   Cash operating costs remained below US$15 per production
    barrel.

•   Successful exploration drilling of the WZ 6-12 M1 well results
    in an additional 0.6 mmbbls gross 2C contingent resources,
    0.2 mmbbls net to HZN.

Outlook
•   Maturing plans for evaluation of nearby prospects during
    the 2020 calendar year, with the intention to integrate any
    commercial discoveries with the recent WZ 6-12 M1
    discovery and other infill well targets.
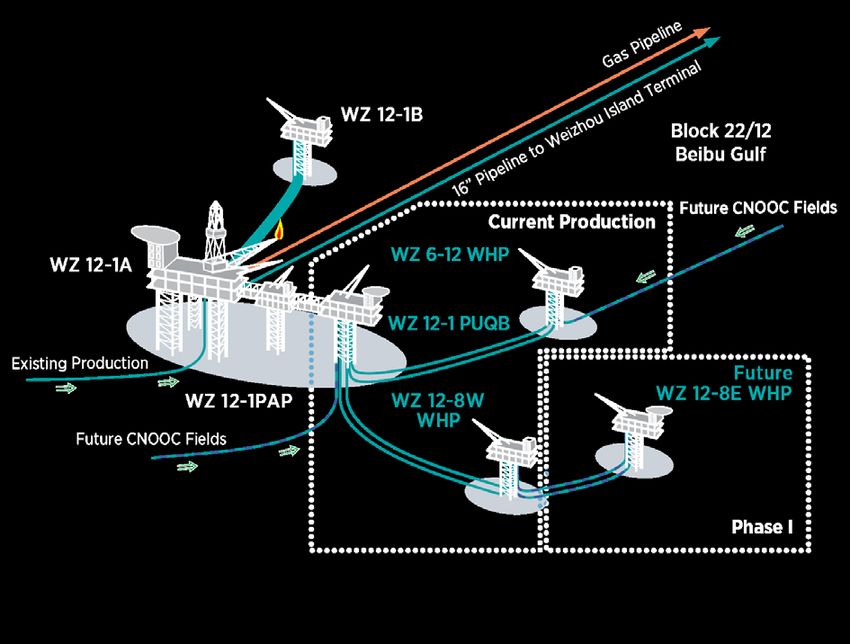
HY20 RESULTS PRESENTATION
CHINA BLOCK 22/12
BLOCK 22/12

WZ 12-8E Project
•    Basic engineering for the development has been
     completed.

•    The development of WZ 12-8E is planned with a new
     wellhead platform tied back to the existing WZ 12-8W
     platform. The new platform will be leased by the joint
     venture, reducing upfront capital costs.

•    FID for the development is expected later this financial
     year.

•    First oil is expected to commence mid-2021 calendar
     year.

•    Total development costs net to Horizon Oil are forecast
     to be less than US$20 million, with the majority phased
     throughout the 2021 and 2022 calendar years.

HY20 RESULTS PRESENTATION                                       28 FEBRUARY 2020   PAGE 18
2P Reserves: 4.4 mmbbls
     2C Resources: 5.5 mmbbls

     As at 30 June 2019

                                MAARI/MANAIA FIELDS

HY20 RESULTS PRESENTATION                    28 FEBRUARY 2020   PAGE 19
NEW ZEALAND
      MAARI/MANAIA PRODUCTION HISTORY & OUTLOOK
          12,000
                                                                                                                                                                                                                                                    Annual Gross Production,   Average Daily Gross Production,
                                                                                                                                                                                                                                                            mmbbls                          bopd
          10,000
                                                                                                                                                                                                                                         CY 2017              2.94                         8,064
                                                                                                                                                                                                                                         CY 2018              2.28                         6,256
          8,000
                                                                                                                                                                                                                                         CY 2019              2.44                         6,675
   bopd

          6,000                                                                                                                                                                                                                          Average              2.55                         6,998

          4,000                                                                                                                                                                                                                       • Current gross daily production rate approx. 7,000 bopd – in line with
                                                    Average daily gross production                                                                                                                                                      average historical daily production rate over the last 3 years.
          2,000                                     2020 Production                                                                                                                                                                   • Overall production decline rate reduced through continued water
                                                    Historical average                                                                                                                                                                  injection and production optimizing well workovers.
              0
                                                                                                                                                                                                                                      • Potential new operator targeting long term maintenance of

                                                                                                                                                                                                                          Jan-2020
                                                                                      Jan-2018

                                                                                                                                  Sep-2018

                                                                                                                                                        Jan-2019
                   Jan-2017

                                                                                                                                                                                                    Sep-2019
                                                                Sep-2017

                                                                                                            May-2018

                                                                                                                                                                              May-2019
                                         May-2017

                                                                                                                       Jul-2018

                                                                                                                                                                                         Jul-2019
                                                     Jul-2017

                                                                                                 Mar-2018

                                                                                                                                                                   Mar-2019
                              Mar-2017

                                                                                                                                             Nov-2018

                                                                                                                                                                                                               Nov-2019
                                                                           Nov-2017

                                                                                                                                                                                                                                        production levels, operating cost reductions and field life extension to
                                                                                                                                                                                                                                        2031 and beyond.

                                                                                                                                                                                                                                     Long life production
    Maari/Manaia continues to                                                                                          CY19 production 7% above CY18
                                                                                                                                                                                                                                     – current production licence and          Cash operating costs
    generate approximately 30-40%                                                                                      – strong response from water
                                                                                                                                                                                                                                     reserves forecast to end of 2027          - US$25 - 30/bbl
    of Horizon Oil cashflow                                                                                            injection
                                                                                                                                                                                                                                     with potential to extend

HY20 RESULTS PRESENTATION
NEW ZEALAND
MAARI/MANAIA FIELDS

During HY20
•    Crude oil sales were 359,933 barrels at a net realised oil price of
     US$71.9 per barrel.

•    Production from the Group’s interest in Maari and Manaia fields was
     310,122 barrels of oil with average gross production rate of 6,482
     bopd, 11% higher than HY2019. The increased production was driven
     by well optimization activities and continued water injection.

•    Cash operating costs were US$26.90 per barrel (US$30.3 per barrel
     including workovers).

•    In November 2019, Jadestone Energy Inc. (AIM:JSE, TSXV:JSE)
     announced that it had executed a conditional sale and purchase
     agreement to acquire OMV New Zealand Limited’s 69% interest in
     the Maari project. The completion of the proposed transaction will
     occur upon satisfaction of conditions on or before 15 November
     2020.

Outlook
•    JV continues to focus on production optimisation and life extension
     planning following the continued strong production performance.

    HY20 RESULTS PRESENTATION
2C Resources:
                                          Liquids: 26.9 mmbbls
                                          Raw gas: 599 bcf

                                          As at 30 June 2019

HY20 RESULTS PRESENTATION   28 FEBRUARY 2020   PAGE 22
PNG
During HY20
•    In Papua New Guinea, Horizon Oil continued planning for the
     commercialisation of the gross appraised resource of 2,200
     PJ of sales gas and 64 million barrels of associated
     condensate in four petroleum licences in the foreland basin
     of Western Province.

•    During the period, activities to optimise and refine the
     engineering basis for a condensate development at Elevala
     and Ketu continued.

Outlook
•    Whilst the Group’s PNG assets have significant potential
     value, there remain challenges to realising value in the
     short term. Accordingly, this led to the Group impairing its
     PNG assets in the period down to US$5.7 million.

HY20 RESULTS PRESENTATION
OUTLOOK & TARGETS
STRONG PRODUCTION AND CASHFLOW PROVIDING PATHWAY TO FURTHER GROWTH
                            • Pursue and promote production                            • Continued strong cashflow
    Strong Operating          enhancement opportunities at            Strengthen         generation allowing for progressive
                              Maari/Manaia and Beibu fields
    Cashflow                                                          Balance Sheet      reduction in debt
                            • Strong hedge position – 270,000                          • Forecast net cash position by
                              bbls hedged to 30 June 2020 at                             30 June 2020
                              US$68.35/bbl

                            • Maintenance of low operating costs
                              with disciplined and focused infield/
                              near field exploration/appraisal
                              program

                            • Execute WZ 12-8E development                             • Focus on continued safe operations
    Drive Growth              combined with pursuit of further        Sustainability
                              infill, appraisal and exploration                        • Climate-change resilience reporting
                              opportunities in China

                            • Pursue inorganic growth
                              opportunities

HY20 RESULTS PRESENTATION                                                               28 FEBRUARY 2020   PAGE 24
FY20 GUIDANCE
STRONG PRODUCTION AND CASHFLOW PROVIDING PATHWAY TO FURTHER GROWTH

     PRODUCTION                                                                                 SALES
     (NET WORKING INTEREST VOLUMES)         1.4 – 1.5 mmbbls                                    (VOLUMES)                                1.4 – 1.5 mmbbls

     REVENUE                                US$90 – 100 million                                 EBITDAX                                  US$50 – 60 million

 •   The above Guidance represents forward looking statements. Such statements relate to future events and expectations and as such involve known and unknown risks and
     uncertainties. Actual results, actions and developments may differ materially from those expressed or implied by these forward looking statements depending on a variety of
     factors. Refer to disclaimer on the following slide.

HY20 RESULTS PRESENTATION                                                                                                                  28 FEBRUARY 2020   PAGE 25
DISCLAIMER
Statements contained in this material, particularly those regarding the possible or assumed future performance, costs,
dividends, returns, production levels or rates, prices, reserves, potential growth of Horizon Oil Limited, industry growth or
other trend projections and any estimated company earnings are or may be forward looking statements. Such statements
relate to future events and expectations and as such involve known and unknown risks and uncertainties. Actual results,
actions and developments may differ materially from those expressed or implied by these forward looking statements
depending on a variety of factors.

While every effort is made to provide accurate and complete information, Horizon Oil accepts no responsibility for any loss,
damage, cost or expense incurred by you as a result of any error, omission or misrepresentation in information in this
presentation.

In this presentation, references are made to EBITDAX, Underlying Profit and Free Cashflow, which are financial measures
which are not prescribed by Australian Accounting Standards:

• EBITDAX represents the profit adjusted for interest expense, taxation expense, depreciation, amortisation, and exploration
  expenditure (including non-cash impairments)

• Underlying profit represents the profit adjusted for the unrealised movement in the value of options issued under the
  subordinated loan facility, unrealised movements and gains associated with convertible bonds and non-cash impairments

• Free Cash Flow represents Cashflow from Operating Activities less Investing cashflows (net of acquisition payments)

All references to dollars in the presentation are United States dollars unless otherwise noted.

HY20 RESULTS PRESENTATION                                                                                                       28 FEBRUARY 2020   PAGE 26
Authorisation

This ASX announcement is approved and authorised for release by the Horizon Oil board.

FOR MORE INFORMATION
PLEASE CONTACT US
 CHRIS HODGE                        Horizon Oil Limited
 P +61 2 9332 5000                  Level 6, 134 William Street
 info@horizonoil.com.au             Woolloomooloo NSW 2011
                                    Australia
                                    horizonoil.com.au
You can also read