ZOOPLUS AG Q1 2020 RESULTS - INVESTOR & ANALYST PRESENTATION 14 May 2020 - Munich - Dr. Cornelius Patt, CEO, Andreas Maueröder, CFO

Page created by Barry Thornton
 
CONTINUE READING
ZOOPLUS AG Q1 2020 RESULTS - INVESTOR & ANALYST PRESENTATION 14 May 2020 - Munich - Dr. Cornelius Patt, CEO, Andreas Maueröder, CFO
ZOOPLUS AG
Q1 2020 RESULTS
INVESTOR & ANALYST PRESENTATION
14 May 2020 – Munich – Dr. Cornelius Patt, CEO, Andreas Maueröder, CFO
ZOOPLUS AG Q1 2020 RESULTS - INVESTOR & ANALYST PRESENTATION 14 May 2020 - Munich - Dr. Cornelius Patt, CEO, Andreas Maueröder, CFO
SAFE HARBOR STATEMENT

This document includes supplemental financial measures that are or may be non-GAAP financial measures. These supplemental financial measures
should not be viewed in isolation as alternatives to measures of zooplus’ financial condition, results of operations or cash flows as presented in
accordance with IFRS in its Consolidated Financial Statements. Other companies that report or describe similarly titled financial measures may
calculate them differently.

This document contains statements related to our future business and financial performance and future events or developments involving zooplus that
may constitute forward-looking statements. We may also make forward-looking statements in other reports, in presentations, in material delivered to
stockholders and in press releases. In addition, our representatives may from time to time make oral forward-looking statements. Such statements are
based on the current expectations and certain assumptions of zooplus’ management, and are, therefore, subject to certain risks and uncertainties. A
variety of factors, many of which are beyond zooplus’ control, affect zooplus’ operations, performance, business strategy and results and could cause
the actual results, performance or achievements of zooplus to be materially different from any future results, performance or achievements that may
be expressed or implied by such forward-looking statements or anticipated on the basis of historical trends. Further information about risks and
uncertainties affecting zooplus is included throughout our most recent annual and interim reports, which are available on the zooplus website,
investors.zooplus.com. Should one or more of these risks or uncertainties materialize, or should underlying assumptions prove incorrect, actual results,
performance or achievements of zooplus may vary materially from those described in the relevant forward-looking statement as being expected,
anticipated, intended, planned, believed, sought, estimated or projected. zooplus neither intends, nor assumes any obligation, to update or revise
these forward-looking statements in light of developments which differ from those anticipated.

Due to rounding, numbers presented throughout this and other documents may not add up precisely to the totals provided and percentages may not
precisely reflect the absolute figures.

                                                                                                                          Q1 2020 Results Presentation   2
ZOOPLUS AG Q1 2020 RESULTS - INVESTOR & ANALYST PRESENTATION 14 May 2020 - Munich - Dr. Cornelius Patt, CEO, Andreas Maueröder, CFO
PET FOOD IS AN ESSENTIAL CATEGORY TO PET OWNERS –
COMPETING CHANNELS (GROCERY, SPT) OPERATIONAL

                                               Q1 2020 Results Presentation   3
ZOOPLUS AG Q1 2020 RESULTS - INVESTOR & ANALYST PRESENTATION 14 May 2020 - Munich - Dr. Cornelius Patt, CEO, Andreas Maueröder, CFO
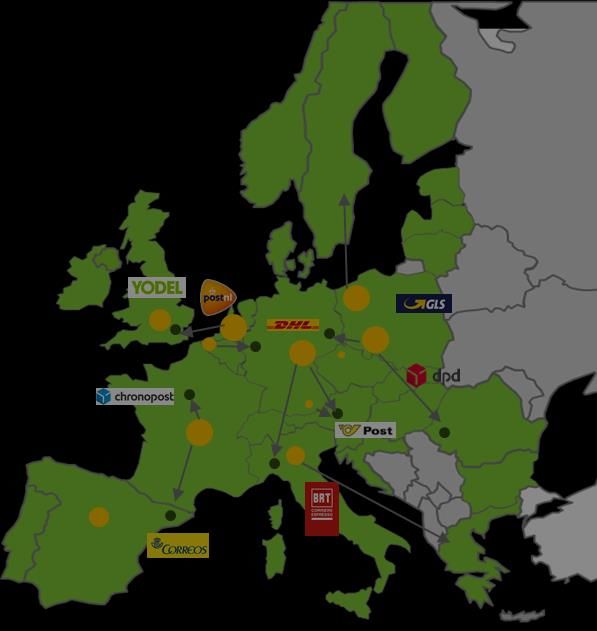
ZOOPLUS PRIORITIES DURING COVID-19

KEY PILLARS OF ZOOPLUS CRISIS MANAGEMENT

      SAFETY FIRST FOR TEAM & PARTNERS

           PRIORITY FOR OUR LOYAL CUSTOMER BASE

              AVAILABILITY OF PRODUCTS AND SERVICES

                  FINANCIAL STABILITY OF OUR BUSINESS
                                              Q1 2020 Results Presentation   4
ZOOPLUS AG Q1 2020 RESULTS - INVESTOR & ANALYST PRESENTATION 14 May 2020 - Munich - Dr. Cornelius Patt, CEO, Andreas Maueröder, CFO
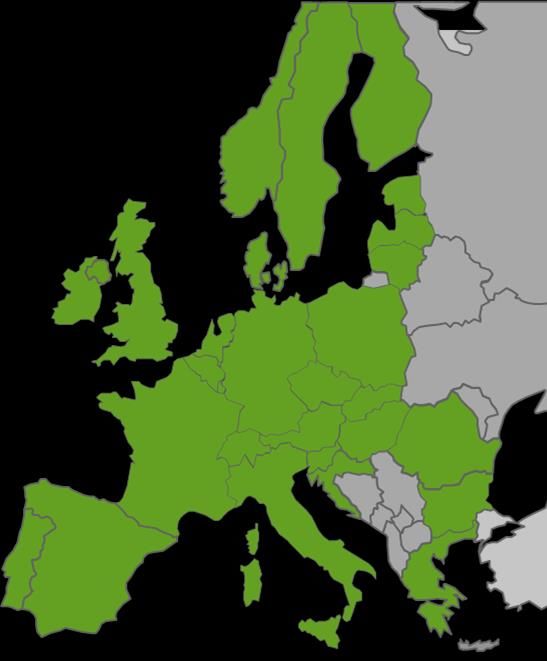
Q1 2020 RESULTS
 PRESENTATION
   Q1 2020 Investor & Analyst Call
ZOOPLUS AG Q1 2020 RESULTS - INVESTOR & ANALYST PRESENTATION 14 May 2020 - Munich - Dr. Cornelius Patt, CEO, Andreas Maueröder, CFO
SALES VOLUME INCREASED BY EUR 77m IN Q1 2020
GROWTH ACCELERATED
SALES (in € m)
                           vs. Q1 2019
                                                                              o zooplus benefits from strong online
                               +21%
                           FX-adjusted +22%                   440               demand in the pet supplies segment
                                               419
                                                                                in Q1 2020
    363           363          378
                                                                   + 77m      o Strong y-o-y development affirms
                                                                  vs. Q1 19
                                                  + 52m                         successful efforts on improving
                                                 vs. Q4 18
                                                                                customer activation and sales
                                                                                retention combined with solid sales
                                                                                execution

                                                                              o Demand remains robust well into the
                                                                                first part of Q2 2020, with April
  Q1 2019        Q2 2019    Q3 2019           Q4 2019        Q1 2020            growing +17% y-o-y
                                                                                               Q1 2020 Results Presentation   6
ZOOPLUS AG Q1 2020 RESULTS - INVESTOR & ANALYST PRESENTATION 14 May 2020 - Munich - Dr. Cornelius Patt, CEO, Andreas Maueröder, CFO
SALES RETENTION RATE CLIMBS TO 94% IN Q1 2020
ROBUST DEMAND FROM LOYAL CUSTOMERS
SALES RETENTION RATE1

                                                                                    o Loyal customer business in Q1 2020
                                                                                      boosting sales retention rate
                                                                           94%      o Corona crisis driving demand of pet
      93%                        92%
                                                       91%       91%                  food across all cohorts

                                                                                    o Positive development also reflecting
                                                                                      successful initiatives to improve early
                                                                                      stage loyalty and reactivation

                                                                                    o Decline of sales retention rate halted
                                                                                      in mid 2019, first signs of
  Q1 2019                    Q2 2019                  Q3 2019   Q4 2019   Q1 2020     improvement as of end of Q3 2019

1) Sales retention 12 months rolling (net, non-BMF)
                                                                                                      Q1 2020 Results Presentation   7
ZOOPLUS AG Q1 2020 RESULTS - INVESTOR & ANALYST PRESENTATION 14 May 2020 - Munich - Dr. Cornelius Patt, CEO, Andreas Maueröder, CFO
ZOOPLUS IS ONLINE MARKET LEADER IN EUROPE -
GAINING SHARE FROM OFFLINE
               TOTAL MARKET SHARE1                                                         ZOOPLUS SALES BY REGION IN Q1 2020 (in € m)

                     8%                                  DACH                                                                           128                                                                     +23%

                     6%                                        FR                                          72                                        +19%

                     9%                            BENELUX                                    48                           +18%
                                                                                                                                                                  Pet supplies market1
                    14%2                                       PL                                                   +32%
                                                                                            42
                                                                                                                                           EUR 25.3 bn
                     3%                                UK , IE                         34                   +20%

                     4%                                         IT                     34                   +18%

                     5%2                                    CEE
                                                    other than PL
                                                                                      32                 +32%

                      6%                           NORDICS                        26               +12%

                      5%                                 ES,PT                   24                +12%
1) Total net market = online + offline market, based on Euromonitor International 2020 and management estimates as of March 2020 in relation to zooplus FY 2019 sales figures; 2) change vs . prior disclosure due to updated market data
reflecting an overall larger total market in Poland and CEE; zooplus continues to outperform total market growth in respective markets.                                                          Q1 2020 Results Presentation               8
GROSS MARGIN IMPROVES IN Q1 2020 VS. PY

GROSS MARGIN1

                                                            +1.2p%             o Continued retail price stabilization
                                                                                 across food segments
                                                                     29.4%
                                             28.2%
                                                                               o Solid Yield Management focusing on
                                                                                 loss leaders (avoidance) supports
                                                                                 development of gross margin

                                                                               o Continued growth trend in own brand
                                                                                 sales improves product mix and
                                                                                 margins

                                           Q1 2019                   Q1 2020

1) Gross margin = sales – cost of goods (as a % of sales)
                                                                                                Q1 2020 Results Presentation   9
OWN BRANDS PORTFOLIO CONTINUES TO
OUTPERFORM
OWN BRAND SALES & SALES SHARE FOOD & LITTER (in € m)

                       vs. Q1 2019
                         +34%
                                                 64
                                       61
                          52
    48         49
                                                         o High-margin business in the mid to
                                                           premium segment contributing to
                                                           gross margin expansion
                                     16.7%     16.5%
                        15.9%                            o Growth index own brands / food
  15.3%      15.6%
                                                           1.4 in Q1 2020

 Q1 2019    Q2 2019     Q3 2019      Q4 2019   Q1 2020
                                                                         Q1 2020 Results Presentation   10
LOYALTY TOOLS DRIVING REACTIVATION AND
EARLY STAGE CUSTOMER RETENTION

         SaverPlan                           zooPoints                      zooplus APP

          Aiming at                           Aiming at                   Aiming at customers
      customers seeking                   customers seeking                    seeking
       value for money                       engagement                   seamless experience
    Locking in a permanent discount         1 € spent on zooplus                   App rating
    for all orders as part of the paid        = 1 zooPoint for
         SaverPlan membership
                                                reward shop                      4.8 stars out of 5

       ~ 45% of total group sales;         Up to 20% uplift on average    Shifting customers to sticky
    Uplift in average customer sales      sales and #orders, customers   mobile traffic allows for a more
     of up to 40% after subscribing      redeeming vs. non-redeeming,    personalized user experience,
               to Saver Plan                high usage rate and reach     14% order share in FY 2019

                                                                                     Q1 2020 Results Presentation   11
NEW CUSTOMER GROWTH IN LINE WITH EXPECTATION –
FOCUS ON EFFICIENCY AND ACCOUNT QUALITY
REGISTERED NEW CUSTOMERS (in k) IN RELATION TO MARKETING SPEND (% OF SALES)

                                                              o New customer acquisition confirms
                                     823                        offline to online migration trend
    746                   761                   747
               723                                            o Strong organic new customer growth
                                                                from March on confirms zooplus’
                                                                positioning as Europe’s leading online
                                                                specialist retailer for pet supplies
              3.8%       3.5%       3.3%                      o Efficiency focus on marketing to
   2.7%
                                               2.2%
                                                                rebalance CAC and CLV

  Q1 2019    Q2 2019    Q3 2019    Q4 2019    Q1 2020

                                                                               Q1 2020 Results Presentation   12
FOLLOW ON ORDERS CONFIRM IMPROVED
 SALES VALUE OF NEW CUSTOMERS

                                                                     o Improved early stage cohort behavior
Q1 2020            Total new customer sales volume            +5%
                                                                       compared to Q1 2019 cohort reflecting
                                                                       better customer proposition and
Q1 2019
                                                                       refined retention & loyalty driving
                                                                       measures
                                                                     o Total new customer sales volume
                                                                       increasing y-o-y
Q1 2020   Total new customer sales volume from 2nd order on   +16%
                                                                     o Consecutive order sales volume with
                                                                       strong increase signalizing better
Q1 2019
                                                                       account retention and higher baskets

                                                                                     Q1 2020 Results Presentation   13
WE ARE THE ONLY CATEGORY SPECIALIST WITH A
PAN-EUROPEAN LOGISTIC NETWORK

    RECORD ORDER INTAKE
    (+60% ABOVE AVERAGE AT PEAK)
                                       March 2020 order intake

    DESIRE TO PROTECT THE LOVED ONES
    SECURING HEALTH & WELLBEING
                                              +10d*

    ISSUES OF AVAILABILITY OF
    CONSUMER STAPLES                    *extra days on top
                                        of normal network
                                              output

                                                                 Q1 2020 Results Presentation   14
WE ARE THE ONLY CATEGORY SPECIALIST WITH A
PAN-EUROPEAN LOGISTIC NETWORK
                                                                   Fulfillment center (FC)
RESILIENCE ADVANTAGE OF ZOOPLUS: SCALE                             Hubs (DSP) - shown are selected
                                                                   relations from FC to Hub of DSPs

     TECH DRIVEN CAPACITY & REPLENISHMENT

     FCs RUNNING AT FULL OUTPUT

     SHELF SPACE FOR STOCKING UP

     PRODUCT AVAILABILITY

     COMPETITIVE DELIVERY TIME

11 FULFILMENT CENTERS ACROSS EUROPE KEEPING DISRUPTION AT A MINIMUM
                                                       Q1 2020 Results Presentation             15
STEERING TOWARDS MORE EFFICIENT
   TERRITORY IN MARKETING & LOGISTICS
   COST STRUCTURE (IN % OF SALES)

                                                                                      o Reduced marketing spend vs. PY –
Advertising / Marketing                            2.7%                      2.2%
                                                                                        move into more efficient territory

                                                                                      o Larger baskets prompting for higher
                                                                                        value per parcel, offsetting additional
                        Logistics               18.7%                       18.0%
                                                                                        cost for stock shifting between FCs to
                       Payment1                                                         safeguard local availability and higher
                                                   1.1%                      1.1%
                                                                                        FC capacity costs
                 IT/Admin                                                    2.7%
                                                   1.9%                               o Increase in IT/ Admin cost base
                Personnel2
                                                   3.5%                      3.4%
         FX gains & losses                                                              reflecting higher non operating
                                                   0.0%                      0.5%
                                               Q1 2019                      Q1 2020     expenses for strategic projects
   1) Impairment expenses on financial assets reclassified to payment
   2) Including LTI & SOP; own work capitalized reclassified to personnel                              Q1 2020 Results Presentation   16
EBITDA DRIVEN BY YIELD MANAGEMENT & EFFICIENCY,
SOLID FREE CASHFLOW IN Q1 2020
EBITDA (in €)                       CASH FLOW 2020 (in €)
                +5.9m
                 (in €)
                                           41.5m
                           8.1m
                                                            -1.1m           40.4m

         2.2m
                                         of which 15.1m
                                            from stock
                                             decrease

      Q1 2019             Q1 2020      Cash flow from    Cash flow     Free cash flow
                                         operating    from investing
                                          activities     activities     Q1 2020 Results Presentation   17
GUIDANCE 2020
Updated on May 7, 2020
     Q1 2020 Investor & Analyst Call
UPDATED FINANCIAL YEAR 2020 OUTLOOK
ZOOPLUS INCREASES TARGETS AMIDST ROBUST CONSUMER DEMAND

    SALES GROWTH (in €)                             EBITDA (in €)
                      aprox 225m             positive to          at least 20m
                                               neutral
    at least 180m                              range,
                                              below PY

         2020           2020E                    2020                   2020E
     March 25, 2020    May 7, 2020           March 25, 2020           May 7, 2020

      UPDATED THE FINANCIAL YEAR 2020 OUTLOOK ON MAY 7, 2020
                                                              Q1 2020 Results Presentation   19
Q&A
Q1 2020 Investor & Analyst Call
ZOOPLUS RECAP ON COVID-19
OPERATIONAL EXCELLENCE IN A TIME OF CRISIS

          RECORD ORDER INTAKE                                       RECORD No. OF INQUIRIES                            94%RETENTION
                                                                                                                             REVENUE
          (+60% above average at peak*)                          (+60% above average handled at peak**)                             RATE

     STRATEGIC MEASURES                                                                                      OPERATIONAL MEASURES
                                                                       PROTECT
       MARKETING & ACQUISITION                                                                                 DAILY SYNC WITH PARTNERS
       DELIVERY DELAY UPDATES                                                                                  INCREASED SAFETY MEASURES
       BULKY ACCESSORIES                                            LOYAL                                       FCs RUNNING AT FULL OUTPUT
       FOCUS ON LIQUIDITY                                       CUSTOMER BASE                                    RESTOCKING & AVAILABILITY

 MAINTAINING A LOYAL CUSTOMER BASE IS A KEYSTONE FOR FUTURE GROWTH
* Compared to Jan-Feb 2020 average of highest weekly order intake; ** Compared to daily average handled customer inquiries.   Q1 2020 Results Presentation   21
PROFIT & LOSS
Q1 2020
P&L
                                                                                                              Q1 2020                                Q1 2019*
in € m
                                                                                                     abs                                %         abs            %
Sales                                                                                                       439.9                       100.0%        363.2     100.0%
Other income                                                                                                    1.2                        0.3%          1.3       0.4%
Other gains/losses - net                                                                                       -2.1                       -0.5%          0.2       0.1%
Cost of materials                                                                                            -310.6                      -70.6%       -260.9     -71.8%
Personnel costs                                                                                               -15.0                       -3.4%        -12.6      -3.5%
Other expenses                                                                                               -105.3                      -23.9%        -88.9     -24.5%
  thereof logistics / fulfillment                                                                             -79.2                      -18.0%        -68.0     -18.7%
  thereof marketing                                                                                            -9.8                       -2.2%         -9.8      -2.7%
  thereof payment                                                                                              -4.7                       -1.1%         -4.0      -1.1%
  thereof other costs                                                                                         -11.6                       -2.6%         -7.1      -2.0%
Earnings before depreciation, interest and
taxes (EBITDA)                                                                                                  8.1                       1.8%          2.2      0.6%
Depreciation                                                                                                    -7.0                      -1.6%         -6.3      -1.7%
Financial income                                                                                                 0.0                       0.0%          0.0       0.0%
Financial expenses                                                                                              -0.4                      -0.1%         -0.4      -0.1%
Earnings before taxes (EBT)                                                                                     0.7                       0.2%         -4.5      -1.2%
Taxes on income                                                                                                 -1.2                      -0.3%          1.0      0.3%
Consolidated net result                                                                                        -0.5                      -0.1%         -3.5      -1.0%
Differences from currency translation
                                                                                                                -0.1                      0.0%           0.0       0.0%
Hedge reserve                                                                                                    0.8                      0.2%          -0.3      -0.1%
Items that may be relclassified subsequently
to profit or loss                                                                                               0.7                       0.2%         -0.3      -0.1%
Comprehensive income                                                                                            0.2                       0.0%         -3.8      -1.0%
Earnings per share in €
 basic                                                                                                        -0.07                           -        -0.50          -
 diluted                                                                                                      -0.07                           -        -0.50          -

*The previous year's figures have been adjusted. Gains and losses from foreign currency valuation in the amount of EUR 952,357.61 and                                                                    22
                                                                                                                                                                          Q1 2020 Results Presentation
EUR – 777,273.84 were reclassified from other income or other expenses to other gains/(losses) - net.
BALANCE SHEET AS OF MARCH 31 2020

Assets                                                                    Equity and Liabilities

in € m                          March 31st. 2020 Dec. 31st. 2019 Δ abs    in € m                                        March 31st. 2020    Dec. 31st. 2019         Δ abs

A.       Non-current assets                                               A.         Equity
                                                                          I.         Capital subscribed                              7.1                     7.1      0.0
I.       PP&E                                5.6             5.5    0.1
                                                                          II.        Capital reserves                              103.3                  102.8       0.5
II.      Intangible assets                  12.2            12.8   -0.6
III.     Right-of-use assets                77.6            81.0   -3.4   III.       Other reserves                                 -1.3                    -2.0      0.7
                                                                          IV.        Profit/Loss carried forward                    -7.7                    -7.2     -0.5
IV.      Deferred tax assets                  2.3            3.6   -1.3
                                                                                     Total equity                                 101.4                  100.8        0.6
         Total non-current
                                            97.7          102.9    -5.2   B.         Non-current liabilities                        57.1                   61.8      -4.7
         assets
B.       Current assets                                                   C.         Current liabilities
I.       Inventories                       102.6           117.7 -15.1    I.         Accounts payable                              142.6                  125.1      17.5
II.      Advance payments                    0.0             0.0   0.0
                                                                          II.        Borrowings                                     20.0                     0.0
III.     Accounts receivable                29.7            27.7   2.0
                                                                          III.       Derivative financial instruments                0.0                     0.4     -0.4
IV.      Other current assets               54.3            47.7    6.6
                                                                          IV.        Other current liabilities                      34.4                   31.8       2.6
VI.      Tax receivables                      0.6            0.6    0.0
         Derivative financial                                             V.         Contract liabilities                           17.7                   14.0       3.7
VII.                                          0.8            0.0    0.8
         instruments                                                      VI.        Tax liabilites                                  0.2                     0.2      0.0
         Cash and cash                                                    VII.       Lease liabilities                              21.5                   20.4       1.1
VIII.                                      118.3            64.3   54.0
         equivalents                                                      VIII.      Provisions                                      9.1                     6.5      2.6
         Total current assets              306.3          258.1 48.2                 Total current liabilities                    245.5                  198.4       47.1
                                           404.0          361.0 43.0                                                              404.0                  361.0       43.0
                                                                                                                                     Q1 2020 Results Presentation    23
CASH FLOW STATEMENT
Q1 2020

in € m                                                                                                                                Q1 2020                     Q1 2019*
EBT                                                                                                                                     0.7                         -4.5
Cash flow from operating activities                                                                                                        41.5                     11.9
Cash flow from investing activities                                                                                                         -1.1                    -1.4
Free cash flow                                                                                                                             40.4                     10.5
Cash flow from financing activities                                                                                                        14.1                     -4.9
Currency effects on cash and cash equivalents                                                                                               -0.5                    0.0
Net change of cash and cash equivalents                                                                                                    54.0                     5.6
Cash on hand, bank deposits                                                                                                               118.3                     65.2

 The previous year's figures have been adjusted. Please refer to section 2.1.1 of the notes to the consolidated financial statements in the Annual Report 2019.

                                                                                                                                                                             Q1 2020 Results Presentation   24
Q&A
Q1 2020 Investor & Analyst Call
You can also read