A Comparative Study of Commercial ATP Hygiene Monitoring Systems
←
→
Page content transcription
If your browser does not render page correctly, please read the page content below
A Comparative Study of Commercial
                                                                        ATP Hygiene Monitoring Systems

Abstract
The performance of 5 leading commercially available of ATP hygiene
monitoring systems were compared in the largest independent study of its kind.
Linearity, Sensitivity, Repeatability, Precision and Accuracy are the major
requirements of an effective ATP system. These performance criteria were
determined using many replicates and dilutions of ATP, foodstuffs and micro-
organisms.
The findings indicate that some of the systems show large variations and
background interference which significantly affects their ability to meet the
performance criteria.
The best system was revealed to be Hygiena SystemSURE Plus and the
poorest systems were Charm Novalum and Neogen Accupoint.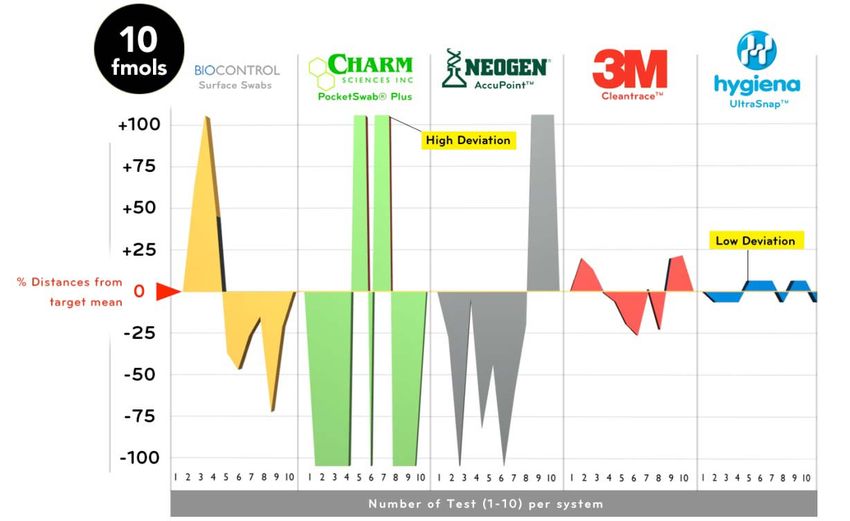
Overview

1.   Scope of the study
2.   Components of an ATP system                            Disclaimer:
                                                            This presentation was prepared by Hygiena and is
3.   Performance results based on studies criteria
                                                            solely based on data generated from the comparative
           Section 1: ATP performance results               study of ATP hygiene monitoring systems by Silliker
           Section 2: Foodstuffs performance results        Inc. Food Science Center Report RPN 13922
           Section 3: Micro-organisms performance results   (2010).This presentation contains all the conclusions
4.   Universal ATP device performance – Snapshot            drawn by Silliker and further detailed analysis of the
                                                            raw data. Silliker Inc supports all claims made in its
5.   Summary
                                                            report RPN 13922 however the additional data
6.   Information links                                      analysis has not been verified by Silliker Inc.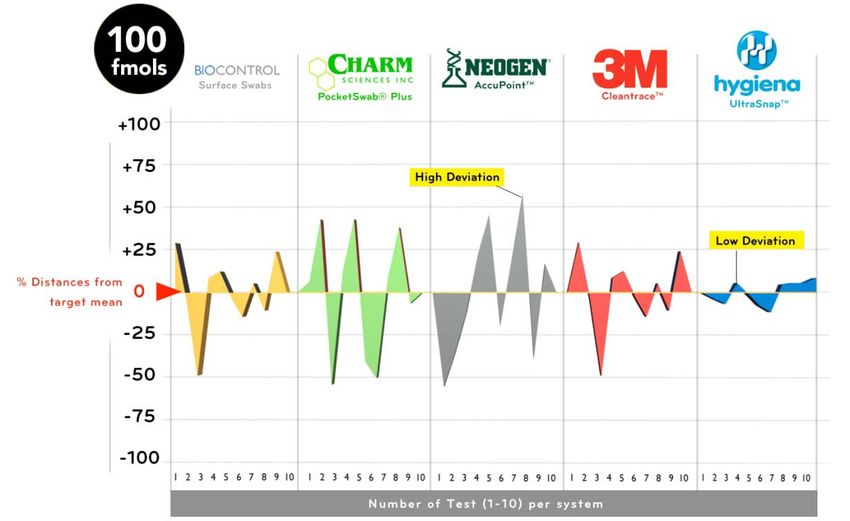
Scope of the Study:
Determine the performance of leading systems for the
detection of ATP, foodstuffs and microorganisms

Purpose & Intent for ATP Hygiene Monitoring                                Performance Criteria
                                                                           The key performance criteria evaluated were:
The purpose of ATP bioluminescence for hygiene                             1. Linearity
monitoring is to provide a simple, rapid, direct, objective                2. Sensitivity
test for cleaning verification. It is a sophisticated, sensitive           3. Repeatability
indicator test to instantly determine the hygienic status and              4. Accuracy
potential risk of the object being sampled.
                                                                           These performance criteria were determined by
Unlike microbiological tests that take days to yield results,              experimentation in controlled laboratory
ATP testing provides valuable information in seconds. The                  conditions using 3 sample types;
results from ATP surface hygiene monitoring are different
to those of microbial enumeration methods and give                         1. ATP dilutions pipetted directly to the swab bud
additional information that the microbial test cannot
provide.                                                                   2. Dilutions of foodstuff: pipetted directly to the swab bud
                                                                              and tested on wet & dried-on stainless steel surfaces.
ATP tests are not intended to replace microbial tests.
However there is concurrent direct correlation between the                 3. Dilutions of microbial cultures typical of those of
results of the two methods because cleaning                                   concern to food & beverage processors including:
simultaneously removes both organic residues and                              Escherichia coli, Lactobacillus plantarum,
microbes.                                                                     Pseudomonas aeruginosa, Salmonella typhimurium and
                                                                              Staphylococcus aureus and one yeast culture,
                                                                              Saccharomyces cerevisiea.

                               A Comparative Study of Commercial ATP Hygiene Monitoring Systems
                               Based on Data Generated by Silliker Group Inc.

                                                                                                                                          Page 3
ATP Detection Systems:
       Three key components make up a system

     An ATP system consist of 3 components.
     Each component is a critical aspect of overall performance.
1. Instrument – Luminometer (2 types were evaluated)                              3. Reagent Swab Device – Design & Wetting Agent
       - Photodiode: sensitive, robust, requires low voltage,
        does not drift with time. It is low cost and has low                              - ATP test device design and components play
        background noise†.                                                                  important roles in performance and cost per test.
       - Photomultiplier Tube: Sensitive, fragile, requires high                         - ATP test devices are pre-wetted with an extractant
        voltage, drifts with time . It is expensive and has high                           to break up biofilms, collect and release ATP from
        background noise.
                                                                                           a sample.
                                                                                         - Four of the test devices tested used woven swab
2. Bioluminescent Chemistry (2 variations were evaluated)
                                                                                           tips and one used a sponge like tip (Neogen).
       - Liquid stable chemistry – new technology allows for
        immediate reaction with sample, gives greater precision,
        accuracy, and more consistency. Less manufacturing
        processes and therefore has lower cost.                                   Five Commercial ATP Systems Used In Study
       -Lyophilized chemistry – old technology ( >30 years)
                                                                                  ¾BioControl Lightning MVP & Surface sample devices
        requires complex expensive manufacturing, dry storage
                                                                                   Photomultiplier tube based system / lyophilized chemistry / woven
        and rehydration at point of use that has larger variability.
                                                                                   swab

        All chemistry uses luciferase/luciferin enzymes to                        ¾Charm Science Novalum & Pocketswab Plus
         generate light. The quality and quantity of the enzymes                   Photomultiplier tube based system / lyophilized chemistry / woven
         and the other components determine the performance of                     swab
         the chemistry.
                                                                                  ¾ Hygiena SystemSURE Plus with Ultrasnap & Supersnap devices
                                                                                    Photodiode based system / liquid stable chemistry / woven swab
     † Background noise is light or electrical interference from the instrument
     or reagent swab device that causes a system to give a RLU reading in         ¾Neogen AccuPoint instrument and surface sampler
     the absence of ATP. High background noise is commonly seen with               Photodiode based system /lyophilized chemistry / sponge swab
     photomultiplier tube machines. Some machines like the Charm Novalum
     deal with this by building in a background deduction algorithm. This         ¾ 3M UniLite NG CleanTrace and CleanTrace swabs
     reduces sensitivity. Other systems convert RLU to log RLU units (or            Photomultiplier based system / liquid stable chemistry / woven
     zones) to disguise the high background and variation. Signal –
                                                                                    swab
     Background Noise = True and Meaningful result
                                                                                                                                                       Page 4
Performance Criteria:
                 Linearity, Sensitivity, Repeatability, and Accuracy

                                                                                                  Repeatability: Variation between measurements by the same
                                                                                                  operator using the same test sample. Expression of consistency
          Linearity: Expression of predictability and reliability of the result.                  and reliability of results.

                  Good Linearity r > 0.90                  Poor Linearity r < 0.80                         Good Repeatability                 Poor Repeatability
Signal

                    Contamination                                Contamination

               Sensitivity: Smallest amount that can be detected above the                           Accuracy: Recovery and detection of all available ATP in the sample.
               background of the system i.e. Limit of Detection (LoD)
                                                                     High Background
                      Low Background
                                                                     Poor Sensitivity
                      Good Sensitivity
                                                                                                                 Accurate                     Inaccurate

                                                                     LoD

         LoD

                 Blank (no sample)   Sample Present      Blank (no sample)   Sample Present

                                                      A Comparative Study of Commercial ATP Hygiene Monitoring Systems
                                                      Based on Data Generated by Silliker Group Inc.

                                                                                                                                                                       Page 5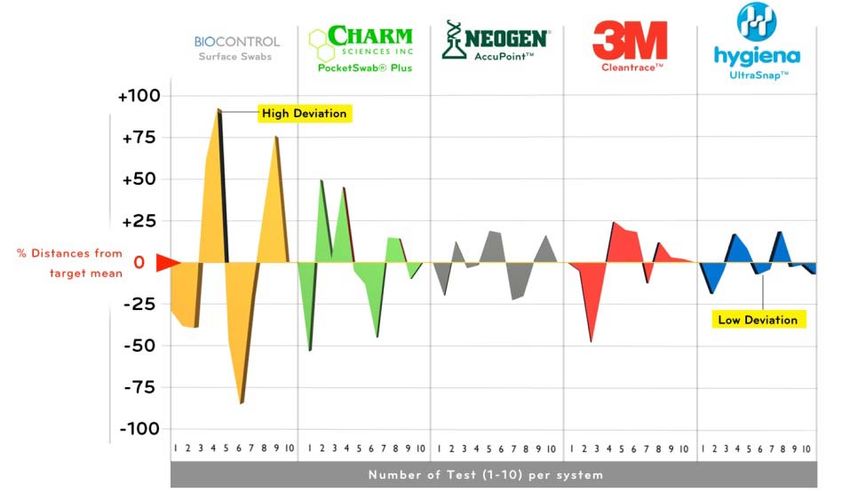
Linearity:
Expression of predictability and reliability of the result

                                                                                Graph
                                                                                The linearity graph shows a direct, proportional, straight-
                                                                                line relationship between RLU and ATP.
                                                                                                  y = mx + c
                                                                                where ‘y’ = RLU and ‘x’ = ATP, and both increase in a
                                                                                constant predictable way. This means precise, reliable
                                                                                detection of low ATP levels at low RLU values.
                                                                                Linearity is described by the term Correlation Coefficient (r)
                                                                                which shows how well the data approaches the perfect fit
                                                                                i.e. r = 1.000

                                                                                Best Performance
                                                                                BioControl, Hygiena & 3M all showed good linearity for
                                                                                the detection of ATP r = 0.94 – 0.98

                                                                                Poor Performance
                                                                                Neogen & Charm systems were not linear at low ATP
                                                                                levels; both systems displayed 0 RLU in the presence of
                                                                                ATP detected by other systems

                                                                                Data located in Table 7 and 13 of Silliker report and Appendixes A, B, C

                             A Comparative Study of Commercial ATP Hygiene Monitoring Systems
                             Based on Data Generated by Silliker Group Inc.

                                                                                                                                                           Page 6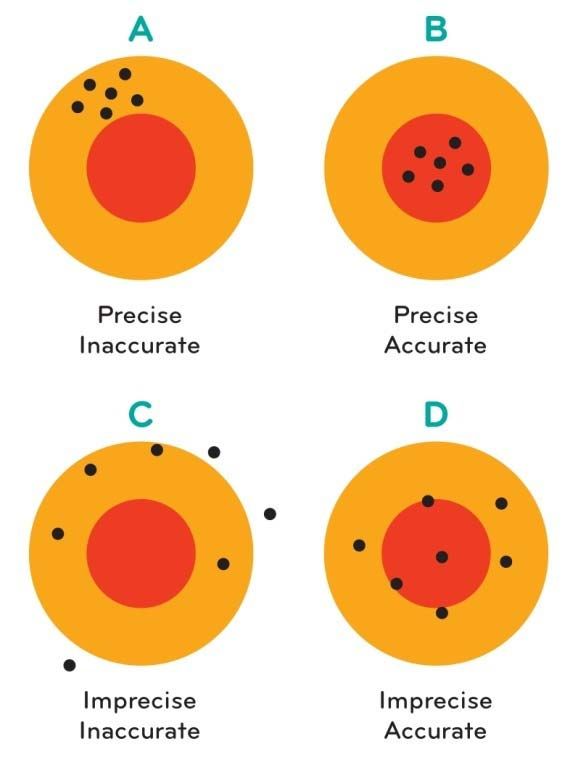
Sensitivity:
              Smallest detectable amount of sample

                                                                                                    Graph
                                                                                                    Sensitivity is defined as the Limit of Detection. It is the smallest
                                                                                                    amount detectable above the background of the system.

                                                                                                    Background noise is the signal detected by the systems in the
                                                                                                    absence of ATP that can come from both the instruments (as
                                                                                                    electrical interference) and the reagent swab devices ( as
                                                                                                    chemical interference from impurities).

                                                                                                    Signal – Background Noise = True meaningful result
                                                                                                    A low background noise means a clear signal with little
                                                                                                    interference that enables the detection of the lowest amount of
                                                                                                    sample i.e. maximum sensitivity.
                                                                                                    The graph shows the limit of detection (LoD) for each ATP test
                                                                                                    system

                                                                                                    Best Performance
                            Low Background                              High Background             Hygiena SystemSURE Plus & Supersnap – LoD = .017 fmols
                            Good Sensitivity                            Poor sensitivity
                                                          Meaningful
                                                          data starts
                                                          here
                                                                                                    Average Performance
Meaningful
data starts                                                             LoD                         BioControl Lightning MVP & MVP swabs - LoD ~ 1.0
here                                                                                                Hygiena SystemSURE Plus & Ultrasnap - LoD ~ 1.0
              LoD                                                                                   3M NG & CleanTrace - LoD ~ 1.0

                                                                                                    Poor Performance
                                                                                                    Charm Novalum & Pocketswab Plus - LoD = 10.0
                                                                                                    Neogen Accupoint & Accupoint swabs - LoD = 10.0
                    Blank (no sample)    Sample Present      Blank (no sample)     Sample Present

                 Background noise is the signal detected by the system when a blank device
                 is tested i.e. no sample present. High background causes poor sensitivity.
                 Some systems like the Charm Science Novalum build in a background                  Data located in Table 11, 12 and 13 of Silliker report and Appendixes A, B, C
                 deduction algorithm to compensate for the high background noise.

                                                                                                                                                                                Page 7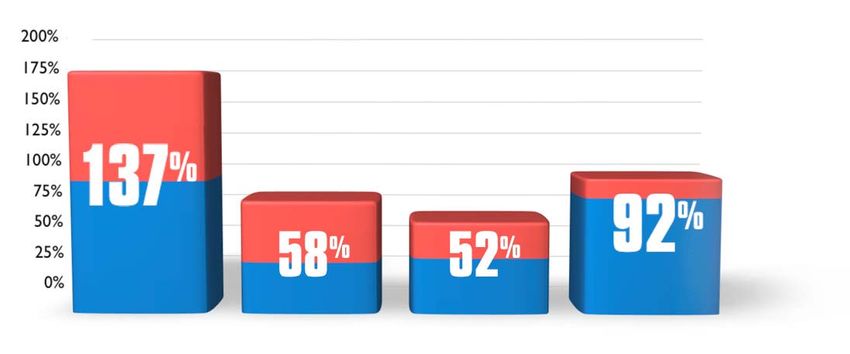
Repeatability:
                                                                              Variation is described by the term Coefficient of Variation (CV%).
Variation between measurement by the same operator using                      The higher the CV% then the greater the variability which means
the same test sample                                                          the results is less consistent and more unreliable.

                                                                              The overall variation across the whole range of ATP
                                                                              measurements show;

                                                                              Best Performance
                                                                              Hygiena and Supersnap – CV = 9

                                                                              Average Performance
                                                                              3M = 26% CV
                                                                              Hygiena and Ultrasnap = 28%CV
                                                                              BioControl = 39% CV

                                                                              Poor Performance
                                                                              Charm Science = 86% CV
                                                                              Neogen = 123% CV

                                                                              Greater differences between systems were highlighted when
                                                                              further analysis was performed. See graphs opposite.

                                                                              Recommended Pass / Fail limits are usually set between 10 and
                                                                              100 fmols ATP so good repeatability is essential at these critical
                                                                              values.
                                                                              The graphs opposite show that Hygiena is the only system with
                                                                              low deviation which means it delivers the most reliable,
                                                                              consistent and dependable results.

                                                                              This is particularly important where the highest standards of
                                                                              quality and safety requires the detection of very low levels of
                                                                              ATP ( see next page).

                                                                              Data located in table 9 and 10 of Silliker report and raw data in Appendix C.

                        A Comparative Study of Commercial ATP Hygiene Monitoring Systems
                        Based on Data Generated by Silliker Group Inc.

                                                                                                                                                              Page 8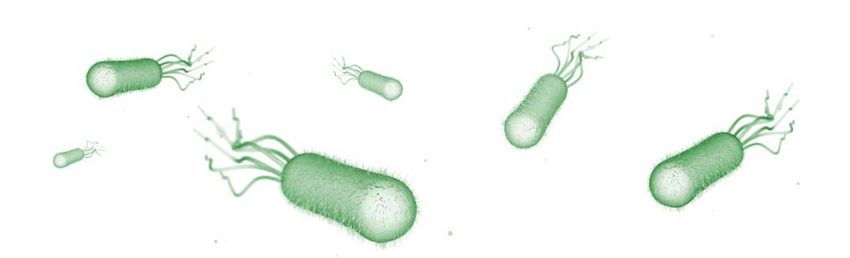
Repeatability:
At critical limits

                                                                           High standards of cleanliness are required for high care
                                                                           production processes where safety and quality are of
                                                                           paramount importance.
                                                                           Under these circumstances, the reliable      and precise
                                                                           detection of low levels of ATP is essential.

                                                                           The graphs opposite reveals large variations and differences
                                                                           between systems at low ATP values (10fmols) that are
                                                                           essential for high specific cleaning duties.

                                                                           Best Performance
                                                                           Hygiena and Supersnap – CV = 7%CV

                                                                           Average Performance
                                                                           Hygiena and Ultrasnap = 10%CV
                                                                           3M = 17% CV

                                                                           Poor Performance
                                                                           BioControl = 53% CV
                                                                           Neogen = 116% CV
                                                                           Charm Science = 214% CV

                                                                           The graphs show that only Hygiena SystemSURE Plus can
                                                                           consistently deliver dependable results at low ATP levels.

                                                                           Data located in table 9 and 10 of Silliker report and raw data in Appendix C.

                     A Comparative Study of Commercial ATP Hygiene Monitoring Systems
                     Based on Data Generated by Silliker Group Inc.

                                                                                                                                                           Page 9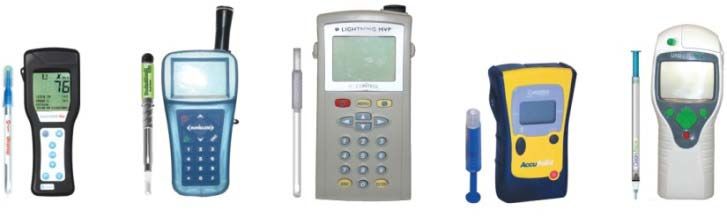
Accuracy:
Recovery and detection of all available ATP to reflect the
true value of the sample

                                                                                         ATP (at 100 fmols) was added to each test device and
                  Recovery of ATP on Swab (%)                                            measurements were made (using 10 replicates) to
                                                                                         determine how much of the available sample was
                                                                                         actually detected. If 100% of the ATP was detected
                                                                                         then the system is accurate and gives a true
                               High Variability                                          meaningful results.

                                     Low Variability                                     The best system will be closest to 100%

                                                                                         Less than 100% means that only part of the sample
                                                                                         was detected due to some interference within the
                                                                                         system. This means that the system does not give a
                                                                                         true result and is not accurate.
     BioControl            Charm                  3M            Hygiena
                                                                                         Best Performance
                                    Variation
                                                                                         Hygiena – 92% recovery

                                                                                         Average Performance
  Note: Neogen Accupoint was not a part of this section of the study because of          BioControl – 71 to 137% recovery ( highly variable)
  the design of the test device. Performance in the other sections of the study
  indicate that recovery of sample would be poor.                                        Worst Performance
                                                                                         3M – 52% recovery
                                                                                         Charm Science – 58% recovery

                                                                                           Data located in figure 2 page ‘26’ of the Silliker report

                                A Comparative Study of Commercial ATP Hygiene Monitoring Systems
                                Based on Data Generated by Silliker Group Inc.

                                                                                                                                                       Page 10
Precision and Accuracy:
Recovery and detection of all available ATP to give consistent reliable
results closest to the true value
Graph
The illustration opposite is used to describe the
performance of a test and it shows how
precision and accuracy are linked. It is important
that they are considered together.
Better precision and accuracy means more
Hygiena consistent and reliable results that are closest to
3M the true value.
The Hygiena system was the only system to be
both precise and accurate.
Best Performance
Hygiena SystemSURE Plus & Ultrasnap
displays precise, accurate results.
Average Performance
BioControl Lightning MVP & MVP swab
Charm & Neogen BioControl displays accurate results, but is not precise.
3M NG & CleanTrace system is precise but only
recovered 52% of the sample and is not
accurate.
Worst Performance
Charm Novalum & Pocketswab Plus display
imprecise and inaccurate results.
Neogen Accupoint & Accupoint swabs display
imprecise and inaccurate results.
A Comparative Study of Commercial ATP Hygiene Monitoring Systems
Based on Data Generated by Silliker Group Inc.
Page 11Results Summary:
ATP detection looking at linearity, variability, repeatability & sensitivity
System Linearity Output (RLU) Variability Sensitivity Performance Linearity Sensitivity Repeatability Accuracy
(r) Blank Maximum Overall Limit of
(Background (at 1000 Average detection Best Hygiena Hygiena Hygiena Hygiena
at zero ATP) fmols ATP ) (CV%) (fmols ATP) Performance BioControl
3M
BioControl Lightning 0.982 283 975,941 39 1.1 Charm
MVP with Neogen
Lightning swab
Average BioControl 3M BioControl
3M UniLite NG with 0.988 4.3 7386 26 1.3
CleanTrace swab Performance 3M BioControl
Charm Novalum with 0.949 0** 418,517 * 86 10.0 Worst Charm Charm Charm
Pocketswab Plus Performance Neogen Neogen Neogen
3M
Hygiena SystemSURE 0.988 0† 1589 28 1.0
Plus with Ultrasnap
swab
Hygiena SystemSURE 0.987 0† 4949 9 0.17
Plus with Supersnap
swab New Technology, better system design =
Neogen AccuPoint with 0.976 0** 15,649 * 123 10.0
BETTER PERFORMANCE
Accupoint swab
High RLU output does not give better sensitivity or performance
* does not detect below 10 fmols at which level the instrument shows 0 RLU.
** not a genuine zero reading (limited instrument output)
† SystemSURE Plus is the only system with genuine low background that is linear
to zero RLU
A Comparative Study of Commercial ATP Hygiene Monitoring Systems
Based on Data Generated by Silliker Group Inc.
Page 12Section 2:
Detection of Foodstuffs
Evaluation of ATP systems in a simulated Food & Beverage
Food Type: Ground beef or Pasteurised Milk environment. This is just one industry that ATP systems are used to
monitor hygiene and contact surfaces.
System Dilution of foodstuff detected
Background Information:
4 food items were chosen for this section of the study.
Biocontrol Lightning MVP & swabs •Pasteurised milk
•Ground beef
3M UniLite NG & CleanTrace •Orange juice
•Mixed green salad
Charm NovaLum & Pocketswab Plus
4 food items were made into liquid suspensions and also dried on to
a stainless steel surface to test for pickup and extraction capabilities.
Neogen AccouPoint & Swabs
Results:
Hygiena SystemSURE Plus & Ultrasnap
Performance Linearity Sensitivity Repeatability Accuracy
Hygiena SystemSURE Plus & Supersnap
Best Hygiena Hygiena Hygiena Hygiena
Performance BioControl 3M
3M
Similar results obtained for orange Charm
juice and mixed green salad Neogen
Ground Beef Milk Average Hygiena BioControl BioControl
Performance BioControl Charm
3M
Worst Charm Neogen Charm
Performance Neogen Neogen
3M
Data located on page ’15,16 & 31’ of Silliker report and Appendix C
A Comparative Study of Commercial ATP Hygiene Monitoring Systems
Based on Data Generated by Silliker Group Inc.
Page 13Performance qualification:
The detection of small amounts of food residues on
Detection of Foodstuffs: surfaces after cleaning is dependent on the ability to detect
Variation and extractability all the available sample collected.
The extraction efficiency of the reagent swab device
determines the smallest amount of sample that can be
detected. The graph compares the extraction efficiency of
each ATP system and shows that the larger the dilution
Extraction Efficiency factor detected then the more sensitive the systems.
Similarly the less variation in the system then the more
consistent and reliable the result. The graph and table
below shows the variation for pasteurised milk. Neogen
Accupoint did not detect 1 in 100 dilution or lower. Charm
did not detect 1 in 1000 dilution .
•Best Performance
Serial Dilution of Foodstuffs •Hygiena SystemSURE Plus & Ultrasnap with x10 higher
extraction efficiency and greatest consistency across the
whole dilution range.
Variation between systems with 1-10 dilution in Milk
•Average Performance
•BioControl Lightning MVP & MVP
•3M NG & CleanTrace.
•Worst Performance
•Charm Novalum & Pocketswab Plus
•Neogen Accupoint & Accupoint swabs
ATP system Variation (CV%) in dilutions of milk
None 1 : 10 1 : 100 1 : 1000
BioControl Lightning MVP with swabs 26 57 27 61
3M UniLite NG with CleanTrace swabs 30 20 16 10
Charm NovaLum with Pocketswab Plus 24 32 39 ND
Neogen AccuPoint with swabs 22 15 ND ND
Hygiena with UltraSnap swabs 15 11 10 15
Hygiena with SuperSnap swabs 16 11 10 43
Page 14
Data located in Table 16 of Silliker report and Appendix CSection 3:
Detection of Micro-organisms
Extraction Efficiency
Background :
ATP systems are intended to detect very small amounts of organic
material on surfaces or in liquid samples. Micro-organisms are
organic and contain ATP but at much smaller amounts than
foodstuffs. Micro-organisms contain different amounts of ATP
dependent on the type of microbes, size and state of health. The
test cannot differentiate food ATP from microbial ATP.
Serial dilutions of 5 bacteria and 1 yeast culture were prepared and
Serial Dilution of Micro-organisms tested in each system to determine the limits of detection.
Results from Section 3: Detection of Micro-organisms
All organisms were detected and yeasts showed the highest
amount of ATP because they were the largest. Staph aureus
showed lowest amount of ATP. There was large variation in Performance Linearity Sensitivity Repeatability Accuracy
results from all organisms but good linearity was shown by all
systems. ATP systems can detect these micro-organism but Best Hygiena Hygiena Hygiena Hygiena
the limit of detection was shown to be 10,000 to 100,000 Performance BioControl 3M
cfu/ml. This is generally not sensitive enough for most 3M
Charm
cleaning or hygiene programs. Microbes multiply in organic Neogen
matter and ATP systems verify that organic residues have
been removed thus reducing the risks. Therefore ATP testing Average Hygiena Hygiena BioControl
Performance BioControl BioControl 3M
is not a replacement for microbial testing, but an additional 3M Charm Charm
proactive step in support of a complete food safety or hygiene Charm
safety program.
Worst Neogen Neogen Neogen
Performance
Page 15Snapshot:
Universal ATP test device that makes
other systems better
Background:
The performance of Hygiena’s liquid stable reagent technology in Snapshot was consistently shown to provide the following
other luminometers was evaluated to see if Hygiena’s new benefits;
technology improved the performance of instruments of other - Improvement in linearity
systems. Snapshot was tested against all the same criteria using - Improvement in accuracy
ATP, foodstuffs and microbes. Results from the Silliker study - Increased sensitivity ( 2x to 30x fold)
showed that Hygiena’s test device technology is the most superior - Reduction in background noise
currently on the market. - Improved repeatability and consistency (lower c.v.)
- Increased extractability of ATP
“The Hygiena swabs collectively are more sensitive to ATP and
better at detecting low level food and cultures than all other
systems.” (Page 17 of Executive Summary report)
Sensitivity Results
Results from ATP, Foodstuffs & Micro-organism
System Sensitivity ( Limit of Detection: fmols ATP)
Performance Linearity Sensitivity Repeatability Accuracy Suppliers own swab Hygiena Snapshot
BioControl MVP 1.1 0.04
Improvement in
Performance ; ; ; ; 3M UniLite NG
Charm Novalum
1.3
10.0
0.42
5.0
Same
Performance There is no snapshot device suitable for the Neogen Accupoint system
Data located in tables 7 – 17 and Appendices A,B and C of Silliker report
A Comparative Study of Commercial ATP Hygiene Monitoring Systems
Based on Data Generated by Silliker Group Inc.
Page 16Summary
¾ 5 commercial ATP detection systems were compared for ¾ Data confirms that the SystemSURE Plus photodiode
the detection and measurement of ATP, foodstuffs and based system is equal to or better than the other
micro-organisms. commercial photomultiplier tube based system.
¾ All systems were shown to give a good linear response to ¾ Data shows that each system displays a different RLU for
all 3 sample types, however there was a difference in the any given sample. This could be confusing to users
sensitivity, repeatability and accuracy between systems. comparing systems. It is clear that a larger RLU number
does not mean a more sensitive reading. Charm
¾ The most precise, accurate and repeatable systems was displayed the highest RLU value result for each sample
the Hygiena SystemSURE Plus with either Ultrasnap or type and is one of the least sensitive systems.
Supersnap swabs.
¾ All ATP systems can detect micro-organisms in the
¾ The least sensitive and most variable systems were the absence of other organic matter, but at a level of
Neogen AccuPoint and Charm Science Novalum systems detection was 10,000 – 100,000 cfu/ml. This is generally
with their respective swabs. a lot higher then cleaning standards allow. Detection of
micro-organisms showed a large variation based on
¾ The Snapshot Universal swab improved the repeatability species and quantity. Hygiena Supersnap had the best
and sensitivity of the 3M UniLite NG, BioControl MVP and extraction efficiency for the recovery and detection of
Charm Novalum luminometers. microbes.
¾ ATP hygiene monitoring is a cleaning verification test so
accuracy and consistency at low ATP levels is critical.
Study shows that Charm and Neogen have the poorest
sensitivity and highest variability.
A Comparative Study of Commercial ATP Hygiene Monitoring Systems
Based on Data Generated by Silliker Group Inc.
Page 17Helpful Links & Documents
¾ How to setup an ATP hygiene monitoring program
¾ The difference between Photodiode and Photomultiplier Tube systems
¾ How to set thresholds
¾ Understanding Relative Light Units (RLU)
¾ Visit Hygiena at www.hygiena.net
A Comparative Study of Commercial ATP Hygiene Monitoring Systems
Based on Data Generated by Silliker Group Inc.
Page 18You can also read