2020 Water Security Outlooks - South Gippsland Water Annual Water Outlook
←
→
Page content transcription
If your browser does not render page correctly, please read the page content below
2020 Water Security Outlooks
                                         South Gippsland Water

                                       Annual Water Outlook

                                                        | Final

                                              29 October 2020

Annual Wa ter Outlo ok
South Gi ppslan d Wat er
Annual Water Outlook

2020 Water Security Outlooks

Project No:                     IS308300
Document Title:                 Annual Water Outlook
Document No.:
Revision:                       Final
Date:                           29 October 2020
Client Name:                    South Gippsland Water
Client No:
Project Manager:                Ben Baker
Author:                         Connor McCutcheon/ Ben Baker
File Name:                      J:\IE\Projects\03_Southern\IS308300\2020 Outlooks\04 Final
                                Outlooks\SGW_2020Outlook_20201029.docx

Jacobs Australia Pty Limited

Floor 11, 452 Flinders Street
Melbourne VIC 3000
PO Box 312, Flinders Lane
Melbourne VIC 8009 Australia
T +61 3 8668 3000
F +61 3 8668 3001
www.jacobs.com

© Copyright 2020 Jacobs Australia Pty Limited. The concepts and information contained in this document are the property of Jacobs. Use or
copying of this document in whole or in part without the written permission of Jacobs constitutes an infringement of copyright.

Limitation: This document has been prepared on behalf of, and for the exclusive use of Jacobs’ client, and is subject to, and issued in accordance with, the
provisions of the contract between Jacobs and the client. Jacobs accepts no liability or responsibility whatsoever for, or in respect of, any use of, or reliance
upon, this document by any third party.

Document history and status

  Revision          Date              Description                                                                By                Review            Approved

  Draft             27/10/20          Draft for SGW review                                                       CM/ BB            BN                BB

  Final             29/10/20          Final to SGW                                                               CM/BB             BN                BB

                                                                                                                                                                    i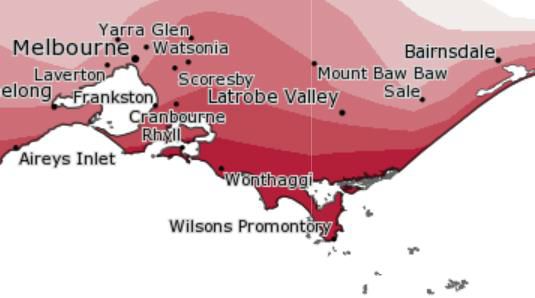
Annual Water Outlook

Contents
Executive Summary.................................................................................................................................1
1.        Introduction..................................................................................................................................2
1.1       Climate Summary...........................................................................................................................4
1.1.1     Victoria’s long term trends in climate and streamflow......................................................................4
1.1.2     Recent Climatic Conditions in South Gippsland ..............................................................................4
1.1.3     Recent Streamflow Conditions in South Gippsland .........................................................................5
2.        Current Water Resource Position................................................................................................7
3.        Climate Outlook..........................................................................................................................13
4.        Forward Outlook ........................................................................................................................16
5.        Short-term Action Plan ..............................................................................................................20

                                                                                                                                                            ii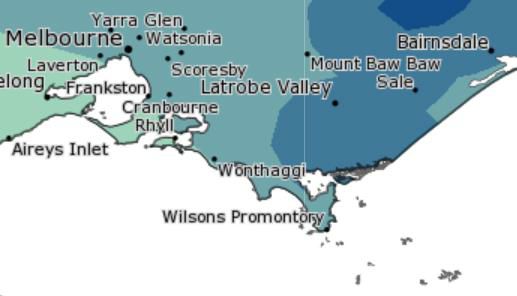
Annual Water Outlook

Executive Summary
South Gippsland Water (SGW) currently manages eight water supply systems that provide water to 21 individual
towns. This document describes the expected outlook for these systems over the coming summer season, with
the likelihood of restrictions in each system summarised in Table 1. In most instances, the forecasts below reflect
the 12 month period from December 2020 to November 2021. The forecast period for run-of river systems is 3
months from November 2020 to January 2021, reflecting the period over which the forecast has a suitable level
of skill. The Little Bass and Coalition Creek supply systems that previously supplied Korumburra, Poowong, Loch
and Nyora are not currently being used, other than to supply very small volumes of non-residential water, and
therefore have not been listed in Table 1.

Table 1 : Outlook summary

  Supply Sources                     Towns Supplied                                Outlook Period         Likelihood of Restrictions1

  Ruby Creek Reservoirs              Leongatha, Koonwarra                     1 Nov 2020 to 30 Nov 2021            Possible
                                                                                     (13 months)

  Lance Creek Reservoir and the      Wonthaggi, Cape Paterson,                1 Nov 2020 to 30 Nov 2021           Very Rare
  Melbourne system                   Inverloch, Korumburra,                          (13 months)
                                     Poowong, Loch, Nyora

  Tarwin River East Branch           Dumbalk                                  1 Nov 2020 to 31 Jan 2021   Very Rare (to end Jan 2021)
                                                                                     (3 months)

  Tarwin River                       Meeniyan                                 1 Nov 2020 to 31 Jan 2021   Very Rare (to end Jan 2021)
                                                                                     (3 months)

  Deep Creek Reservoir and           Foster                                   1 Nov 2020 to 30 Nov 2021           Very Rare
  Foster Dam                                                                         (13 months)

  Battery Creek Reservoir            Fish Creek                               1 Nov 2020 to 30 Nov 2021            Unlikely
                                                                                     (13 months)

  Cook’s Dam (Agnes River)           Toora, Welshpool, Port                   1 Nov 2020 to 30 Nov 2021            Unlikely
                                     Welshpool, Port Franklin,                       (13 months)
                                     Barry Beach

  Tarra River and groundwater        Yarram, Alberton, Port                   1 Nov 2020 to 31 Jan 2021   Very Rare (to end Jan 2021)
                                     Albert                                          (3 months)
 Note:

 1. Explanation of the likelihood classification is available in Table 4.2.

                                                                                                                                        1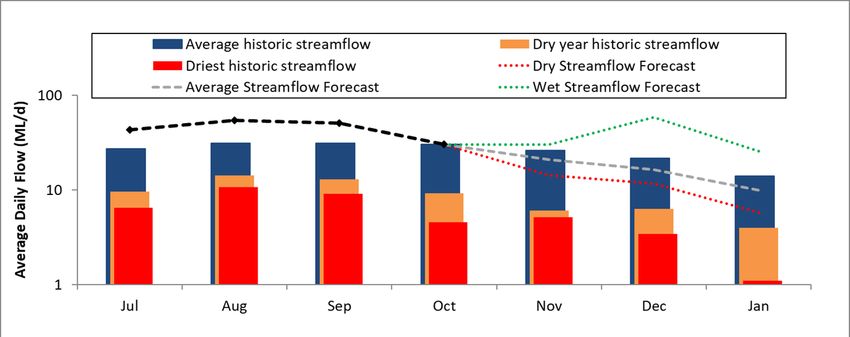
Annual Water Outlook
1. Introduction
South Gippsland Water (SGW) currently manages eight water supply systems that provide water to 21
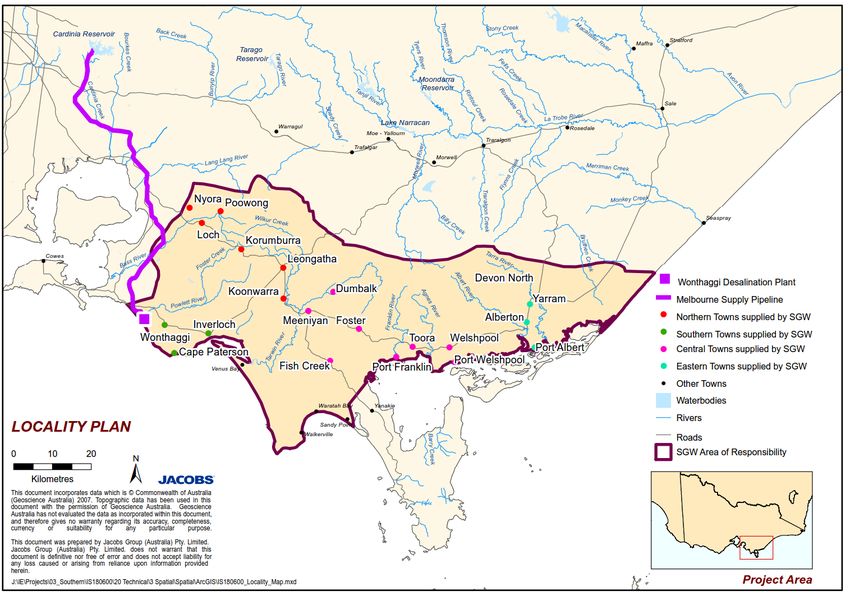
individual towns, listed in Table 1-1. A locality map of the towns supplied by SGW is shown in Figure 1-1.
South Gippsland Water made key achievements in 2019, by improving supplies to Korumburra and Poowong,
Loch, Nyora with their connection to the Lance Creek system, and ultimately to SGW’s Melbourne Bulk
Entitlement. The Little Bass and Coalition Creek supply systems that previously supplied Korumburra,
Poowong, Loch and Nyora are not currently being used, other than to supply very small volumes of non-
residential water, and are therefore not considered further in this outlook.
Current raw water demand is presented to indicate the relative size of each supply system. The towns of
Poowong, Loch, Nyora, Korumburra, Leongatha and Koonwarra are referred to collectively as SGW’s “northern
towns” and Wonthaggi, Cape Paterson and Inverloch are referred to as SGW’s “southern towns”. Dumbalk,
Meeniyan, Foster, Fish Creek, Toora, Welshpool, Port Welshpool, Port Franklin and Barry Beach are referred to
as SGW’s “central towns”, whilst “Yarram, Alberton, Port Albert and Devon North are referred to as SGW’s
“eastern towns”.
n Table 1-1 Water Supply Systems Managed by SGW
Supply System Towns Supplied Current average raw
water demand
(ML/year) (1)
Northern Towns
Ruby Creek Leongatha, Koonwarra 1,639
Southern Towns and connected Northern Towns
Wonthaggi, Cape Paterson, Inverloch 1,709
Lance Creek Poowong, Loch, Nyora 265
Korumburra 675
Central Towns
Tarwin River East Branch Dumbalk 14
Tarwin River Meeniyan 66
Deep Creek/Foster Dam Foster 177
Battery Creek Fish Creek 124
Agnes River Toora, Welshpool, Port Welshpool, Port Franklin, Barry Beach Port 518
Eastern Towns
Tarra River Yarram, Alberton, Port Albert, Devon North 448
TOTAL 5,635
(1) Taken from the UWS (2017), estimated at current level of population and industrial development over a long-term climate sequence
(typically 40+ years) to account for differences in water demand in wet, average and dry years.
SGW prepared their most recent Urban Water Strategy in 2017. This document, available on the SGW website
(http://www.sgwater.com.au/about-us/water-supply-demand-strategy/), outlines SGW’s long term plan to
balance the supply of water to meet the region’s residential, business and community water needs. The UWS
has identified those systems where future water supplies may need to be enhanced in order to meet the
growing demands and be resilient to potential climate change conditions. Details around potential augmentation
options will continue to be developed by SGW in order to meet the augmentation timelines set out in the UWS.
The UWS is complemented by a Drought Preparedness Plan (DPP) which provides SGW with a ready
reference for operational guidance in times of drought. The DPP details the actions SGW will take in order to
prepare for and to respond to periods of water scarcity. This Water Security Outlook is one such action.
2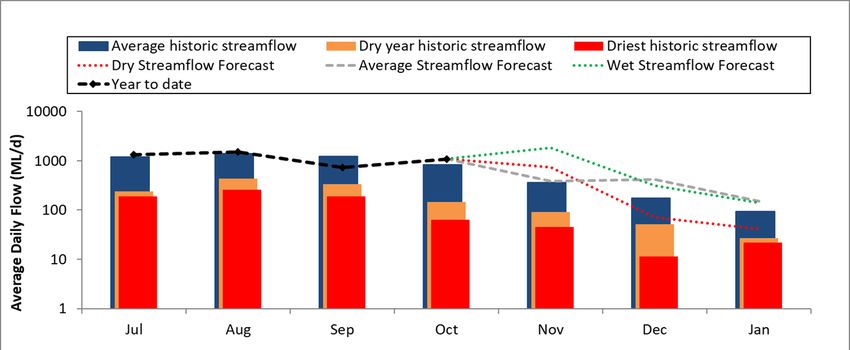
Annual Water Outlook

n     Figure 1-1 Locality Map

                                3
Annual Water Outlook
1.1 Climate Summary
1.1.1 Victoria’s long term trends in climate and streamflow
Victoria’s climate has shown a warming and drying trend over recent decades, and this trend is expected to
continue over the longer-term future. In comparison to historical conditions we are already experiencing:
· Higher temperatures;
· Reductions in rainfall in late autumn and winter and, in some locations, some increases in rainfall during
the warmer months; and,
· In many catchments, a shift in the streamflow response to rainfall, with less streamflow generated for
the same amount of rain.
Some of the rainfall decline in late autumn and winter can be attributed to global warming and changes in the
weather systems that deliver rainfall to Victoria. The cause of the reduction in streamflow response to rainfall is
not yet fully known and is the subject of continuing research.
Over the longer term, we can expect:
· the rainfall reductions in winter to persist;
· possible increases in summer rainfall;
· increases in potential evapotranspiration due to higher temperature and lower relative humidity;
· reductions in streamflow because of less rainfall and higher potential evapotranspiration; and
· the streamflow response to rainfall to no longer remain the same, and generally decline.
Even if there is an increase in summer rainfall, it is unlikely to offset the streamflow impact of rainfall reductions
in winter because most of the runoff in Victorian catchments occurs over winter and spring. In the warmer
months, catchments are drier and more rainfall soaks into the ground, is used by vegetation or evaporates.
Although there will still be a lot of variability in Victoria’s climate and streamflow, the chances of experiencing
warmer conditions and less streamflow is now higher than in past decades.
More information on the observed changes and longer-term future climate and water projections can be found
at https://www.water.vic.gov.au/climate-change
The Victorian Government is investing in further research to better understand how Victoria’s climate is
changing and the water resource implications, as part of implementing Water for Victoria.
1.1.2 Recent Climatic Conditions in South Gippsland
Over the past 12 months, rainfall across the South Gippsland Region has been close to average conditions, as
shown in Figure 1-2. The western part of this region, in the vicinity of Wonthaggi, Inverloch, Korumburra and
Leongatha, has been wetter than the eastern part. In general, rainfall conditions have been between 80% -
125% of the long-term average.
4Annual Water Outlook
Figure 1-2 : Rainfall percentages relative to the mean over the period 1 October 2019 to 30 September 2020 (sourced from the
Bureau of Meteorology’s 12 monthly rainfall percentages for Victoria
http://www.bom.gov.au/jsp/awap/rain/index.jsp?colour=colour&time=latest&step=0&map=percent&period=12month&area=vc).
Rainfall conditions across the SGW region are shown in Figure 1-3 for Korumburra and Yarram. This chart
compares the recent rainfall to the long term monthly average rainfall and confirms the observations made for
the region above. Over the past 12 months, rainfall has been close to average conditions with some wetter
periods early in 2020. The rainfall observations for the most recent two months show that August and
September 2020 rainfall was close to the average monthly conditions in both locations after below average
rainfalls in June and July.
Figure 1-3 : Recent and long term average monthly rainfall in Korumburra and Yarram
1.1.3 Recent Streamflow Conditions in South Gippsland
Streamflow conditions across South Gippsland are summarised in Figure 1-4 for sites on the Tarwin River East
Branch and Tarra River. These charts compare the recent streamflow observations with their long-term average
monthly streamflow characteristics, and demonstrate that flow conditions have been generally above the long
term average at both these sites for long periods over the last 12 months. Similar observations can be made
across the whole region. Above average flow conditions were observed across July and August in 2020, in
response to the higher rainfalls for these months.
5Annual Water Outlook
Figure 1-4 : Recent and long term average monthly streamflow for Tarwin River East Branch at Dumbalk (227226) and Tarra
River at Fischers (227225)
6Annual Water Outlook
2. Current Water Resource Position
This section provides a summary of the current position of SGW’s water supply systems. Table 2.1 summarises
each of SGW’s systems, with information on the major customers and water sources. For completeness, this
table provides a comprehensive list of all legal entitlements however it should be noted that not all of these
water sources are actively used. Some are temporary entitlements or entitlements that require significant
infrastructure upgrades to be able to utilise them. Full details of the legal entitlements to water are described in
the UWS. The year-to-date extraction volumes listed in Table 2.1 cover the period from the beginning of July
until the end of September.
7Annual Water Outlook
Table 2.1 : System summary
Primary Bulk Entitlement Supplementary water sources
Number of
Supply System Towns supplied Major customers Volume extracted Volume remaining Volume extracted
connections Annual entitlement Annual entitlement
2020-21 YTD 2020-21 2020-21 YTD
Murray Goulburn
Share of 386.4 ML from groundwater
Ruby Creek Leongatha, Koonwarra 3,150 and Steam 2,476 ML 413 ML 2063 ML 0 ML
(Note 1).
Generation Plant
· 3,113 ML from
· 3,800 ML from
Wonthaggi, Cape · 687 ML from Lance Creek
Tabro Meats, Lance Creek
Paterson, Inverloch, Lance Ck · 2,279 ML from 1800 ML from Powlett River
Lance Creek 12,900 Burra Foods and Reservoir N/A
Korumburra, Poowong, · 6 ML from Melbourne (Note 2)
Poowong Abattoir · 1,000 ML from the
Loch, Nyora Melbourne including
Melbourne system
carryover
Tarwin River
Dumbalk 100 100 ML 3 ML 97 ML
East Branch
Tarwin River Meeniyan 250 200 ML 12 ML 188 ML
Deep Creek /
Foster 850 326 ML 55 ML 271 ML
Foster Dam
Battery Creek Fish Creek 200 251 ML 28 ML 223 ML
Toora, Welshpool, Port
Welshpool, Port
Agnes River 1,100 Esso 1,617 ML 84 ML 1,533 ML
Franklin, Barry Beach
Port
Yarram, Alberton, Port
Tarra River 1,850 853 ML 93 ML 760 ML 214.2 ML from groundwater 0 ML
Albert, Devon North
Table 2.1 Notes:
(1) There are several groundwater bores within access of Korumburra and Leongatha.
(2) The Powlett River entitlement is not currently used and the supply infrastructure has been decommissioned
8Annual Water Outlook
The volume in storage across the SGW systems is summarised in Table 2.2. All storages are currently full. The
volume of water consumed over the year to date is compared to the average demand over the past five years
for each system in Figure 2-1 to Figure 2-8. In most systems, recent water consumption has been close to the
average water use. Consumption from July to September in the Deep Creek Supply System is the notable
exception to this, where recorded water consumption to date was well above average. The increase in the
recorded water consumption can be attributed to an error in calibrating the newly installed flow meter at Foster
Dam. The issue has been rectified and it is anticipated that the recorded water consumption will return closer to
the five-year average demand for the rest of the year. Water consumption at Lance Creek has been consistently
above average in the year to date and will be closely monitored by SGW over the coming months. The UWS
provides further information on the expected growth in residential, stock and domestic, major industrial and
other non-residential demands over the longer term planning horizon for a range of possible future climate
scenarios.
Table 2.2 : Current Water Resource Position
Supply System Storage Storage capacity (ML) Current storage volume % Full Supply Volume
(ML) at end October
2020
Little Bass Little Bass Reservoir 218 NA NA
(Note 1)
Korumburra Coalition Creek 143 NA NA
Reservoir (Note 1)
Ness Gully Reservoir 73 NA NA
(Note 1)
Bellview Creek Reservoir 359 NA NA
(Note 1)
Leongatha Western Reservoir 1137 1124 98.9%
Hyland Reservoir 671 671 100%
No.2 Reservoir 84 84 100%
No.1 Reservoir 19 19 100%
Lance Creek Lance Creek Reservoir 4200 4200 100%
Fish Creek Battery Creek Reservoir 122 122 100%
Foster Deep Creek Reservoir 14 14 100%
Foster Dam 200 200 100%
Raw Water Basin 23 23 100%
Agnes River Cook’s Dam 58 58 100%
Tarra River Yarram Basin 30 30 100%
Table 2.2 Notes: (1) storage not in use. NA = not applicable
9Annual Water Outlook
Figure 2-1 : Water consumption in the Ruby Creek System
Figure 2-2 : Water consumption in the Lance Creek System
Figure 2-3 : Water consumption in the Dumbalk System
10Annual Water Outlook
Figure 2-4 : Water consumption in the Meeniyan System
Figure 2-5 : Water consumption in the Deep Creek System
Figure 2-6 : Water consumption in the Battery Creek System
11Annual Water Outlook
Figure 2-7 : Water consumption in the Agnes River System
Figure 2-8 : Water consumption in the Tarra River System
12Annual Water Outlook
3. Climate Outlook
The Bureau of Meteorology’s seasonal climate forecasts have been obtained for the November to January
3-month period.
Across the region, rainfall is anticipated to be above average, with most systems forecast to have a 70-80%
chance of exceeding median rainfall conditions during November to January. Figure 3-1 presents the Bureau
outlook for the region showing the likelihood of a wetter three months for most of SGW’s systems.
Figure 3-1 : The chance of above median rainfall for November to January (sourced from the Bureau of Meteorology:
http://www.bom.gov.au/climate/ahead/outlooks/)
The maximum daytime temperature across the region is forecast to be above the long-term average during
November to January. The Bureau outlook indicates a more than 75% likelihood that maximum daytime
temperatures will be above long-term median values (Figure 3-2). December to February temperature outlooks
indicates a similar more than 75% likelihood of exceeding median temperatures across SGW’s systems.
13Annual Water Outlook Figure 3-2 : The chance of above median maximum temperature for November to January (sourced from the Bureau of Meteorology: http://www.bom.gov.au/climate/ahead/outlooks/) The forecast climate conditions for SGW’s systems have been developed based on the Bureau’s forecast for the region and the local climate conditions in the year to date. Table 3.1 summarises the climate outlook across SGW’s systems and specifies the scenario assumed for the Annual Water Outlook for each system, based on the assumption that: · Wet conditions have >80% chance of exceeding median rainfall · Average conditions have >40% to
Annual Water Outlook

Table 3.1 : Climate Outlook across SGW’s systems

                                          Bureau of Meteorology Forecast (Nov-Jan)    Winter and spring      Likely Outlook
                                                                                     rainfall for 2020year     Scenario
     Supply                                   Chance of            Chance of
                    Towns supplied                                                         to date
     System                               exceeding median      exceeding median
                                                rainfall            maximum
                                                                  temperature

                       Leongatha,
   Ruby Creek                                   75-80%               75-80%             Below average           Average
                       Koonwarra

                    Wonthaggi, Cape
                  Paterson, Inverloch,
   Lance Creek        Korumburra,               70-75%                >80%              Below average           Average
                    Poowong, Loch,
                         Nyora

   Tarwin River
                        Dumbalk                 >80%                  >80%              Below average           Average
   East Branch

   Tarwin River        Meeniyan                 70-75%                >80%              Below average           Average

  Deep Creek /
                         Foster                 75-80%                >80%              Below average           Average
   Foster Dam

  Battery Creek        Fish Creek               70-75%                >80%              Below average           Average

                   Toora, Welshpool,
                  Port Welshpool, Port
   Agnes River                                  75-80%                >80%              Below average           Average
                  Franklin, Barry Beach
                          Port

                   Yarram, Alberton,
   Tarra River     Port Albert, Devon           75-80%                >80%              Below average           Average
                         North

                                                                                                                              15
Annual Water Outlook
4. Forward Outlook
The urban water restrictions outlook for SGW’s systems are based on consideration of the information
presented in each of the previous sections, in combination with an assessment of the projected storage over the
coming year based on modelled information. For run of river systems, streamflows are projected for the coming
three months.
Table 4.1 summarises SGW’s assessment of the likelihood of water restrictions for each of its supply systems
over the outlook period specified in the Annual Water Outlook. The outlook period is 3 months for run-of-river
systems, and 13 months for systems with available storage. A shorter outlook period applies for run-of-river
systems, reflecting the period over which the forecast has a suitable level of skill. As such, the likelihood of
restrictions for Dumbalk, Meeniyan and Yarram will be reviewed throughout the year. The assessment
presented in Table 4.1 utilises the DELWP rating system (Table 4.2) that is drawn from the Guidelines for the
Development of Urban Water Strategies and the Melbourne System Strategy (DELWP, 2016).
Table 4.1 : Risk Assessment Likelihood Rating for Water Restrictions over the 2020/21 Outlook Period
Supply Sources Towns Supplied Outlook Period Likelihood of Restrictions
Ruby Creek Reservoirs Leongatha, Koonwarra 1 Nov 2020 to 30 Nov 2021 Possible
(13 months)
Lance Creek Reservoir and the Wonthaggi, Cape Paterson, 1 Nov 2020 to 30 Nov 2021 Very Rare
Melbourne system Inverloch, Korumburra, (13 months)
Poowong, Loch, Nyora
Tarwin River East Branch Dumbalk 1 Nov 2020 to 31 Jan 2021 Very Rare (to end Jan 2021)
(3 months)
Tarwin River Meeniyan 1 Nov 2020 to 31 Jan 2021 Very Rare (to end Jan 2021)
(3 months)
Deep Creek Reservoir and Foster 1 Nov 2020 to 30 Nov 2021 Very Rare
Foster Dam (13 months)
Battery Creek Reservoir Fish Creek 1 Nov 2020 to 30 Nov 2021 Unlikely
(13 months)
Cook’s Dam (Agnes River) Toora, Welshpool, Port 1 Nov 2020 to 30 Nov 2021 Unlikely
Welshpool, Port Franklin, (13 months)
Barry Beach
Tarra River and groundwater Yarram, Alberton, Port 1 Nov 2020 to 31 Jan 2021 Very Rare (to end Jan 2021)
Albert (3 months)
The following general statements can be made on the SGW systems:
· For the Ruby Creek system, restrictions are not forecast over the coming 12 months for the expected
climate outlook. Modelling suggests that severe restrictions may eventuate under the worst drought
scenario. As such, this system has been assigned a likelihood rating of possible.
· For the Battery Creek and Agnes River systems, restrictions are unlikely, but could occur if extremely dry
conditions were to eventuate over summer/autumn.
· For the Lance Creek and Deep Creek systems, the likelihood of restrictions is estimated to be very rare
over the outlook period.
· The run of river systems (Dumbalk, Meeniyan and Yarram/Alberton/Port Albert) have been assigned a
likelihood of very rare. This forecast period extends only until the end of January 2021. Water restrictions
have been previously only been enacted for the Meeniyan and Dumbalk systems during extreme drought.
River flows are expected to remain above SGW’s trigger for restrictions over the outlook period. Tarra river
system has the supplementary option from the ground water and therefore not expected to be in
restrictions over the outlook period.
16Annual Water Outlook Table 4.2 : Risk Assessment Likelihood Rating Likelihood Rating % Description 1 Very Rare
Annual Water Outlook

Figure 4-3 : Streamflow outlook for the Dumbalk system

Figure 4-4 : Streamflow outlook for the Meeniyan system

Figure 4-5 : Urban water restrictions outlook for the Deep Creek system

                                                                          18
Annual Water Outlook
Figure 4-6 : Urban water restrictions outlook for the Battery Creek system
Figure 4-7 : Urban water restrictions outlook for the Agnes River system
Figure 4-8 Streamflow outlook for the Tarra River system
19Annual Water Outlook
5. Short-term Action Plan
A list of priority actions for each of SGW’s supply systems is provided in Table 5.1. Further information on these
activities can be found in the recent UWS and DPP.
Table 5.1 : Action plan
System Action Timing
All Demand management Ongoing
Reduce leaks and wastage Ongoing
Update water security outlooks Every November
Ruby Creek Planning for long term options as per Urban Water Strategy 2017-2021
Tarra River Continue to purchase groundwater licences as required Ongoing
20You can also read