Paper Plane Aerodynamics - Kaijie Chen and Wenxin Lai Adviser: Yongchang Qian
←
→
Page content transcription
If your browser does not render page correctly, please read the page content below
Paper Plane Aerodynamics
     Kaijie Chen and Wenxin Lai
            Adviser: Yongchang Qian

         Xiamen Foreign Language School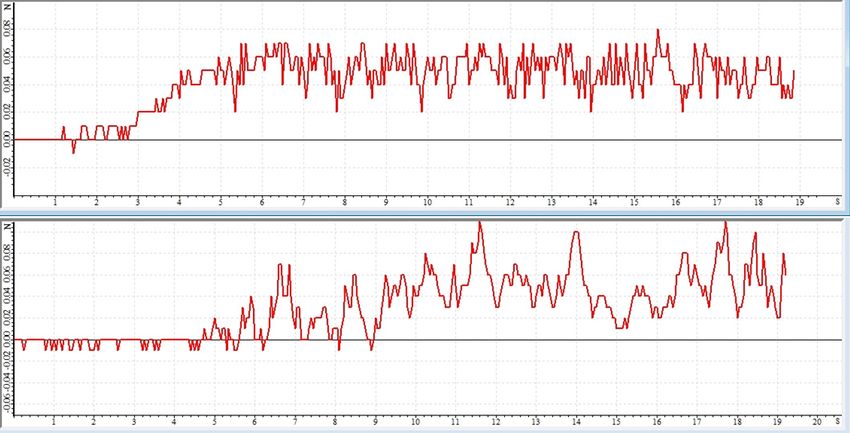
Paper Plane Aerodynamics
                      Kaijie Chen and Wenxin Lai

                      Adviser: Yongchang Qian
                   Xiamen Foreign Language School

Abstract

     This paper takes into account a part of the elements affecting the
flying distance of paper plane. We experimented and analyzed the
effect of the angle of elevation, the location of the center of mass, the
empennage and the aileron. These three factors influence the change
of the angle of attack while the plane flies, thus influencing the flying
distance.

Keywords: Paper plane; Angle of attack; Angle of elevation

                                   1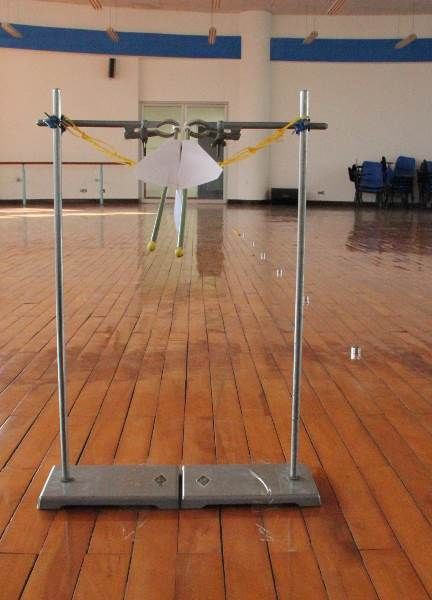
Table of Contents
Introduction
General Theory
Specific Theories and experiments:
1. The Preliminary Experiment
2. The Measurement of Aerodynamic Parameters
3. The Relationship between Angle of Elevation and Distance
4. The Influence of the Centre of Mass
5. The Influence of the Aileron
6. The Influence of the Empennage
Conclusion
A Plane of Mine
Suggestion for Further Research
Acknowledgements
References
Nomenclature:
CD = drag coefficient
CL = lift coefficient
L/D = lift over drag ratio
L = lift force
D = drag force
G = gravity
R = resultant force
α = angle of attack
l = length of the airplane
b = wing span
S = planform area
ρ (ρ∞) = density (of air)
V∞, U∞ = airspeed
ν = kinematic viscosity
Re = Reynolds number (Re=U∞·l/ν)
2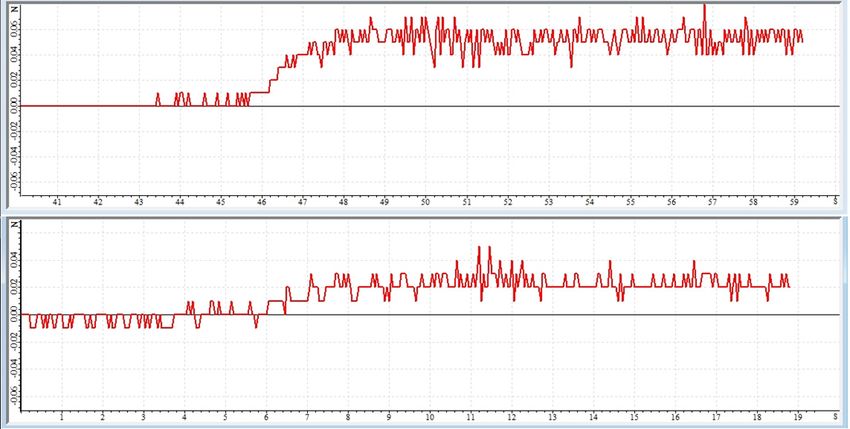
Introduction

     While planes have become a necessary mode of transportation of everyday life, paper
planes are receiving far less attention. But the seemingly simple flight of a paper plane also
includes numerous unsolved problems. Besides the akin problems faced by both paper planes
and real planes, the former have some typical problems, including the relationship between
the angle of elevation and the flying distance, the gradual decrease of flying speed, and the
influence of humidity.
     The study of these questions is a low Reynolds number aerodynamics study, which has
not received much attention. Yet this kind of study is important because it can shed light on
the study of Micro Air Vehicles (MAV). Not only will the paper plane inspire more innovative
designs, its results can also be applied in a good deal.
     In the following chapters, the discussion will focus on the flight as a whole rather than
discuss each moment separately, because almost all the parameters are set before the plane is
launched. Also, the differences between a paper plane and a real plane will be emphasized in
the discussion.

General Theory

     In order to simplify the research, the varying forces on the surface of the wings are
synthesized into a single resultant force R, which can be divided into the lift force L, and the
drag force D. When the plane moves in the air, it will be affected by these two forces, and a
resulting moment. [3]

                                    Figure 2.1 Force diagram

      Considering the lift force, different theories can be applied, including the Kutta-rukefusiji
theorem and Bernoulli's principle. Yet the underlying principle of all these theories is that the
lift force is produced by the difference in velocity between the upper and lower surface of the
wing. [4]
      Besides the lift force, there are two different kinds of drag forces: the viscous drag and

                                                3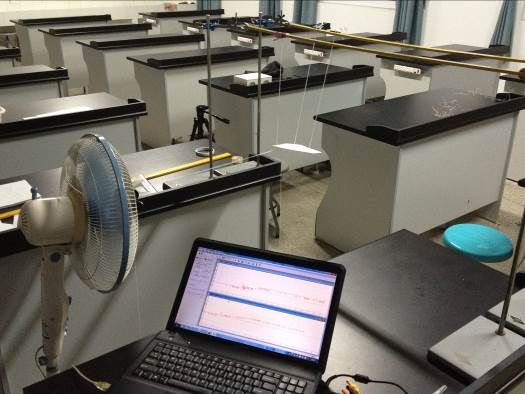
the induced drag. [1] Viscous drag is caused by the viscidity of the air, as shown in the figure
underneath. The figure shows that at the surface of the wing, the velocity of air is zero, and
the velocity increases when gradually with the distance to the surface. In fact, the viscosity is
caused by another two different drag forces: the viscous friction and the viscous pressure
resistance. On the other hand, the induced drag can be described as a “price to pay for the lift
force”. The induced force is caused by the vortices at the ends of the wings. [2]

                                      Figure 2.2 Airflow

Specific Theories and experiments

     The following experiments are generally divided into two parts: the first three parts are
intended to discuss the pneumatics of a paper plane, while the remaining parts address the
stabilization and balance. In all the following experiments, the dihedral and the angle of
center fold equal to zero.

1.   The Preliminary Experiment

Purpose: to select stable and simple plane models for further experiments

Procedure:
     We use a self-made launcher to dart different kinds of planes at the same angle of
elevation, with identical driving forces. We then compare the velocity, travel distance and its
uncertainty.

                                                   Figure 3.1.1 Tested models

                                               4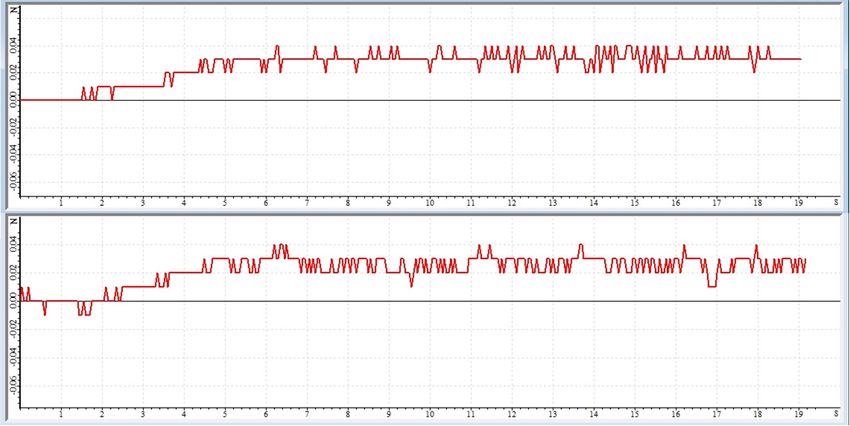
(a)

                  (b)

               (c)
Figure 3.1.2 (a)(b)(c) Launcher

              5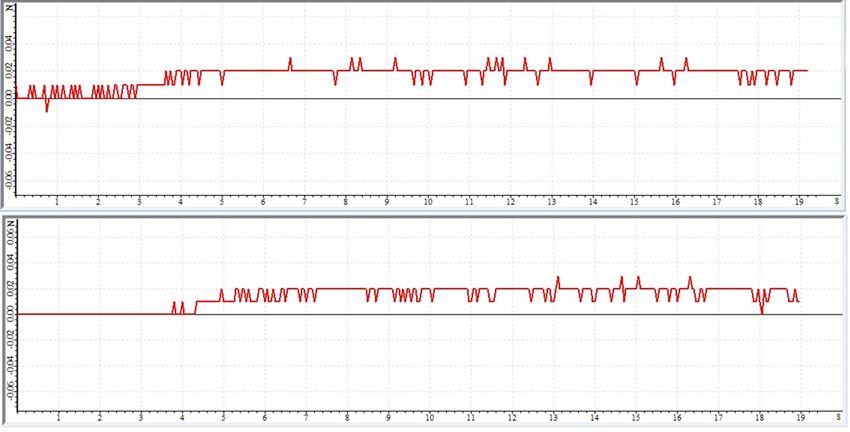
Data Overview:

                                                  (a)

                                                  (b)
                            Figure 3.1.3 (a) (b) Performance overview
Discussion:
    While using eleven different plane models to conduct the experiment, we found out that
Plane Two and Plane Five failed to fly at all, so that they have been excluded from any further
experiments.

Result:
   After comparing different the plane models, we have selected three of the simplest and
most stable models: Plane One G(Glider), Plane Six RⅡ(RevengerⅡ)and Plane Eleven
R(Revenger).

                                              6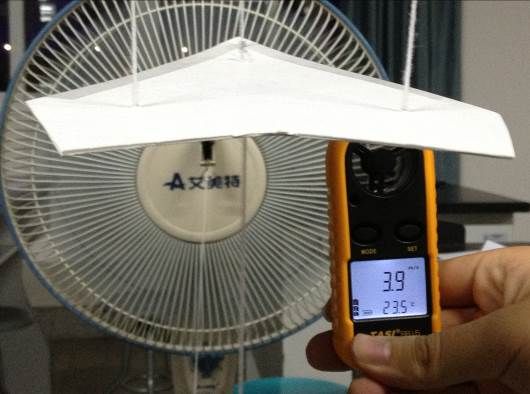
2. The Measurement of Aerodynamic Parameters

Purpose: to measure the pneumatic parameters of Glider, Revenger and Revenger Ⅱ ,
including their lift coefficients and drag coefficient.

Procedure:
      We use a simplified wind tunnel to measure the lift force and drag force of a certain wing
at different angle of attack, then calculate the lift coefficient and the drag coefficient which
are summarized in a graph. Digital Information System Lab (DIS) was used to measure the
lift and drag.

         Figure 3.2.1 Wind tunnel setup and data collector (Airspeed: (4.0±0.1) m/s)

                                               7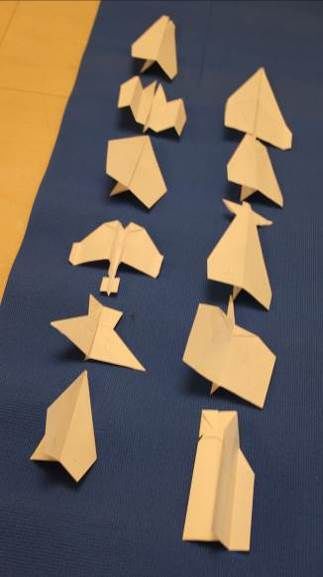
Analysis:
     The lift coefficient CL, the drag coefficient CD and the focus of moment mz           0

coefficient are the three fundamental parameters of a wing. Since the wing of a paper plane is
always symmetrical, the latter equals to zero.
     In measuring the lift force and the drag force, we used DIS (Data Input Supervisor) and a
simplified wind tunnel as shown beneath. Because mz equals zero, the focus of moment
                                                          0

coincides with the center of pressure. [7] These two points coincide at first quarter of the wing
cord, where the moment caused by the lift force and the drag force is zero. For this reason, it
is the perfect point to measure the lift force and the drag force.
     After measuring the forces, the following equations allow us to derive the results. [3][6]

                                                     L
                                          CL =
                                                   q ¥S

                                                     D
                                          CD =
                                                   q ¥S

While q ¥ = 21 r¥V¥2

                                               8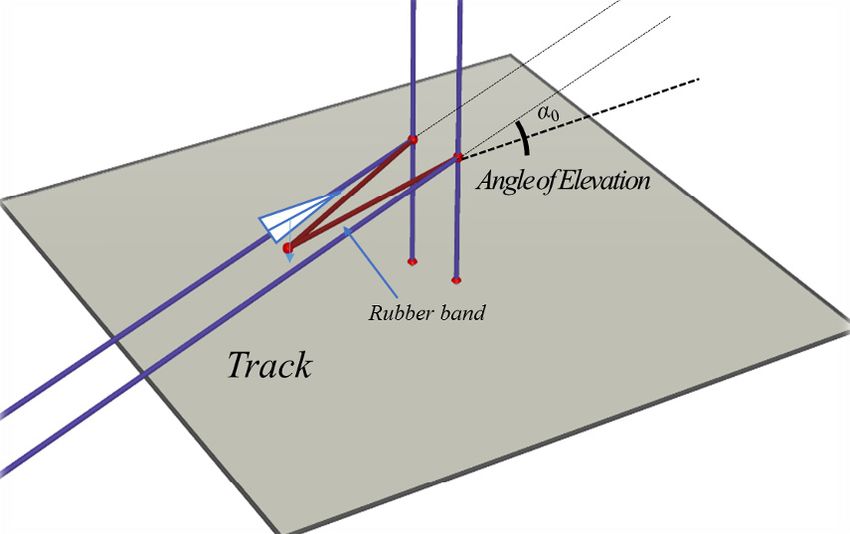
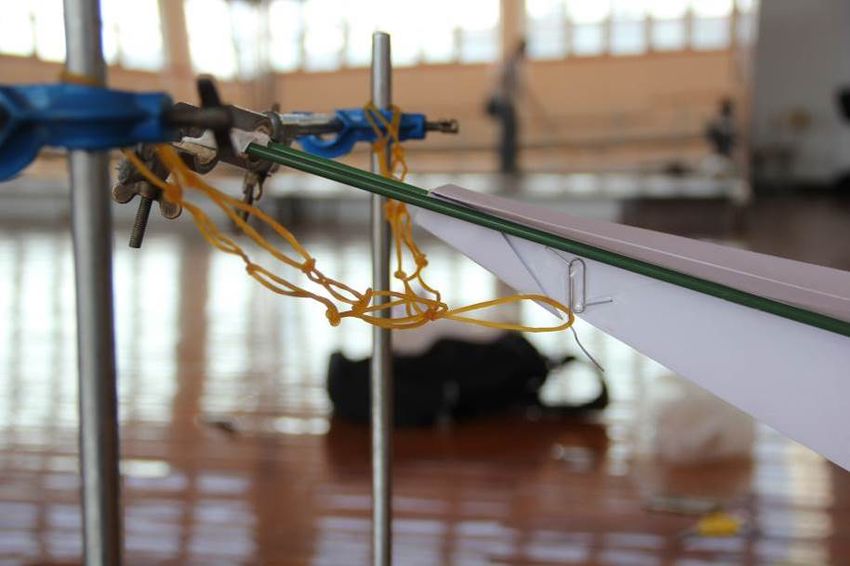
D

                                                                                                            9
L
                                                                           ± 0.02N)
                             Figure 3.2.2 Graph of Lift and Drag (Uncertainty
              NOTE: i. Due to the limitation of DIS, the scale of each graph might vary slightly;
    ii. In the last case, the oscillation went up tremendously, so we had to abort further measurements.)
The figures beneath show the relationship between α, L and D (or CL and CD ) [5]:
(a) Our result
(b) Data from [5]
Figure 3.2.3 Lift curve and Lift coefficient-over-drag coefficient plot
10We compare our results with other existing results. Possibly due to the instability of the
set up, the drag was substantial while the lift was small; however, we still observed the same
pattern of curve.
Result:
With the figure of lift-over-drag curve, it is now easy to find the angle of stall
(approximately 37°), the maximum of lift-dray ratio Kmax (approximately 4.9), and the
optimum angle of attack αopt (approximately 12°).
113. The Relationship between Angle of Elevation and Distance
Purpose: to detect the relationship between angle of elevation and distance.
Procedure:
In order to find out the relationship between angle of elevation and distance, we dart
planes at different angles of election and measure the traveling distances, which are
summarized in a figure.
Data Overview:
Figure 3.3.1 Effect of angle of elevation - pretest
Analysis:
In the above figure, we discovered that the fluctuations of the curves were significant.
After a re-examination of the launcher, we came to the conclusion that any tiny increase of the
launching force would result in a nonlinear increase in the flying distance, thus affecting our
experiment. In order to verify our conjecture, we added another experiment to detect the
relationship between projecting force and flying distance (shown in the figure below).
Figure 3.3.2 Effect of force of launch
Through measuring the relative displacement of the launcher and the flying distance, we
12observed that the flying distance was in direct proportion to the launching force, so that our
first conjecture may not be tenable.
Then we tried to propose another conjecture to explain the fluctuation found in the
experiments; we realized that just on the day before we conducted our experiment, it rained,
and the rain had persisted for more than two days. Considering this fact, we argue that maybe
the humidity of the air added another factor to the experiment, thus causing the results to
fluctuate. Considering this, we conducted the experiment on another sunny day and got the
following figure:
Figure 3.3.3 Effect of angle of elevation
It is easy to see the difference in these two examples. The conjecture about the weather
as an influential factor is therefore confirmed, and of course the factor of humidity requires
further research.
Analyzing the trajectory of flight, we found two typical patterns: (1) parabola-like; and
(2) smooth gliding curve. Generally the first type of flight results into a short duration in the
air and a short flight distance, and occurs when the angle of elevation is either too large or too
small. The gliding pattern appears when the angle of elevation is moderate, and leads to a
high performance.
Figure 3.3.4 Flying trajectory
Result:
The plane reaches the furthest distances when the angle of elevation is approximately 20°.
Additionally, humidity is a factor to be considered when analyzing the flying patterns of paper
planes.
134. The Influence of the Centre of Mass
Purpose: to find out the relationship between the center of mass and flying distance, and then
draw figures for different flying conditions when the center of mass is different.
Procedure:
We use clips to adjust the location of the center of mass, and measure the dependence of
the flight distance on the location of the center of mass, in comparison with the geometrical
center.
CM = center of mass
CG = center of geometry
Figure 3.4.1 Center of mass and center of geometry
NOTE: this triangle is only part of the wing
Data Overview:
Figure 3.4.2 Effect of different center of mass
Flying Trajectory:
(a) Flying Trajectory – Centre of Mass near the Nose
14(b) Flying Trajectory – Centre of Mass near the End
Figure 3.4.3 (a) (b) Effect of center of mass on flying trajectory
Discussion:
While conducting the experiment, we found that a modification of the center of mass
results in an instability of flying, so that we reduced our previously applied projecting force.
Result:
When the center of mass is located near the midpoint of the wing cord, the plane reaches
the furthest distance. Besides, when the center of mass is near the nose of the plane, it drops
down easily; when the center of mass is near the end of the plane, it rises up and then stalls,
sometimes resulting in an undulating flight.
Analysis:
CM = center of mass
F = focus of the wing
Figure 3.4.4 Force diagram of wings
From the result, we can observe that the plane reaches the furthest distance while the
center of mass is behind the focus of the wing. The plane can achieve the furthest distance
because when the center of mass is near the end of the plane, the resulting moment will raise
the nose of the plane, as shown in the figure on the right above. In a certain range, this raise
causes the angle of attack to be closer to the optimum angle of attack (12°); therefore, the
flight distance can increase.
On the other hand, the midpoint of the wing may not be the best place to locate the center
of mass if the plane is to achieve stabilization. According to the existing theory of UAV
(unmanned aerial vehicle) aerodynamics, locating the center of mass behind the focus causes
instability. [7] It is said that when the angle of attack increases, the lift force increases, while
the moment of the focus remains constant, so the resulting moment on the plane increases,
finally causing the stall.
However, this situation cannot be applied directly to paper planes. Since paper planes do
not have power supplies, the decrease of their speed will result in the decrease of pitch up
moment, so even the angle of attack increases, the total moment may still remain the same.
Considering this, it is still in debate that whether the plane can be stable and balance when the
center of mass is behind the focus.
155. The Influence of the Aileron
Purpose: to find out the relationship between the angle of ailerons and the flying distance,
including the deflection distance.
Procedure:
We define the angle of aileron to be positive when the aileron is lifted up, negative when
it is down. In the first experiment, the angles of the ailerons on both wings are adjusted to the
same degrees, while on the second experiment, they are adjusted to opposite degrees.
Figure 3.5.1 Angle of Aileron
Data Overview:
(a) Effect of the same angle of Aileron on both sides
16(b) Effect of the difference of angles of Aileron on each side
Figure 3.5.2 Effect of Aileron
Result:
In real-life situations, the ailerons on both wings seldom go up or down at the same time
as in our first experiment. If they do, then raising the aileron to the same degrees seems to
have the same effect as a relocation of the center of mass. This phenomenon will be discussed
in the next experiment.
Regarding the second experiment, the influence of the ailerons is similar to that observed
in the case of real planes: while the difference in the angles becomes larger, the plane’s lateral
displacement increases.
176. The Influence of the Empennage
Purpose: to compare the flying distance with and without the empennage, using the famous
model of DC-3.
Figure 3.6.1 DC-3
Data Overview:
Figure 3.6.2 Effect of Stabilizing Plane
18Analysis:
The flight distance seems not affected by the addition of a stabilizing plane; this is easy
to understand since stability is not directly related to traveling distance. The situation is
different, however, when adding the factor of wind. The wind power is akin to an engine's
power, only in a rather inconstant way. This additional power is causing the plane to lose the
state of balance, and in this situation the function of the empennage is required.
For the plane we used in this experiment, the plane DC-3, its center of mass is in front of
the focus, as shown on the left figure beneath. In the wind condition, when the angle of attack
increases, it is easy to see that the pitch down moment increases as well, and the plane is able
to reverse into the previous state. Also, in relative to the center of mass, the moment of the
wing’s lift force and that of the empennage’s force cancel each other, so that the plane
achieves a balance even in windy conditions.
CM = center of mass
F = focus of the wing
Figure 3.6.3 Force diagram of wings (with the effect of empennage)
19Conclusion
The plane can fly the further while the angle of attack during the flight is closer to the
optimum angle of attack (approximately 12°). This angle of attack during the flight can be
directly affected by the angle of elevation and the location of the center of mass: when the angle
of elevation is approximately 20° and the center of mass is at the midpoint of the wing cord,
the plane achieve the optimum change pattern of the angle of attack, and fly the furthest.
The empennage and the aileron can affect the angle of attack during the flight indirectly. The
aileron change the flying direction; the empennage can help to stabilize and balance the plane,
especially in wind condition.
A Plane of Mine
After conducting the experiment above, we designed our own paper plane. It has a center
of mass near the nose, a relatively small aspect ratio, and can travel about thirty meters when
there is no wind.
Figure 5.1 A Plane of mine
Suggestion for Further Research
The humidity of the air should be regarded an important factor to be taken into account
when discussing the parameters of a paper plane. Furthermore, this factor may have an innate
relation to the question: “why people exhale at the nose of the plane before flying it?”
The performance of a certain wing shape will increase as a function of the Reynolds
number, and when the Reynolds number reaches a certain point, the performance of the wing
increases even exponentially. [4] This sudden increase should be studied in detail to determine
which wing shape is theoretically the best, and how it influences the choice of the optimum
initial speed.
20Acknowledgements
We thank the support of Xiamen Foreign Language School and Xiamen University.
References
[1] Chen L. Study on Reducing the Multiple Control Surface Optimization of Elastic
Wing Induced Drag. Engineering Mechanics 2009(Chinese); 10.
[2] Martin Simons. Model Aircraft Aerodynamics 2007.
[3] Lu ZL. Aerodynamics 2009(Chinese); 11.
[4] Zhu BL. UAV Aerodynamics 2006(Chinese); 14; 77
[5] Ng BF, Kng QM, Pey YY. On the Aerodynamics of Paper Airplanes 2009; 1; 10
[6] Robort W Fox. Introduction to Fluid Mechanics, p.406
[7] Serway R A, Jewett, Jr J W. Physics for Scientists and Engineers 6th Ed.
21You can also read