Effects of jet angle on harmonic structure of sound radiating from the flute
←
→
Page content transcription
If your browser does not render page correctly, please read the page content below
Acta Acustica 2021, 5, 11
Ó K. Onogi et al., Published by EDP Sciences, 2021
https://doi.org/10.1051/aacus/2021003

                                                                                                                        Available online at:
                                                                                                         https://acta-acustica.edpsciences.org

 SCIENTIFIC ARTICLE

Effects of jet angle on harmonic structure of sound radiating
from the flute
Kimie Onogi*, Hiroshi Yokoyama, and Akiyoshi Iida
Department of Mechanical Engineering, Toyohashi University of Technology, 441-8580 Aichi, Japan

            Received 27 May 2020, Accepted 16 January 2021

            Abstract – For an isolated flute head joint, the effects of jet angle on harmonic structure of a single note are
            investigated within the practical range for human players. The mechanisms of these effects are discussed on the
            basis of both the radiated sound and the flow field measured with a hot-wire anemometer. The blowing param-
            eters, viz., jet angle (angle between jet direction and window), jet offset (relative height of jet direction from the
            edge), lip-to-edge distance, and flow rate, were varied independently by using an artificial blowing device based
            on measured conditions for a human player, where the jet direction is defined as that measured without the
            head joint. The radiated sound revealed that jet angle varied the differential sound pressure level of the second
            to third harmonic (DSPL) less than jet offset, however, as much as flow rate and more than lip-to-edge distance.
            The spatial distribution of jet fluctuation center showed that, with increasing jet angle (the jet direction
            approaches vertical to the window), the jet deflected more inside, so that the actual jet offset was estimated
            to be further inside. The variation of DSPL with jet angle seems to be caused mainly by this shift in the actual
            jet offset.

            Keywords: Flute, Harmonic structure, Jet angle, Jet offset

1 Introduction                                                              lip position relative to the instrument and lip shapes
                                                                            [11, 12]. Flutists develop the ability to control their lips
    The flute belongs to a family of flue instruments that                    and flow rate precisely in order to enhance the artistic value
also includes the recorder, organ pipe, shakuhachi and                      of the music played. Various investigations have been con-
panpipes. When a player blows a flue instrument, an air-jet                  ducted on the physical conditions that govern the sound of
travels across an opening (window) in the resonator (pipe)                  the flute. Ando [11] has estimated the possible ranges of
toward a sharp edge (labium) (see Fig. 1a). During travel-                  blowing parameters, including jet angle (angle between jet
ing, the jet amplifies spatially [1, 2] and fluctuates periodi-               direction and the window), jet offset (relative height of jet
cally in the vertical direction. This jet fluctuation delays                 direction from the edge), lip-to-edge distance, and flow rate,
from the oral cavity exit to the edge [3–5]. The pressure                   by using an artificial blowing device. In his subsequent
in the resonator also fluctuates periodically. If the jet                    study [12], the effects of parameters on timbre have been
reaches the edge and enters into the resonator when the                     evaluated based on the difference of sound pressure levels
pressure in the resonator becomes high, the jet promotes                    between even and odd harmonics. The actual blowing con-
compression in the resonator, and the high pressure in the                  ditions for lip-to-edge distance, shapes of cavity exit, and
resonator is further intensified. This phase relation corre-                 mouth pressure have been measured for flute players
sponds to the favorable relation for the acoustic power                     through photo and pressure measurements by de la Cuadra
generation [6]. To form this phase relation, the time delay                 [13] and Vauthrin et al. [14]. Among these parameters, pre-
of the jet fluctuation is to be almost half a period [7–9].                  liminary experiments by Ando [11] have indicated that the
Further, the acoustic fluctuations around the exit induce                    effect of jet angle on harmonic structure (sound pressure
a modulation of the jet fluctuation as acoustic feedback.                    levels of harmonics), which affects timbre, is weaker than
Then, the feedback loop with the period of resonant                         the effects of jet offset, lip-to-edge distance, and jet velocity;
frequency is formed [8, 10] (see Fig. 1b).                                  however, quantitative results have not yet been
    Unlike the recorder and organ pipe, but like the shaku-                 demonstrated.
hachi and panpipes, sound radiating from the flute varies                        The mechanisms whereby these parameters affect the
not only with instrument shape or flow rate but also with                    radiated sound have been studied by various researchers.
                                                                            Fletcher and Douglas [7] and Yoshikawa [15] have pre-
*Corresponding author: onogi@aero.me.tut.ac.jp                              sented the theoretical calculation for the variation of
This is an Open Access article distributed under the terms of the Creative Commons Attribution License (https://creativecommons.org/licenses/by/4.0),
              which permits unrestricted use, distribution, and reproduction in any medium, provided the original work is properly cited.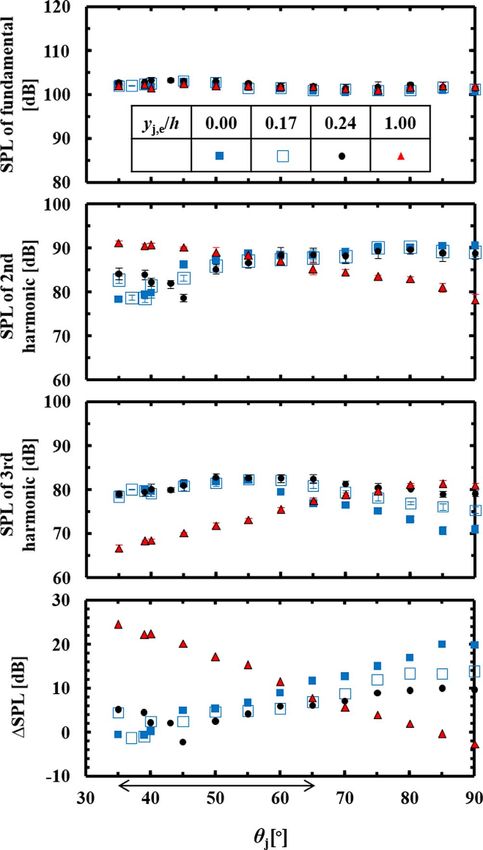
2                                         K. Onogi et al.: Acta Acustica 2021, 5, 11

                                                                       The present research focuses on the effects of jet angle
                                                                   on harmonic structure within a practical range estimated
                                                                   on the basis of literature [11, 13, 14] and experiments in this
                                                                   study. When a human player changes jet angle, other
                                                                   parameters, such as the area that lower lip covers the
                                                                   window of flute, may also change. However, if plural param-
                                                                   eters are changed at once, it may be further difficult to
                                                                   know which parameters contribute to the sound and how
                                                                   much. As a first step, experiments are performed under
                                                                   the condition that only a single parameter is changed at
                                                                   once. The effects of jet angle are discussed in conjunction
                                                                   with those of other blowing parameters, such as jet offset.
                                                                   Further, the mechanism for the effects is discussed in terms
                                                                   of both the radiated sound and the flow field measured with
                                                                   a hot-wire anemometer.
                                                                       The definitions and values of the blowing parameters
Figure 1. Feedback loop between jet and acoustic field.
                                                                   are shown in Section 2. The actual blowing conditions are
                                                                   measured for a human player by the Schlieren method;
harmonic structure with respect to jet offset in a simplified       the photographic measurement results are presented in
organ pipe model. Coltman [16] has predicted the variation         Section 3.1. The parameters are varied independently by
by time domain simulations for the flute. These studies             using an artificial blowing device set up to simulate condi-
assume that the jet oscillates symmetrically with respect          tions for a human player, and the radiated sound and flow
to the vertical center of the jet exit as it travels across the    fields are measured by the methodologies outlined in
window. However, Verge et al. [17] have reviled a jet deflec-       Section 3.2. The effects of jet angle on harmonic structure
tion in the initial transient in a recorder-like organ pipe with   are discussed in Section 4.1 along with those of other
an artificial blowing device. Later, Auvray and Fabre [18]          parameters. The mechanism for the effect of jet angle is
have conducted jet visualizations for panpipes and proposed        discussed in Section 4.2.
a formula that describes a jet deflection during traveling.
The jet deflection has also been observed in simulations of
the recorder; thus, Onogi et al. [19] have proposed a formula      2 Blowing parameters
for jet displacement that takes into account the jet deflec-
tion. These studies imply that the resulting jet offset is not          The geometrical relation between the jet and the flute
predictable only from the geometrical conditions of the jet        depends on jet angle, hj, jet offset from the edge, yj,e, and
exit and edge. Further, lip-to-edge distance and jet velocity      lip-to-edge distance, l [11]. Figure 2 presents the geometrical
have been shown to affect the acoustic power generation.           definitions of these parameters. The jet angle (hj) is the
Coltman [3] has conducted measurements of acoustic impe-           angle between the horizontal line of the window (mouth
dance and pressure. He has shown that the phase relation for       opening) and the reference jet direction. This reference jet
acoustic resonance between the jet and acoustic pressure           direction was measured without a flute head joint in the
oscillations depends on lip-to-edge distance and the convec-       preliminary experiments described below. The jet offset
tion velocity of the jet. Yoshikawa et al. [6] has conducted       (yj,e) is the distance from the edge to the reference jet direc-
particle image velocimetry and shown that the in-phase rela-       tion, where yj,e > 0 means that the reference jet direction is
tion between the fluctuating jet volume flow into the res-           outside the edge. The lip-to-edge distance is the distance
onator and the acoustic pressure fluctuations in the                from the cavity exit center (oj) to the edge. The reference
resonator is favorable to the acoustic power generation This       jet direction is the xj-axis, its vertical direction is the yj-axis,
relation is consistent with the volume-flow model (Helm-            and the longitudinal direction of the resonator is the zj-axis.
holtz–Cremer model) [6, 20–25].                                    The origin (oj) is the center of the upper and lower lips. The
    Jet angle is an additional parameter in the case of the        values on the axes are nondimensionalized by the throat
flute, while the flow channels of the jet in the recorder            height of the cavity exit, h. The spanwise centers of the
and organ pipe are usually parallel to the horizontal line         window and the cavity exit center (oj) are on the same
of the window. Sawada and Sakaba [26] have investigated            plane (zj = 0), and the above-mentioned parameters are
the effects of jet angle on the transitions in the sounding        defined on this plane. The acoustic radiation from an
mode with an artificial blowing device. Ernoult et al. [27]         isolated flute head joint was investigated. The fundamental
have studied the effects of the flutist’s face inclination on       frequency of the head joint is around 880 Hz, and this head
the fundamental frequency and have proposed a formula              joint model is the same as in the literature [28].
for the relation between the face inclination angle and the             The reference jet direction is defined as that measured
radiation impedance of the flute’s window opening. How-             without the head joint through preliminary experiments
ever, the effects of jet angle on harmonic structure have          using the pitot-tube (see Fig. 3). The artificial oral cavity
not been quantified and the mechanisms for these effects            was initially set at the state that the reference line of cavity
remain unclear.                                                    exit, which connects the tips of the upper and lower lips,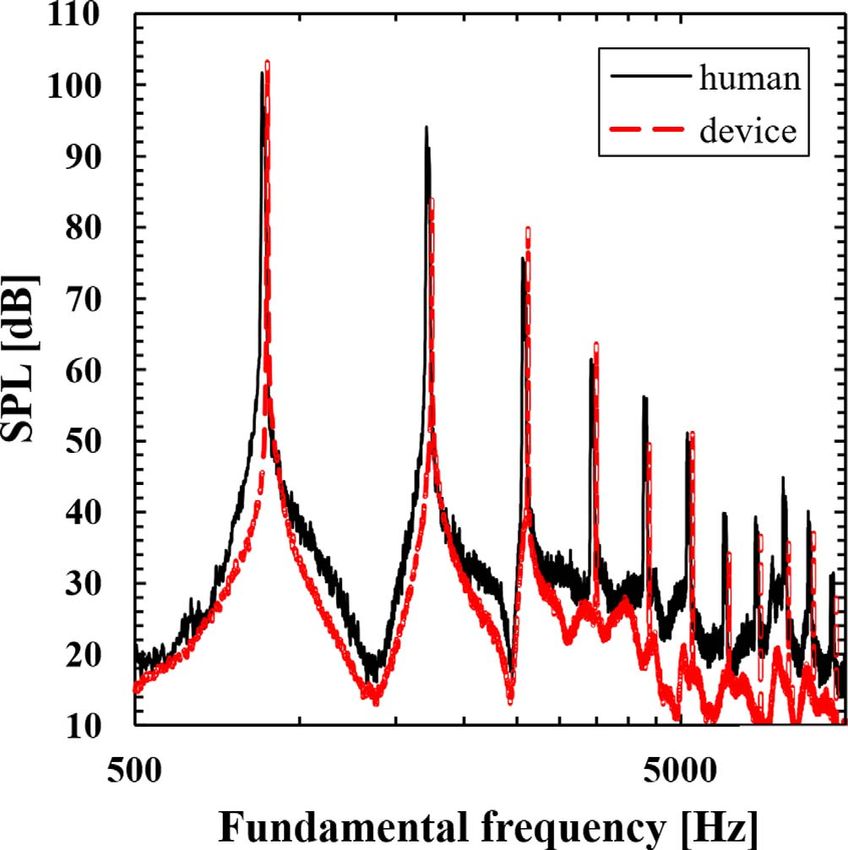
K. Onogi et al.: Acta Acustica 2021, 5, 11 3
Figure 2. Schematic of blowing parameters with reference jet
direction.
Figure 4. Mean velocity profile of jet measured without flute
head joint at xp/h = 1.0.
density variation of the flow field, in which the light and
dark areas in an image are produced by the variation in
the refraction factor of light due to the density variation
[29]. A human player blew a flute head joint 4000 mm from
a concave mirror. The beam was reflected on the concave
mirror, bent 90° by a beam splitter, and cut off by a pinhole
at the focal point to obtain a sharp and even image. The
contrast between light and dark was photographed by a
camera.
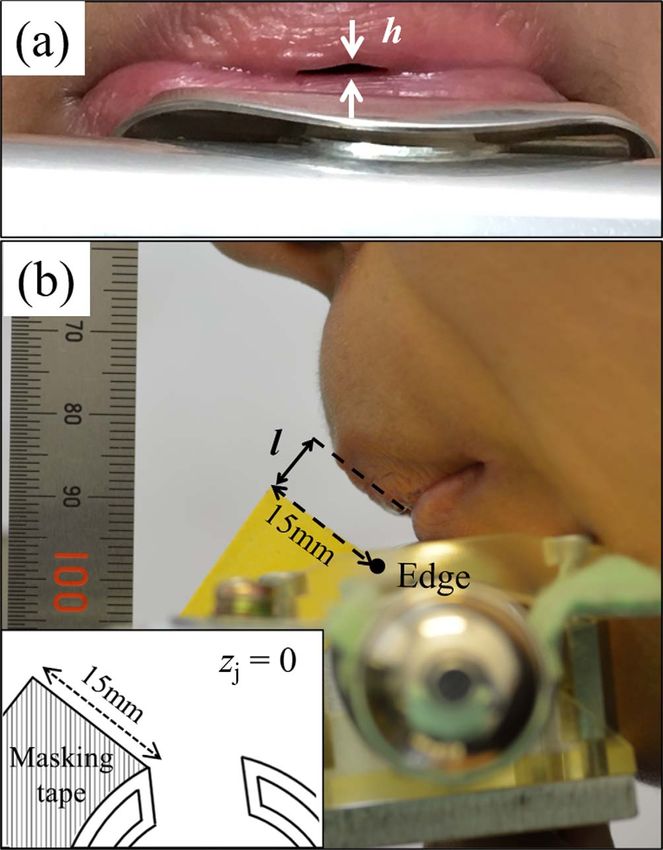
Figure 6 shows the photograph of a human player blow-
ing at almost mf. The head joint was fixed to a jig to ensure
Figure 3. Measurement for reference jet direction. that the reference line of window remained parallel to the
horizontal line of the window. To estimate the reference
jet direction without the head joint, the head joint was slid
into the horizontal direction of the window and released
is parallel to the measurement line (xp/h = 1.0). The jet from the lips with the player keeping the same blowing
velocities were measured by tilting the cavity at an angle, state. Schlieren images were taken after the radiated sound
a, of 12°–15°, which corresponds to changing the angle of was stopped. The jet appears as a black line because of the
the measurement line with respect to the reference line of density gradient produced by the difference in temperature
cavity exit. Figure 4 shows the measured velocity profile. between the air blown by the human and the ambient air.
The profile for a = 14° is symmetrical with respect to The average jet angle for 6 images was hj = 39°, with a
yp/h = 0, which indicates that the reference jet direction variation, hj,error, of ± 2°.
is inclined at a = 14° to the normal direction of the reference The cavity exit height and lip-to-edge distance were
line of cavity exit. measured from photographs, as shown in Figure 7. In the
measurement for the cavity exit height, photographs were
taken from the front of the human player blowing the
3 Experimental methods head joint (see Fig. 7a). The height was found to be
3.1 Measurement of actual blowing condition h = 1.2 ± 0.1 mm. In the measurement for the lip-to-edge
distance, photographs of the human player blowing the fixed
The actual blowing conditions were measured for a head joint were taken from the side (see Fig. 7b). Since the
human player. Since the blowing conditions can vary edge center is hidden by the lip plate, the edge center was
depending on several factors, one of the conditions that determined on the basis of the tip position of a 15-mm-heigh
can occur was investigated. strip of masking tape placed at zj = 0. The lip-to-edge
The jet was visualized by the Schlieren method to distance was found to be l/h = 5.6 ± 0.42. The jet offset,
estimate the jet angle. Figure 5 illustrates the experimental which was calculated geometrically from the jet angle and
setup. The Schlieren method allows visualization of the lip-to-edge distance, was yj,e/h = 0.24 ± 0.25.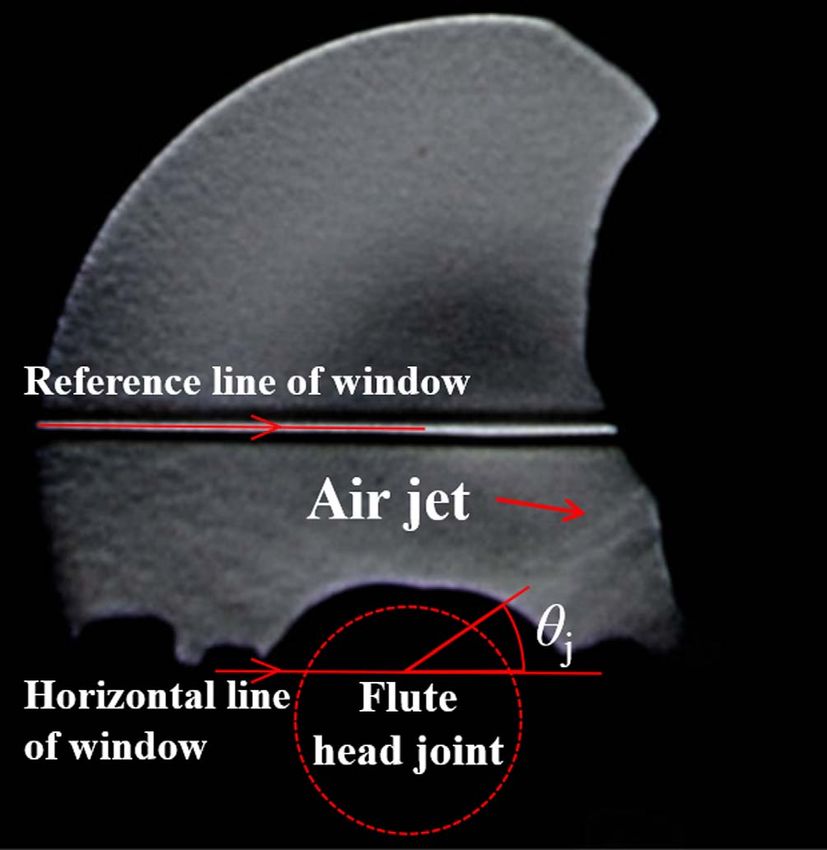
4                                       K. Onogi et al.: Acta Acustica 2021, 5, 11

Figure 5. Experimental setup for Schlieren method.

Figure 6. Jet visualization by Schlieren method.

    The flow rate (Q) was adjusted so that it gives
almost the same fundamental frequency as the human and
that the difference of SPL of the second to the third
harmonic was the closest to the human within the experi-      Figure 7. Photographic measurement for cavity exit height
mental range.                                                 (a) and lip-to-edge distance (b).
    The actual blowing conditions are shown in Table 1.
The radiated sound spectra of the human and device are        3.2 Measurement of radiated sound and flow field
shown in Figure 8, where the frequency resolution is              using artificial blowing device
1.22 Hz, and the blowing parameters for the device were
set to the values in Table 1. The fundamental frequency           The artificial blowing device [28] shown in Figure 9 was
was well reproduced by the device. The SPL difference         used to vary the blowing parameters independently within
between the second and the third harmonic was larger in       the experimental range shown in Table 1. A flute head joint
the human than that in the device. Within the range of flow    and an artificial oral cavity are installed on the device. The
rate that the device reproduced the fundamental frequency     cavity was fabricated with a 3D printer on the basis of MRI
(16.0–20.0 L/min), the SPL difference was the largest at      images around the oral cavity of an actual human player
Q = 16 L/min; the device’s flow rate was set at                blowing a plastic head joint. Since the cavity is made of
Q = 16 L/min. Experiments were performed with reference       plastic, shapes of the cavity, including h and S0, are con-
to the conditions in Table 1. The values and variations are   stant. In actual performances by a human, the cavity
within the ranges shown in the literature [11, 13, 14].       shapes change during playing; however, in this study, the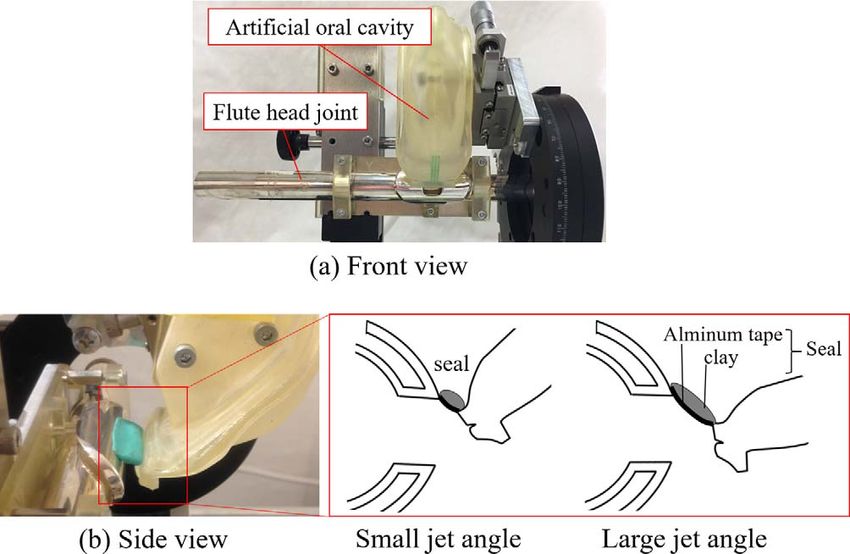
K. Onogi et al.: Acta Acustica 2021, 5, 11                                               5

Table 1. Actual blowing conditions and experimental ranges.

Parameter                                                                     Actual blowing conditions             Experimental
                                                                                      of human                    ranges for device
                                                                              Value           Variation
Jet angle hj (°)                                                                39               ±2                     35–90
Lip-to-edge distance l/h                                                        5.6             ±0.42                 5.0–9.17
Jet offset yj,e/h                                                              0.24             ±0.25                  0.83–1.5
Flow rate Q (L/min)                                                            16.0              ±2                   2.0–38.0
Cavity exit height h (mm)                                                       1.2             ±0.1                     1.2
Cross-sectional mean jet velocity at cavity exit U0 (= Q/S0) (m/s)             21.5             ±2.7                  2.69–51.1
S0 (m2): Cavity exit area.

                                                                     Figure 9. Experimental setup for artificial blowing.

                                                                     radiation impedance around the window [27] and the funda-
                                                                     mental frequency, the seal corresponding to the size of gap
                                                                     was positioned so that the opening area was not changed.
                                                                     For three experiments, the reproducibility of sound was
Figure 8. Sound pressure spectra of radiated sound produced          about ±4 Hz (0.5%) in terms of the fundamental frequency
by human player and artificial blowing device, where blowing          and about ±1 dB in terms of the SPLs of the fundamental
parameters for the device were set to the values in Table 1.         tone and the second and third harmonics.
                                                                         Figure 10 illustrates the experimental setup. The air
                                                                     supplied by the compressor (PAOCK SOL-2039) was
cavity shapes were fabricated to be constant to investigate          depressurized to the experimental pressure value by a preci-
the effects of parameters independent from the shapes.               sion regulator (SMC IR2000). The air was supplied into the
Between the cavity and the head joint, there is a gap, where         artificial oral cavity through a needle valve (KOFLOC
the size of gap depends on blowing conditions (see Fig. 9b).         2412), a flowmeter (SMC PFM750S-01-C-M), and a pres-
In preliminary experiments, the radiated fundamental                 sure gauge (SMC ZSE30AF-01-C-L). This pressure gauge
frequency obtained without covering a seal was about                 measures static pressure from the direction that is at right
25 Hz higher than the fundamental frequency range                    angles to the flow direction.
measured for a human (875–885 Hz), whereas it was within                 The radiated sound was measured with a 1/2-inch omni-
this range when a seal was placed into the gap. Further, the         directional microphone (RION UC-53A) at r = 100 mm
seal made of aluminum tape and clay was found to be better           distance from the resonator end and a precision sound level
to reproduce the fundamental frequency range and assure              meter (RION NL-31). The velocity around the window was
the reproducibility of experiments than the seal made of             measured with a hot-wire anemometer. The probe was an
silicon, clay, and tape. For this reason, the seal made of           I-type probe with a tungsten wire 5 lm in diameter and
aluminum tape and clay was placed into the gap. In an                1 mm in length. The wire was parallel to the spanwise (zj)
actual performance by a human, part of the lower lip                 direction of the cavity exit. Thus, the measured velocity
interferes with (occludes) the window of the flute. Thus,             was the absolute value of the synthetic vector of the stream-
the opening area of the window depends on blowing condi-             wise (xj) and vertical (yj) direction velocities. The measure-
tions. To prevent the change of the opening area affect the          ment lines were xj/h = 1.0, 2.0, and 5.0. The measurement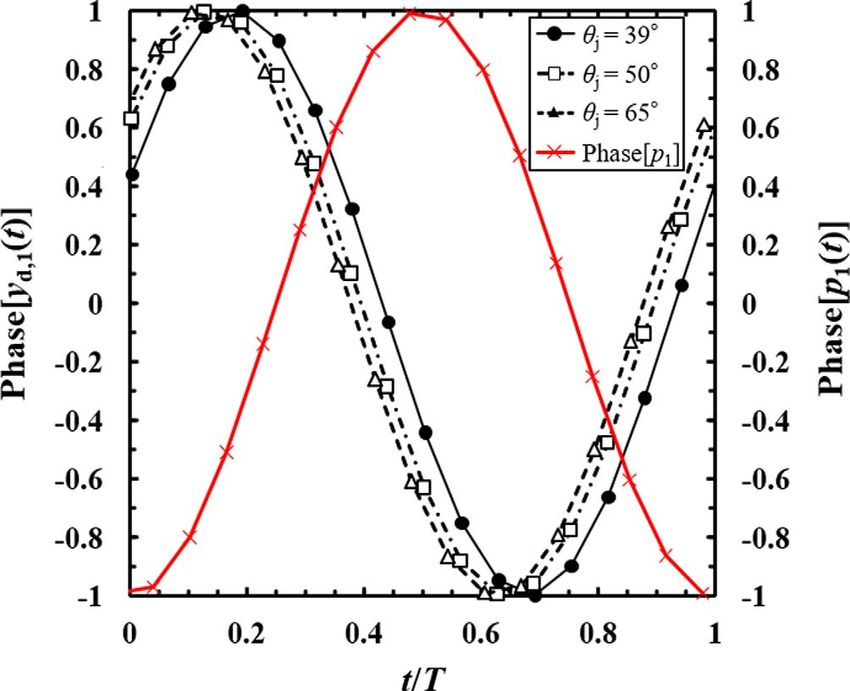
6                                       K. Onogi et al.: Acta Acustica 2021, 5, 11

Figure 10. Schematic of artificial blowing.

Table 2. Measurement conditions for radiated sound.             Table 3. Measurement conditions for velocity.

Condition                                              Value    Condition                                        Value
Sampling frequency (Hz)                               40 000    Minimum resolution of sampling (mm)        0.07 (yj/h = 0.058)
Sampling time (s)                                       30      Sampling frequency (Hz)                           80 000
Averaging number Nave                                   72      Sampling time (s)                                   30
Frequency resolution for Fourier transform (Hz)        1.22     Averaging number Nave                               72
                                                                Frequency resolution for Fourier                   1.22
                                                                transform (Hz)

conditions for the radiated sound and velocity are shown in
Tables 2 and 3. The results of Fourier transform were
averaged Nave times.                                            within ±10 cent of that radiated at the actual blowing con-
                                                                dition. Compared to the literature [11, 13, 14], the practical
                                                                ranges are limited, e.g., human players can blow the flute
                                                                with a lower jet velocity than this range. This is because
4 Results and discussion                                        the practical range was defined for the current experiments
4.1 Effects of jet angle and other blowing                      under the condition that only a single parameter was varied
    parameters on sound                                         independently, while the literature [11, 13, 14] show the
                                                                ranges for actual human playing.
    In this section, the effects of blowing parameters, viz.,        Figure 11a shows the variation with jet offset. Regard-
jet offset, lip-to-edge distance, flow rate, and jet angle, on   ing this variation, the literature [15] has calculated the
harmonic structure were evaluated by the differential SPL       variation of SPLs of harmonics radiated from a simplified
of the second to third harmonic, DSPL  SPL2           SPL3.    organ pipe model without taking into account of jet deflec-
This evaluation is based on the literature [12], which evalu-   tions. The calculation showed that SPL2 and SPL3 respec-
ates the difference of SPLs between even and odd harmon-        tively exhibit their minimum and maximum at yj,e = 0 and
ics, within the range that the reproducibility of radiated      that as |yj,e| increases (the jet fluctuates more asymmetri-
sound was confirmed.                                             cally to edge), SPL2 and SPL3 respectively increase and
    Figure 11 plots the variations in the SPLs of the funda-    decrease. In Figure 11a, the second harmonic curve has a
mental tone and harmonics with the blowing parameters,          minimum around yj,e = 0, which is consistent with the
where the arrows indicate practical ranges, the lines repre-    calculation. Unlike the calculation, the third harmonic
sent the actual blowing condition in Table 1, and the second    curve here is not symmetrical with respect to yj,e = 0. In
vertical axes show DSPL. All parameters other than the one      yj,e > 0 (the reference jet direction is directed to outside
being varied were fixed to the actual blowing condition.         the edge), SPL3 decreases as |yj,e| increases, while SPL3
This study defined the practical ranges as that satisfying       remains almost constant in yj,e < 0. Although the SPLs
the following conditions in our experiments within the          depend only on |yj,e| in the calculation [15], in the actual
possible ranges suggested in the literature [11, 13, 14]: the   blowing, SPL3 seems to decrease less when the jet fluctuates
SPL of the fundamental tone was greater than that of            inside the edge (yj,e < 0) than when it fluctuates outside.
the second harmonic, and the fundamental frequency was          This may be because of incomplete symmetry in the actual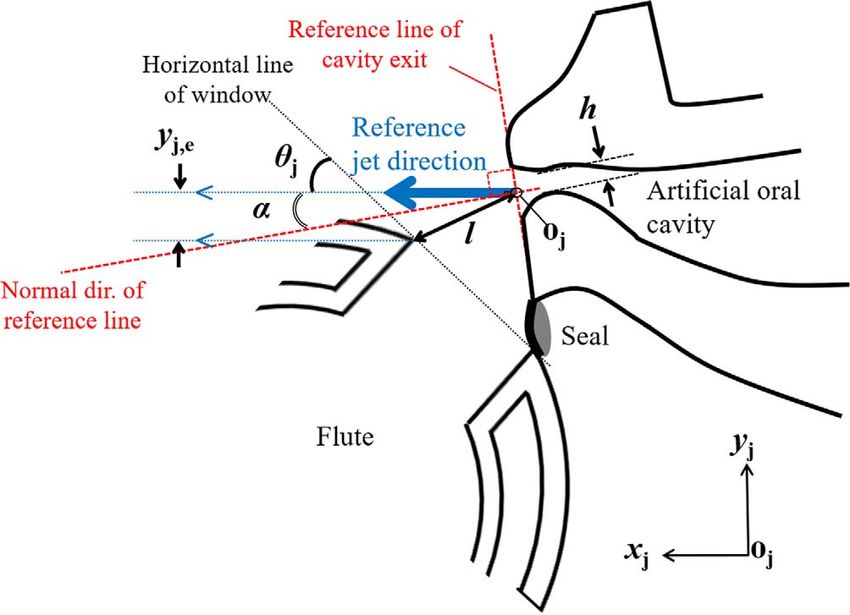
K. Onogi et al.: Acta Acustica 2021, 5, 11                                               7

Figure 11. Variations of harmonic structure with blowing parameters. Lines and arrows show actual blowing conditions and
practical ranges, respectively. All parameters other than the one being varied were fixed to the actual blowing conditions shown in
Table 1 (hj = 39°, yj,e = 0.24, l/h = 5.6, Q = 16 L/min). Error bar is shown for each measured value. In (a), yj,e > 0 means that the
reference jet direction is directed to outside the edge.

velocity profile of the jet around the edge, as to be shown in       favorable phase relation with the pressure fluctuations in
Figure 14b of Section 4.2, while the calculation assumes a          the first mode, then the fundamental shifts to the second
velocity profile symmetrical with respect to the jet center.         mode.
In the practical range, DSPL significantly increases                     Figure 11c shows that the SPLs of the fundamental tone
from about 1 dB to 28 dB with increasing jet offset in              and the third harmonic increase with increasing flow rate in
0  yj,e/h  1.2.                                                   the practical range, while SPL2 decreases for 16  Q
    Figure 11b shows that the SPLs of the fundamental               19 L/min and increases for 19  U0  20 L/min. With the
tone and the harmonics decrease with increasing lip-to-edge         exception of this local variation around Q = 19 L/min, the
distance in 5.8  l/h  7.1 and that the fundamental                second harmonic also increases around the practical range.
frequency then shifts from the first to the second mode at           As flow rate increases, the kinetic energy supplied from
around l/h = 7.2, which is outside the practical range.             the jet to the acoustic field in the resonator increases, and
The phase of vertical fluctuations of the jet delays as the          the convection velocity, Uc, also increases. For flow rate,
jet travels downstream. This time delay (convection time)           both the supplied kinetic energy and the phase relation
from the cavity exit to the edge can be approximated by             can affect the SPL. However, as for the local decrease of
l/Uc, where Uc is the convection velocity. When l exceeds           the second harmonic around Q = 19 L/min, it cannot be
a certain length, the convection time of jet deviates the           explained by the kinetic energy, because the energy increases
condition that the jet fluctuation at the edge can keep the          continuously with Q. To investigate the phase relation, the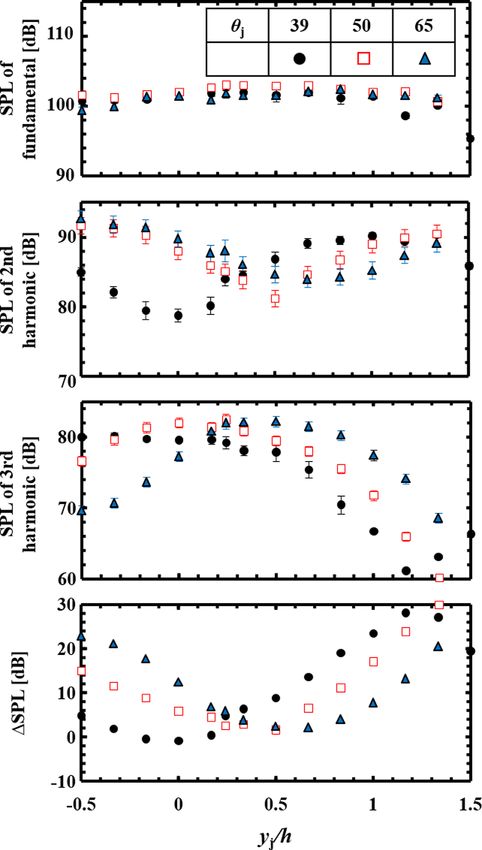
8                                          K. Onogi et al.: Acta Acustica 2021, 5, 11

Table 4. Variation of DSPL with parameters in practical range.

Parameter                               Range of DSPL in
                                       practical range (dB)
                               Min.           Max.            Diff.
Jet angle hj                     2.2            6.1            8.3
Lip-to-edge distance l/h        2.6             6.7            4.0
Jet offset yj,e/h                0.8           28.3           29.1
Flow rate Q                      5.5            3.9            9.4

nondimensional convection time of the second mode of jet
oscillation, (l/Uc)/T2 = tc,2/T2, was estimated: tc,2/T2 for
Q = 18, 19 and 20 L/min were 0.65, 0.61 and 0.58, respec-
tively. Here, the convection velocity was assumed to be
Uc = 0.77 U0 based on the estimation in Section 4.2, and
T2 is the period of the second harmonic frequency measured
at each flow rate. The convection time approaches to 0.5
with increasing flow rate in 18–20 L/min. The convection
time is to be almost 0.5 (half a period) to form the favorable
phase relation between the jet and the pressure fluctuations
[7–9]. The phase relation approaches the favorable condition
and seems not to be the cause of the local decrease of SPL2
around Q = 19 L/min. Another possible factor is to be
discussed in Section 4.2. Except for Q = 18 and 19 L/min,
DSPL remains almost constant in the practical range.
    Figure 11d shows that the SPL of the fundamental tone
varies little with jet angle; thus, the phase relation for the
acoustic power generation seems to be largely unaffected.
SPL2 decreases with increasing jet angle for hj < 45°, while
it increases for hj > 45°. SPL2 varies about 10 dB with jet
angle, while SPL3 varies about 3 dB. Since DSPL varies
mainly due to the variation of SPL2 under this condition,
DSPL exhibits its minimum at hj = 45°.
    Table 4 lists the variation of DSPL with the parameters
in the practical ranges. DSPL variations with jet offset and
lip-to-edge distance are about 30 and 5 dB, respectively,
while the variations with jet angle and flow rate are both
around 10 dB. The harmonic structure varied markedly                  Figure 12. Variations of harmonic structure with jet angle,
with jet offset, almost equally with jet angle and flow rate,          where lip-to-edge distance and flowrate were fixed to the actual
but comparatively less with lip-to-edge distance. The effect          blowing conditions shown in Table 1 (l/h = 5.6, Q = 16 L/min).
of jet angle on timbre seems to be an important considera-            Arrow shows practical range.
tion for flute players.
    In Figure 11, the blowing conditions other than the               DSPL varies with jet angle probably in the range of not
variable one were fixed to the actual blowing condition                exceeding the variation with jet offset. (See Appendix for
measured for a human player. To confirm generality of                  the variations measured for a flute with a body and a foot
the effects of jet angle on harmonic structure, Figure 12             joint.)
shows the variations measured by fixing jet offset to differ-
ent values from that in Table 1 (yj,e/h = 0.24): yj,e/h = 0.0,        4.2 Mechanism whereby jet angle affects
0.17, 1.0. The jet angle that DSPL exhibits its minimum is                harmonic structure
hj,min = 37° for yj,e/h = 0.17 and hj,min = 45° for yj,e/h =
0.24. As yj,e/h decreases (increases), the curve of DSPL                  In the previous section, variations in harmonic struc-
seems to shift toward a smaller (larger) jet angle, and hj,           ture were discussed with the blowing parameters defined
min seems to become small (large). For yj,e/h = 1.0, DSPL             on the basis of the reference jet direction measured without
decreases with increasing jet angle, which seems because              the flute head joint. With the head joint, the actual jet
the curve shift toward a larger jet angle and hj,min becomes          direction can be different from those measured without
larger than the jet angle in the experimental range. DSPL             the head joint, which may affect the resulting jet offset.
variations in the practical range are about 12 dB, 8 dB,              In this section, the actual jet offset is estimated on the basis
and 17 dB for yj,e/h = 0.0, 0.17, and 1.0, respectively.              of both the radiated sound and the flow field for the jet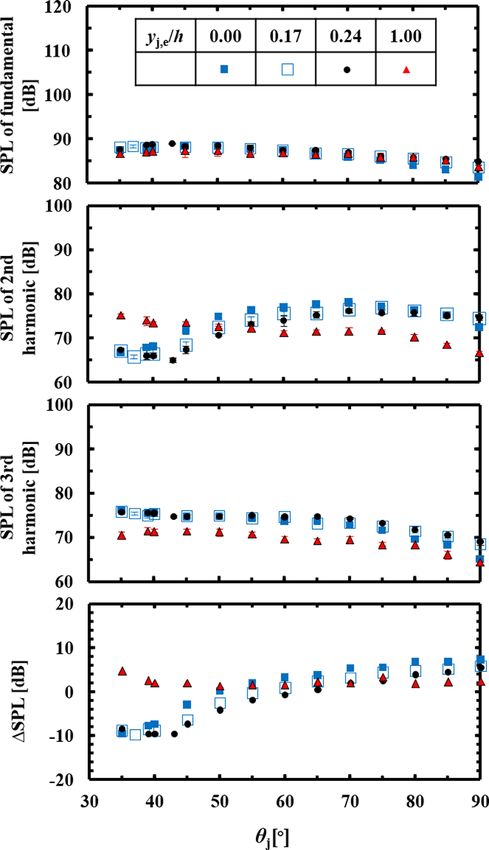
K. Onogi et al.: Acta Acustica 2021, 5, 11                                            9

                                                                   head joint was directed toward the edge. The radiated SPLs
                                                                   are shown in Figure 12. In a preliminary operation, the
                                                                   phase of the sound pressure fluctuation in the resonator,
                                                                   phase[p(t)], was calculated from the radiated sound pressure
                                                                   fluctuation based on the distance from the measurement
                                                                   point to the open end of the resonator (zj = L). t = 0 is
                                                                   the instant when the fundamental mode of phase[p(t)],
                                                                   phase[p1(t)], exhibits a minimum, where the fluctuation
                                                                   with the fundamental mode was extracted from phase
                                                                   [p(t)] by the procedure described in the literature [19].
                                                                   Figure 14 shows that the velocity profiles at xj/h = 1 have
                                                                   top-hat-shapes (shapes similar to rectangle functions), while
                                                                   the computation [19] showed parabolic profiles at the jet
                                                                   exit of the recorder under almost the same U0 as this study.
                                                                   Compared to the channel in the recorder, the channel is
                                                                   shorter in the current oral cavity; therefore, the shear layer
                                                                   forms thinner, and the profiles have top-hat-shapes. The
                                                                   profiles are temporally inclined outward (yj > 0) or inward
                                                                   (yj < 0) probably affected by the acoustic feedback from the
                                                                   acoustic field, as also observed around the jet exit in the
                                                                   computation [19]. Their fluctuations are amplified at
                                                                   xj/h = 5. The line in each profile shows the jet displacement,
                                                                   yd, where yd was defined in this study as the center of the
                                                                   half-value positions of maximum velocity. yd fluctuates
                                                                   between the outside and inside during each period.
                                                                       Figure 15 shows the periodical variations of the jet dis-
                                                                   placements at xj/h = 1.0, 2.0, and 5.0, as well as phase[p(t)].
                                                                   The instantaneous jet displacement fluctuates almost
                                                                   sinusoidally at xj/h = 1 and 2. Further downstream, the
                                                                   instant that the jet displacement changes from increasing
                                                                   (decreasing) to decreasing (increasing) is delayed owing to
                                                                   the convection of the jet fluctuations. The convection
                                                                   velocity of the first mode of jet fluctuations, Uc,1, was calcu-
                                                                   lated from the phase difference of the first modes of yd(t)
                                                                   between xj/h = 1 and 5. The convection velocities were
                                                                   Uc,1 = 16.6 m/s (0.77U0) for hj = 39°and 50°, Uc,1 =
                                                                   19.8 m/s (0.92U0) for hj = 65°. The convection velocity
                                                                   nondimensionalized by the maximum velocity at the exit,
Figure 13. Variations of harmonic structure with jet offset,       Uc,1/U0,max, were respectively estimated to be 0.34 for
where lip-to-edge distance and flowrate were fixed to the actual     hj = 39° and 50°, 0.65 for hj = 65°, which are almost within
blowing conditions shown in Table 1 (l/h = 5.6, Q = 16 L/min).     the values in the literature [13, 19, 30, 31]. Here, U0,max is
                                                                   estimated from the reduction ratio of the maximum jet
                                                                   velocity between xj/h = 1 and 2, (U1,max U2,max)/h, since
angles hj = 39°, 65°, and 50°, which are respectively the jet      U0,max is unmeasurable because the cavity exit is too narrow
angles at the actual blowing condition, the maximum jet            to insert the probe. The measurements in the literature [13]
angle in the practical range, and a jet angle between these        showed that the convection velocity depends mostly on the
two.                                                               shear layer formation in the channel and increases when the
    Figure 13 plots the variation in the SPLs of the harmon-       jet gets sharper. Figure 16 shows the time-averaged velocity
ics with jet offset. For hj = 39°, 50°, and 65°, the jet offsets   profile near the cavity exit (xj/h = 1.0), where the vertical
minimizing the DSPL, ymin/h, were about 0.0, 0.5, and 0.7,         axes show the relative height to the jet displacement. The
respectively. As the jet angle increases, ymin/h becomes           boundary layer at hj = 65° is thinner than at hj = 39°,
large. This implies that the second and third harmonic             50°.; therefore, Uc,1/U0,max, for hj = 65° is the largest among
curves shift toward the positive direction.                        the jet angles. The convection velocities are consistent with
    To elucidate this change in ymin/h from the flow field,          the velocity profile. This confirms that the periodical jet
the periodical variations of velocity profiles in Figure 14         fluctuations obtained from the measurements with the
were obtained by phase-averaging the values measured with          hot-wire anemometer are a reasonable representation. The
a hot-wire anemometer with reference to the sound pressure         velocity profile near the exit changes with the jet angles
fluctuations. In these measurements, the jet offset was set to      probably because the jet may be affected by the acoustic
zero (yj,e/h = 0), i.e., the reference jet direction without the   pressure fluctuations. With increasing jet angle, the channel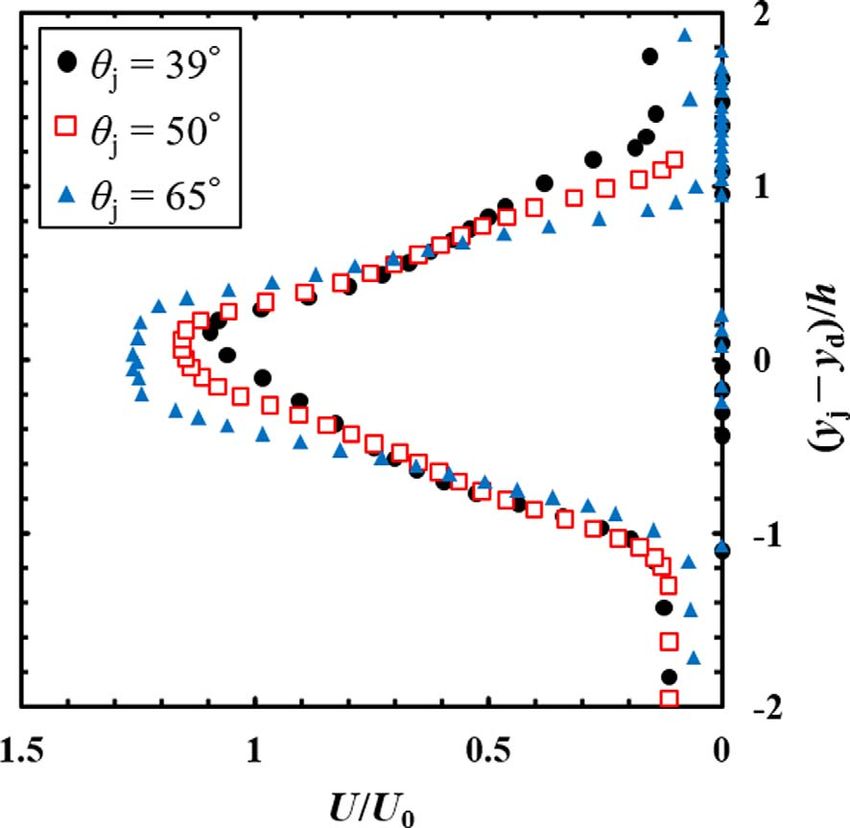
10                                      K. Onogi et al.: Acta Acustica 2021, 5, 11

Figure 14. Periodical variations of velocity profiles, where lines show jet displacements (yd). (hj = 39°, yj,e = 0, l/h = 5.6,
Q = 16 L/min).

becomes more vertical to the window (see Fig. 9b), which         jet fluctuations at the exit [19]. The phase differences,
may change the effect of the acoustic pressure fluctuations       115°–135°, are within the threshold for the acoustic power
on the jet.                                                      generation at 90°–270° [20]. Jet angle seems not to effect
    Assuming that Uc,1 is constant between xj/h = 1 and          significantly on the condition for the acoustic power
l/h, the phase of jet displacement fluctuations with the          generation.
fundamental mode at the edge (xj/h = l/h), phase[yd,1(t)],           To estimate the actual jet offset, the jet fluctuation
were calculated for each jet angle (see Fig. 17). The phase      center, yfc(xj), was defined in this study as the time average
differences of the jet displacement to the pressure fluctua-      of jet displacement fluctuation (yd). Figure 18 plots the
tions were 115°, 130°, and 135°, for hj = 39°, 50°, and          spatial distribution of the jet fluctuation centers, where
65°, respectively. Although Uc,1 is almost the same for          the horizontal axis is shown from the cavity exit (xj = 0)
hj = 39° and 50° and the largest for hj = 65°, the resulting     to the edge (xj = l = 5.6 h). The jet fluctuation centers at
phase difference increases with increasing jet angle and is      xj = 0, yfc(0), seem not to coincidence with the geometrical
not determined only from Uc,1. This seems to because the         origin (yfc = 0) and they vary with jet angle. Assuming that
phase difference depends both on Uc,1 and the time delay         the jet travels with the same deflection from xj/h = 0 to 2,
from the jet receives acoustic feedback until it appears in      yfc(0) is around 0.25 for hj = 39° and 50°, and 0.45 for
K. Onogi et al.: Acta Acustica 2021, 5, 11 11
Figure 15. Periodical variations of jet displacements at
xj/h = 1, 2, and 5, as well as periodical sound pressure fluctuation Figure 17. Periodical variations of jet at the edge (xj/h = l/h)
in the resonator. (hj = 39°, yj,e = 0, l/h = 5.6, Q = 16 L/min). and pressure fluctuations at the fundamental mode. (yj,e = 0,
l/h = 5.6, Q = 16 L/min).
Figure 16. Time averaged velocity profiles at xj/h = 1, where
vertical axes show relative height to jet displacement. (yj,e = 0,
l/h = 5.6, Q = 16 L/min).
Figure 18. Spatial distributions of jet fluctuation centers.
(yj,e = 0, l/h = 5.6, Q = 16 L/min).
hj = 65°. yfc(0) locates further inside (yfc < 0) at the jet
angle around the upper limit of the practical range.This is
presumably because the jet fluctuates in the channel are almost the same. The difference of yfc(5 h) between
(xj 0) affected by the acoustic pressure fluctuations. In hj = 50° and 65° seems to be due to the difference of jet fluc-
the upstream half of the window (0 < xj < 0.5 l), yfc(h) is tuation centers at the cavity exit (xj = 0), while the differ-
almost the same at hj = 39° and 50° though, yfc(2 h) is ence between hj = 39° and 50° is due to the jet deflection in
farther outside at hj = 39° than at hj = 50°. This indicates the window (0 < xj). The jet fluctuation centers near the
that the jet is deflected in the upstream. As the jet travels edge probably depend on the jet deflection in both the
downstream from xj = 2 h to xj = 5 h, it is deflected outside channel and the window. Assuming that the jet travels with
the resonator (yfc > 0) at hj = 39°, while it is deflected inside the same deflection from xj/h = 2.0 to l/h, the actual jet
at hj = 50° and 65°. The jet deflections at hj = 50° and 65° offsets to the edge, ya,e, for hj = 39°, 50°, and 65° were12 K. Onogi et al.: Acta Acustica 2021, 5, 11
seems to be mainly caused by the inward shift of the actual
jet offset due to the jet deflection.
As jet angle increases, the cavity exit moves further
from the window opening, and the jet is emitted more
parallel to the inner wall of the edge, as shown in Figure 9b.
Further investigations into the flow field are necessary to
determine how the geometrical relationships between the
jet, acoustic field, and edge affect the jet deflection. There
may be a possibility that the jet deflection is also caused
by another blowing conditions. As shown in Figure 11c,
the local variation of SPL2 around Q = 19 L/min was
observed, and it does not seem to be caused by the phase
relation or the kinetic energy. It may be effective to investi-
gate if the jet may also be deflected with changing flow rate,
which can vary the SPLs.
5 Conclusion
Figure 19. Relation between relative jet amplitude of second to
This study investigated the variation of harmonic struc-
third mode at xj/h = 5 and differential SPL of second to third
harmonic. (yj,e = 0, l/h = 5.6, Q = 16 L/min).
ture with jet angle in the practical range, in comparison with
jet offset, flow rate, and lip-to-edge distance. Harmonic
structure was evaluated by the differential sound pressure
estimated to be ya,e/h = 0.1, 0.5, and 0.7, respectively. level of the second to third harmonic (DSPL). The harmonic
This indicates that the jet deflects more inside with increas- structure varied markedly with jet offset (DSPL 30 dB),
ing jet angle. The absolute values of actual jet offset, almost equally with jet angle and flow rate (DSPL 10
|ya,e/h|, corresponded almost exactly to ymin/h of 0.0, 0.5, dB), but comparatively less with lip-to-edge distance
and 0.7. This implies that, as jet angle increases, the (DSPL 5 dB). The effect of jet angle on timbre seems to
ymin/h for the radiated sound shifts outward (ymin > 0) be an important consideration for flute players.
by the same amount that the actual jet offset in the flow The mechanism for the effect of jet angle on harmonic
field shifts inward (ya,e < 0) due to the jet deflection. To structure was investigated based on both the radiated
produce a harmonic structure similar to that radiated at sound and the flow field. The radiated sound showed that,
a small jet angle, the jet offset must be increased to cancel with increasing jet angle, the jet offset minimizing DSPL
out the inward shift in the actual jet offset. This can be also increased. This denotes that there is a dependency between
observed in Figure 12, which shows that hj,min seems to jet angle and jet offset. This dependency was investigated in
become large as yj,e/h increases. This denotes that, to min- terms of the flow field. The spatial distribution of time-
imize DSPL at a large jet angle, yj,e/h must be increased. averaged jet fluctuation centers showed that the jet deflects
From here, the variation of SPLs in Figure 11d can be inside with increasing jet angle. The actual jet offset esti-
discussed. In Figure 11d, the jet offset was fixed to mated from the distribution was found to shift inside with
yj,e/h = 0.24; thus, the actual jet offset can be outer side increasing jet angle almost by the same amount that the
by Dyj,e/h = 0.24 than that in Figure 18 under yj,e/ jet offset minimizing DSPL increased. This indicates that,
h = 0.0. The actual jet offset in the flow field can be ya,e/ to produce a harmonic structure similar to that radiated
h = 0.34 and 0.26 at hj = 39° and 50°, respectively. At at a small jet angle, jet offset needs to be increased (the
hj = 45°, ya,e/h can be around zero; therefore, SPL2 seems jet needs to be directed to the outside the edge) to cancel
to exhibit its minimum at hj = 45°. In hj > 45°, the actual out the inward shift in the actual jet offset due to the jet
jet offset can be ya,e/h < 0, where SPL3 remains almost con- deflection.
stant as shown in Figure 11a. Figure 14b showed that the Other factors that could affect radiated sound were also
velocity profile near the edge (xj/h = 5.0) is asymmetric investigated. Periodical jet fluctuations were determined by
unlike the assumption of the calculation [15]. Probably phase-averaging the measured values obtained with a hot-
because of this, SPL3 varies less in ya,e/h < 0, and SPL3 var- wire anemometer. The estimated convection velocities of
ies little with the jet angle in the practical range. jet fluctuations were confirmed to be consistent with the
The other factor that could be related to the SPLs of the velocity profiles. The phase relation between the jet fluctu-
harmonics is the jet amplitude of each mode. Figure 19 ations at the edge and the pressure fluctuations in the
shows the relation between the relative jet amplitude of instrument, which is related to the condition for the acous-
the second to third mode at xj/h = 5, |yamp,2|/|yamp,3|, tic power generation, seemed not to be affected significantly
and DSPL. The jet amplitudes of the second and third by jet angle. The variation in jet amplitude with jet angle
modes show little correlation with the SPLs of the second showed little correlation to the variation in harmonic struc-
and third harmonics. The variation in DSPL with jet angle ture. These results support that the variation in DSPL withK. Onogi et al.: Acta Acustica 2021, 5, 11 13
jet angle is mainly caused by the change in the actual jet 12. Y. Ando: Drive conditions of a flute and their influences upon
offset. harmonic structure of generated tone: An experimental study
As jet angle increases, the cavity exit moves further of a flute II. The Journal of the Acoustical Society of Japan
26 (1970) 297–305.
from the window opening, and the jet is emitted more 13. P. de la Cuadra: The Sound of Oscillating Air Jets: Physics,
parallel to the inner wall of the edge. Further investigations Modeling and Simulation in Flute-like Instruments. PhD
into the flow field are necessary to determine how the thesis, Stanford University, 2005.
geometrical relationships between the jet, the acoustic field, 14. C. Vauthrin, B. Fabre, I. Cossette: How does a flute player
and the edge affect the jet deflection. In addition, lip shapes adapt his breathing and playing to musical tasks? Acta
also depend on jet angle when a human plays the flute. For Acustica United With Acustica 101 (2015) 224–237.
experimental results to be applicable to actual perfor- 15. S. Yoshikawa: Harmonic generation mechanism in organ pipes.
The Journal of the Acoustical Society of Japan (E) 5 (1984)
mances, it is necessary to investigate whether harmonic 17–29.
structure can be controlled more effectively by adjusting 16. J.W. Coltman: Jet offset, harmonic content, and warble in
jet angle or lip shapes. the flute. The Journal of the Acoustical Society of America
120 (2006) 2312–2319.
17. M.P. Verge, B. Fabre, W.E.A. Mahu, A. Hirschberg, R.R.
Acknowledgments van Hassel, A.P.J. Wijnands: Jet formation and jet velocity
fluctuations in a flue organ pipe. The Journal of the
We would like to thank A. Natsubori for her collabora- Acoustical Society of America 95 (1994) 1119–1132.
tion on experiments. We also thank K. Arimoto for useful 18. R. Auvray, B. Fabre: Specific features of a stopped pipe
discussions. The artificial blowing device used in this blown by a turbulent jet: Aeroacoustics of the panpipes.
The Journal of the Acoustical Society of America 139 (2016)
study is provided by YAMAHA Corporation.
3214–3225.
19. K. Onogi, H. Yokoyama, A. Iida: Analysis of jet oscillations
with acoustic radiation in the recorder by direct aeroacoustic
Conflict of interest simulations. The Journal of the Acoustical Society of
America 146 (2019) 1427–1437.
Author declared no conflict of interests. 20. N.H. Fletcher, T.D. Rossing: The Physics of Musical Instru-
ments. 2nd ed. Springer Verlag, 1998.
21. J.W. Coltman: Jet drive mechanism in edge tones and organ
References pipes. The Journal of the Acoustical Society of America 60
(1976) 725–733.
1. A. Michalke: On spatially growing disturbances in an inviscid 22. S.A. Elder: On the mechanism of sound production in organ
shear layer. The Journal of Fluid Mechanics 23 (1965) 521–544. pipes. The Journal of the Acoustical Society of America 54
2. P. Freymuth: On transition in a separated laminar boundary (1973) 1554–1564.
layer. The Journal of Fluid Mechanics 25 (1966) 683–704. 23. N.H. Fletcher: Jet drive mechanism in organ pipes. The
3. J.W. Coltman: Sounding mechanism of the flute and organ Journal of the Acoustical Society of America 60 (1976)
pipe. The Journal of the Acoustical Society of America 44 481–483.
(1968) 983–992. 24. L. Cremer, H. Ising: Die selbsterregten Schwingungen von
4. N.H. Fletcher: Sound production by organ flue pipes. Orgelpfeifen (The self-excited oscillation of organ pipes).
The Journal of the Acoustical Society of America 60 (1976) Acta Acustica United With Acustica 19 (1967) 143–153.
926–936. 25. S. Yoshikawa, J. Saneyoshi: Feedback excitation mechanism
5. N.H. Fletcher, S. Thwaites: Wave propagation on an in organ pipes. The Journal of the Acoustical Society of
acoustically perturbed jet. Acta Acustica United With Japan 1 (1980) 175–191.
Acustica 42 (1979) 323–334. 26. Y. Sawada, S. Sakaba: On the transition between the
6. S. Yoshikawa, H. Tashiro, Y. Sakamoto: Experimental sounding modes of a flute. The Journal of the Acoustical
examination of vortex-sound generation in an organ pipe: A Society of America 67 (1980) 1790–1794.
proposal of jet vortex-layer formation model. The Journal of 27. A. Ernoult, P. de la Cuadra, B. Fabre: An inclined plane:
Sound and Vibration 331 (2012) 2558–2577. A simple model for the acoustic influence of the flutist’s
7. N.H. Fletcher, L.M. Douglas: Harmonic generation in organ face. Acta Acustica United With Acustica 104 (2018)
pipes, recorders, and flutes. The Journal of the Acoustical 496–508.
Society of America 68 (1980) 767–771. 28. K. Arimoto: Experimental study on the temporal fluctuation
8. R. Auvray, A. Ernoult, B. Fabre: Time-domain simulation of of harmonics in flute sounds, in Proc. International Sympo-
flute-like instruments: Comparison of jet-drive and discrete- sium on Music Acoustics, 13–17 September, Detmold,
vortex models. The Journal of the Acoustical Society of Germany. 2019.
America 136 (2014) 389–400. 29. T. Matsuno, S. Honami, K. Fujii, S. Sekimoto, A. Iida: Flow
9. A.H. Benade: Fundamentals of Musical Acoustics, second, measurement technique. The Journal of Plasma and Fusion
revised edition. Dover Publications, 1990. Research 91 (2015) 661–664.
10. B. Fabre, J. Gilbert, A. Hirschberg, X. Pelorson: Aeroacous- 30. S. Yoshikawa: Jet-wave amplification in organ pipes. The
tics of musical instruments. Annual Review of Fluid Mechan- Journal of the Acoustical Society of America 103 (1998)
ics 44 (2012) 1–25. 2706–2717.
11. Y. Ando: Drive conditions of a flute and their influences upon 31. P. de la Cuadra, C. Vergez, B. Fabre: Visualization and
sound pressure level and fundamental frequency of generated analysis of jet oscillation under transverse acoustic pertur-
tone: An experimental study of a flute I. The Journal of the bation. The Journal of Flow Visualization and Image
Acoustical Society of Japan 26 (1970) 253–260. Processing 14 (2007) 355–374.14 K. Onogi et al.: Acta Acustica 2021, 5, 11
Appendix hj,min for yj,e/h = 0.17 and 0.24 almost correspond to hj,
min in Figure 12 measured for the head joint, the jet deflec-
The variations of harmonic structure with jet angle were tion with jet angle is almost the same between the flute with
also measured for a flute with a body and a foot joint. The the A4 fingering and the head joint.
measurements were performed with the fingering of A4. In addition, the variations of harmonic structure with
The lip-to-edge distance was fixed to the actual blowing jet angle were investigated for the fingerings of A4, A5
condition shown in Table 1 (l/h = 5.6). The flow rate was (880 Hz), and A6 (1760 Hz), as shown in Figure A.2. The
fixed to Q = 10 L/min (U0 = 13.4 m/s), where the funda- lip-to-edge distance and the jet offset were fixed to the
mental frequencies of radiated sounds were almost 440 Hz. actual blowing conditions shown in Table 1 (l/h = 5.6,
Figure A.1 shows the variations of the SPLs measured by yj,e/h = 0.24). The flow rate was fixed to Q = 16 L/min
fixing jet offsets to values within the practical range. The (U0 = 21.5 m/s) for A5 and Q = 32 L/min (U0 = 43.0
jet angle that DSPL exhibits its minimum is hj,min = 37° m/s) for A6. The radiated sounds were investigated within
for yj,e/h = 0.17 and hj,min = 43° for yj,e/h = 0.24. From this the range that the fundamental frequency is ± 10 cent of
result, the actual jet offset (ya,e/h) probably changes by A4, A5, or A6. With increasing jet angle, the curves of
about 0.07 due to the jet deflection when the jet angle
increases hj,min = 37° to 43°. Since the minimum angles
Figure A.2. Variations of harmonic structure with jet angle
measured for flute with A4, A5, and A6 fingering. Lip-to-edge
Figure A.1. Variations of harmonic structure with jet angle distance and jet offset were fixed to the actual blowing
measured for flute with A4 fingering. Lip-to-edge distance was conditions shown in Table 1 (l/h = 5.6, yj,e/h = 0.24). Flow
fixed to the actual blowing condition shown in Table 1 (l/h = 5.6). rate was fixed to Q = 16 L/min (U0 = 21.5 m/s) for A5 and
Flow rate was fixed to Q = 10 L/min (U0 = 13.4 m/s). Q = 32 L/min (U0 = 43.0 m/s) for A6.K. Onogi et al.: Acta Acustica 2021, 5, 11 15 DSPL for A5 and A6 almost remain flat in hj < 43° but harmonic. There is no noticeable shift in the DSPL curve increase in hj > 43°. For A4, A5, and A6 at yj,e/h = 0.24, with tone range. the actual jet offset seems to be zero around hj = 43°. From these results, the variations of harmonic structure The jet seems to deflect inside the edge with increasing with jet angle measured for the head joint can also occur jet angle in hj > 43°, which respectively promotes an over the flute’s three ranges. increase and a decrease of the second and the third Cite this article as: Onogi K, Yokoyama H & Iida A. 2021. Effects of jet angle on harmonic structure of sound radiating from the flute. Acta Acustica, 5, 11.
You can also read