STUDY REPORT Auckland housing forecasts and the Unitary Plan - IC Page
←
→
Page content transcription
If your browser does not render page correctly, please read the page content below
STUDY REPORT
           SR 295 (2013)

    Auckland housing
    forecasts and the
       Unitary Plan
               IC Page

The work reported here was funded by BRANZ
      from the Building Research Levy.

              © BRANZ 2013
             ISSN: 1179-6197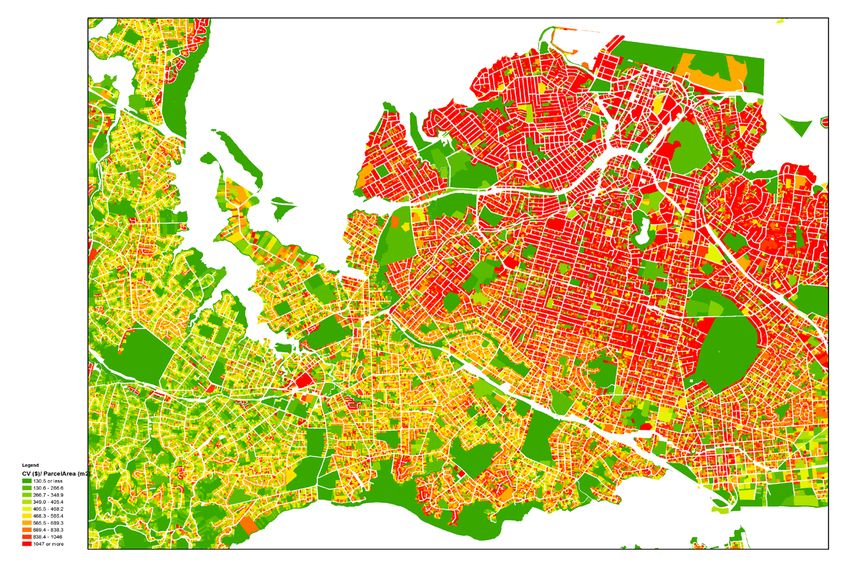
Preface
This report describes some aspects of the Auckland Plan related to zoning and the effect
on new housing. It was produced because it is believed new housing types in Auckland will
change from a predominance of detached to a larger percentage of multi-unit type housing.
This will be a mix of terraced housing and low, medium and high rise apartments.

Acknowledgments
This work was funded by the Building Research Levy.

Note
This report is intended for builders and designers. It provides details of the Auckland Plan
and the BRANZ interpretation of the types of housing, location and timing of their
construction.

                                             i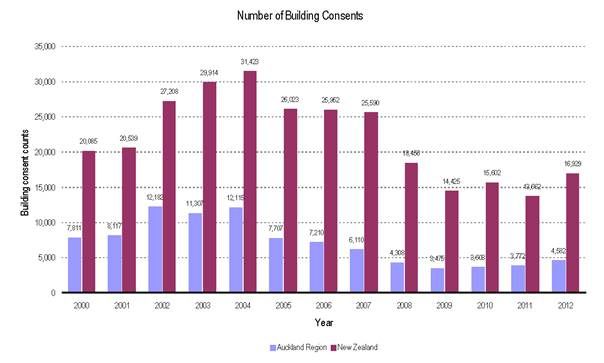
Auckland housing forecasts and the Unitary Plan

BRANZ Study Report SR 295
IC Page

Abstract
The Auckland Plan sets out the strategic direction for the future of Auckland. It covers
economic, social and environmental considerations, housing, physical infrastructure, and
transport. Included in the Plan are zones for various housing types, with an emphasis on
intensification of housing mainly within the planned metropolitan urban limit (MUL). The
relevance to the building industry is that housing types are changing and builders and
designers need to be aware the predominance of detached housing in new builds is coming
to an end.

                                           ii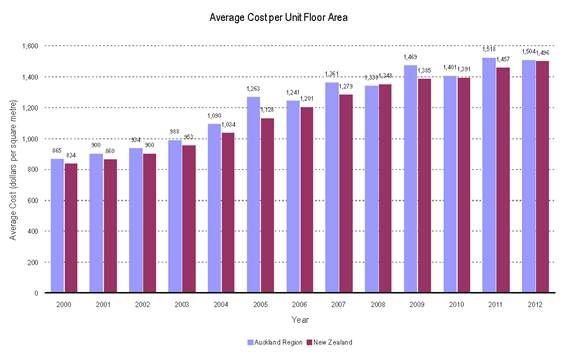
Contents                                                                                                                                                                  Page

1.   INTRODUCTION ......................................................................................................................... 1
2.   SUMMARY ................................................................................................................................... 1
3.   MAIN RESULTS .......................................................................................................................... 2
     3.1      Scenarios ...................................................................................................................................................... 4
     3.2      Affordability ................................................................................................................................................. 5
     3.3      Workloads .................................................................................................................................................... 6
4.   DISCUSSION.............................................................................................................................. 6
5.   REFERENCES .............................................................................................................................. 8
6.   APPENDIX ................................................................................................................................... 8
     6.1      Housing scenarios .................................................................................................................................. 8
     6.2      Affordability ...............................................................................................................................................10
     6.3      Workloads .................................................................................................................................................. 12
     6.4      Capital values across the council region ................................................................................17
     6.5      Redevelopment scenarios for selected sites........................................................................17
     6.6      Recent trends in Auckland’s new residential construction ........................................ 26

                                                                                 iii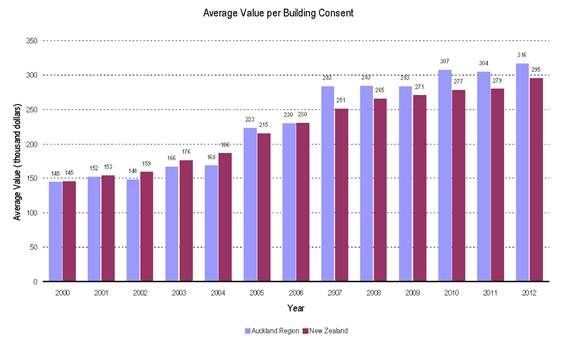
Figures                                                                                                             Page
Figure 1 Auckland housing forecasts ................................................................................ 3
Figure 2 Auckland new housing forecasts by zoning ......................................................... 4
Figure 3 Auckland existing house median prices............................................................... 5
Figure 4 New housing intensification scenarios ................................................................. 9
Figure 5 Capital value by land area – Central Auckland .................................................. 15
Figure 6 Capital value by land area – North Shore .......................................................... 16
Figure 7 Redevelopment example Avondale ................................................................... 18
Figure 8 Redevelopment example Balmoral.................................................................... 19
Figure 9 Redevelopment example New Lynn .................................................................. 20
Figure 10 Redevelopment example Onehunga ............................................................... 21
Figure 11 Redevelopment example Mt Albert ................................................................. 22
Figure 12 Redevelopment example Dominion Rd ........................................................... 23
Figure 13 Redevelopment example Avondale again ....................................................... 24
Figure 14 New housing development on bare land Flat Bush.......................................... 25
Figure 15 Number of residential consents in Auckland by year ....................................... 26
Figure 16 Average new dwelling consent value in Auckland by year ............................... 27
Figure 17 Average new dwelling consent floor areas in Auckland by year....................... 28
Figure 18 Average new dwelling consent $ per sqm of floor area in Auckland by year .... 29
Figure 19 Petrol and diesel price trends .......................................................................... 29

Tables                                                                                                              Page
Table 1 New housing scenarios ........................................................................................ 5
Table 2 Building forecasts for Auckland ............................................................................ 6
Table 3 Three new housing scenarios............................................................................. 10
Table 4 Household income and new house price – includes principal repayments.......... 11
Table 5 Household income and new house price – interest-only mortgage ..................... 11
Table 6 Cost of typical potential redevelopments ............................................................ 13
Table 7 Estimated total workloads on buildings ............................................................... 14

                                                          iv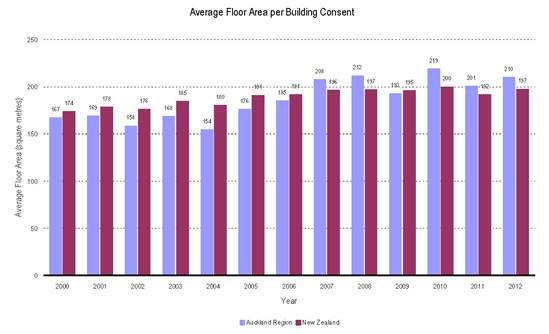
1.   INTRODUCTION
     The Auckland Plan was released by Auckland Council in March 2012. It provides
     estimates of new housing demand by urban centre classification and estimates of
     demand outside the urban limits, out to 2040. The subsequent draft Unitary Plan sets
     out land zoning at a detailed level and was issued in March 2013. It shows zoning at the
     lot level and hence indicates how individual owners could be affected by future
     developments. Subsequently, the zoning was revised in late September 2013 following
     extensive feedback from the community. The revisions mainly relate to the mixed
     housing zones where two sub-zones were developed.
     This report has used the September 2013 zoning maps to estimate the number of new
     houses by zone and type out to 2021. The forecast horizon is curtailed to 2021 for two
     reasons: first, the further ahead the less accurate the forecasts are likely to be; second,
     designers and builders are more interested in the immediate, rather than distant, future.
     Affordability has been a hot topic recently and some analysis on selected areas was
     done in this report to estimate likely sales prices of new housing. It confirms the analysis
     in the Auckland Plan that median income households will struggle to afford housing in
     Auckland. For completeness, renovation, alterations and additions work to the existing
     housing stock has been estimated because it is a significant proportion of builders’
     workloads.

2.   SUMMARY
     The main findings are:
        • The amount of bulk-serviced green field land is sufficient for about 15,000 sections.
           There are also approximately another 22,000 scattered sections in suburban and
           rural areas. These two sources can theoretically supply about three years of
           demand, although as not all existing sections are easy to build on, probably only
           two years of supply is available in reality.
        • In parallel with these ready-to-go sections there is demand for redeveloped sites
            within the Metropolitan Urban Limit (MUL) and for new green field sites outside
            the MUL.
        • Due to the time constraints, new green field sources are unlikely to be ready within
           four years and most demand between years two to four will need to be met with
           infill and site redevelopment. It is likely some redevelopment will occur earlier due
           to demand for units in established suburbs.
        • A large number of land parcels within the MUL are suitable for redevelopment and
           BRANZ estimates prices as low as $318,000 per unit may be possible with four-
           storey apartment developments.
        • Less intensive redevelopment in mixed housing zones are estimated by BRANZ to
           be priced at between $470,000 to $880,000 per unit, depending on location.
           These are in developments of between four and 15 units per land parcel (typically
           900 sqm to 1700 sqm land area) and are typically attached townhouses or
           terraced housing.
        • In the eight years to 2021 approximately 84,000 new units will be required and it is
            anticipated approximately 44% of these, or 37,000, will be attached units. The

                                               1
remainder will be detached houses and about 6000 of them are assumed to be
outside the current MUL and built on sections not ready until after 2018.
• Builders need to be aware that multi-unit construction will become a significant part
of future work and they may need to reorganise their firms, including joining with
others (developers, other builders), to undertake these larger projects.
• Alterations and additions work remains a significant part of future building
workloads, about 38% of housing and commercial work, but it is declining as a
percentage of total workloads.
• An increase in building work is forecast for the next eight years. On average,
dwelling-related value of work is likely to be up 56% on current workloads.
3. MAIN RESULTS
New housing starts are recovering nationally from a 40-year low reached last year. Most
growth is occurring in Auckland and Canterbury. In Auckland new starts are expected to
more than double. Over the next eight years to 2021 BRANZ estimates the average
number of new dwelling units required in Auckland will be about 10,500 per year,
contrasting with 4800 consents in the year to March 2013. This is a significant increase
in demand and will stretch the capacity of the industry in Auckland.
Another major change is that the proportion of new multi-unit consents is expected to
steadily rise. BRANZ forecasts are for an increase from about 20% now to 60% in 2021,
see Figure 1. The multi-units will be mainly terraced housing and low-rise apartments.
Detached house builders will be able to adapt to the smaller multi-unit developments,
but for the larger projects, i.e. apartments four storeys or more, some detached housing
builders may wish to scale up their operations, perhaps by merging with other small-
scale colleagues.
The type of new housing depends on the zoning of the land and the BRANZ forecast to
2021 is shown in Figure 2.
Vacant section capacity scattered within the MUL is about 22,000 and many of these are
expected to be used in the next eight years. In addition, several green field sites have
been zoned residential within the MUL and have capacity for about 15,000 housing units.
Most are near bulk infrastructure (water supply, waste water disposal) and many are
immediately ready for building as roading and individual connections have been made.
In the single housing zone infill is permitted provided each house has a minimum land
area of 500 sqm. This option is the easiest for builders, apart from having a vacant
section, especially when the existing house does not need to be moved and/or access
is available around it for construction.
In the mixed housing zones the public feedback was that intensive development is not
wanted so two sub-zones were developed. In the suburbs the maximum is two storeys
and a minimum of 400 sqm land area per dwelling. In the “so-called” urban mixed zone
up to three storeys are allowed and there is a minimum of 300 sqm of land per dwelling.
On land larger than 1200 sqm the allowable density is one dwelling per 200 sqm of land
for the suburban mixed housing zone and unlimited density for the urban mixed housing
zone. However, only moderate uptake of these sites is envisaged at about 17% of
capacity over the next eight years.
The terraced housing/apartment zones are near town centres and along transport routes
where up to four storeys is allowed. Due to public opposite of redevelopment in suburban
areas we have assumed the percentage uptake of terraced housing-zoned sites will be
2higher compared to the mixed zones, but still only 20% of capacity over the next eight
years. The former also allows for cheaper housing due to the greater densities.
In business areas (town, metro and city centres) housing can be developed to four, six,
eight or more storeys, depending on the zone, and this is all multi-unit construction. This
business zone is a significant source for new housing, accounting for about 19%.
Rural areas have a large number of vacant plots and many parcels that can be sub-
divided to some extent. These are mainly located in the old Rodney and Franklin districts,
but low numbers are expected in these zones.
Auckland new dwelling consents
16,000
Govt and council say 39,000 in three years
14,000
12,000 All housing
Attached housing
Consent number
10,000 BRANZ forecast average
10,500 per year in eight years
8,000 to 2021
6,000
4,000
2,000
0
11 12 13 14 15 16 17 18 19 20 21
March Year
Figure 1 Auckland housing forecasts
Lastly, the BRANZ forecasts assume there will be some detached housing on new green
field sites which are adjacent to services in rural and coastal towns. Also, some land is
rezoned residential near or adjacent to the current MUL at Warkworth, Silverdale, Kumeu
and Pukekohe. This slice is 8%, see Figure 2, and would have been larger but it is
believed it will take a significant time to develop the required infrastructure.
The Unitary Plan now goes through a three-month second submission process and it is
likely any changes will be small.
3New housing 2013 to 2021 - Expected outcome
9
Vacant sections & green field in MUL
30
16 Single house zone infill
Mixed housing zone
Terraced housing & apartmts zone
6
15
9
Redevelopmt CBD, metro, town centres
Numbers are (000)s units
Total 84,000 units
Rural and green field outside MUL
Figure 2 Auckland new housing forecasts by zoning
3.1 Scenarios
The above is the BRANZ expectation of the new housing mix. However, the actual mix
will depend on redevelopment opportunities within the MUL, including costs,
preferences, affordability and any council and Government encouragement of particular
developments. It is uncertain how successful intensification will be and the exact mix
between infills, low-rise developments and medium to high rise developments is
unknown.
Three scenarios are shown in Table 1 and further details on how these were derived are
in Section 6.1 of the Appendix. The middle scenario is the one used for the numbers by
zone reported above. The total number of units is the same in the three scenarios,
namely an 80,000 increase in household capacity by 2021. Demolition replacements are
included in the number of new units and this amount differs depending on the scenario.
The more intensive the scenario, the greater the number of demolitions required. The
zoning mix changes from low redevelopment on existing sites, the expected outcome
presented in Figure 2 and a scenario with quite high redevelopment within the MUL and
no green field developments outside the MUL.
The three scenarios give quite different outcomes for the proportion of detached housing,
ranging from 90% to 34%.
4Table 1 New housing scenarios
New housing by zone type scenarios - BRANZ estimates
Number of units 2013 to 2021 (000)
Redevelopment within the MUL
Low Expected High
Vacant sections ready now 20 18 9
Green field within MUL 14 12 11
Single house zone infill 7 6 4
Mixed housing suburban zone 4 6 8
Mixed housing urban zone 1 3 3
Terraced housing/apartments zone 7 15 30
Redevelopmt (CBD, metro,town centres) 5 16 22
Rural areas 8 3 0
Green field outside MUL 16 7 0
82 84 87
Detached housing % 90% 56% 34%
The new housing totals differ slightly because different demolition
replacements are required in the three scenarios. New households to be
accomodated is 85,000 households in all scenarios.
3.2 Affordability
Affordability of new housing depends on the deposit available and household income.
For most first-time buyers it is difficult. With a 15% deposit and a household income of
about $85,000 a house price of about $420,000 is affordable. This assumes repayments
are no more than 30% of income and interest rates at 5.5%. Existing house prices in
most of Auckland are above this level, see Figure 3.
Median house prices - Auckland
$600,000
$500,000
$400,000
$300,000
$200,000
Source: REINZ
$100,000
$0
Figure 3 Auckland existing house median prices
5BRANZ estimates that low-rise new apartments, about 65 sqm to 90 sqm floor area net,
can be provided at this cost in New Lynn or Onehunga but not in the more central
suburbs. Inner-city apartments are also available at this price but the units are quite
small. More details of affordability are in the Appendix.
3.3 Workloads
The estimated workloads over the next few years are shown in Table 2. At present
building work (excluding civil infrastructure) is about $5.5 billion a year in Auckland so a
40% increase on average is estimated for the next few years. Approximately 10,500 new
housing units per year are required through to 2021. The Appendix has historic data on
housing trends and indicates a peak in the 2002 to 2004 period of about this amount. So
the industry is capable of this level in Auckland but it will entail rebuilding capacity and
scaling up of existing firms’ activities.
Table 2 Building forecasts for Auckland
Building work in Auckland
BRANZ forecasts
$m per year
2013 Average
to 2021
New housing 1,529 3,293
Residential additions & alterations (consented) 618 867
Residential repairs and maintenance (not consented) 1,435 1,413
Non-residential new & additions (consented) 1,473 1,667
Non-residential repairs & maintenance (not consented) 443 460
5,498 7,699
Non-consented A&A is assumed to be three times consented A&A for housing
based on the Household Economic Survey. For non-residential bldgs assume a
a factor of 1.0 on consented work for non-consented R&M work.
The forecasts include Auckland Plan demand and maintenance requirements of the
existing housing stock, plus non-residential building needs. More details are in Section
6.2 of the Appendix.
4. DISCUSSION
The Plan calls for 100,000 new dwelling units between April 2013 and March 2021. In
fact, due to demolitions the total of new builds required by the Plan is about 105,000 in
the eight-year period. That is an average of over 13,000 new units per year, compared
to the current 4800 annually. It will be a challenge to scale up construction volumes and
we believe the industry will struggle to get to our forecast of 84,000 units in the period.
The BRANZ forecasts assume a significant four-fold increase in multi-unit construction
from about 1500 per year now to 4700 per year on average over the next eight years.
6The greater part of demand will still be met by detached houses, averaging about 5800
per year through to 2021.
Vacant section capacity is about 22,000 units and much of this is likely to be built on first.
Zoned green field sites within the MUL have a capacity of about 15,000 units. These are
in variously-sized land blocks which are already serviced at their boundary and can be
quickly made ready for sale (within 12 months or less for roading, cabling and
water/waste connections to individual sections). It is assumed much of these two sources
will be used first, however they only provide about three years of demand. Assuming a
preference for detached housing there is an urgent need to develop more green field
sites, in particular those already identified outside the MUL in Silverdale, Warkworth,
Kumeu and Pukekohe.
The latter sites will not all be ready within the next four years and hence demand will
increasingly be within the MUL on existing occupied sites. In the single and mixed
housing zones there is large capacity for infill and redevelopment. Due to the
demographics it seems likely much of this will be attractive to households sizing down
and also as first homes for young people. Young people are likely to be able to afford
the intensive multi-units whereas the infill is likely for families trading up.
The terraced housing zones provide 15,000 units in the period to 2021 and are mainly
on sites where the existing building is demolished.
So we are likely to see significant volumes of low-rise intensification in the mixed housing
and terrace/apartment zones, as indicated in the draft Plan. On average the BRANZ
forecast is for 4700 new attached units and another 5800 detached houses per year.
It is interesting to compare these numbers to earlier forecasts prepared by BRANZ (Page
2007). In 2007 the forecasts were 5300 attached units per year and 3800 detached
houses per year for the ten years finishing 2021. So the earlier forecasts were lower in
total and a greater proportion of multi-units was assumed. As we have been under-
building in recent years the total numbers need to be higher than earlier forecast to catch
up. This report is less optimistic than the earlier report about the acceptability of multi-
units for new owners and hence the multi-unit proportion is lower than in the earlier
report.
Several locations and actual sections were chosen to illustrate a number of possible
redevelopments. The example multi-unit redevelopments shown in Figure 6 to Figure 12
in the Appendix have a price range from $318,000 per unit for 81 sqm in a four-storey,
48-unit apartment complex in New Lynn to $484,000 in a smaller-scale development for
116 sqm, in a 24-unit terraced housing complex in Balmoral. The small redevelopments
are the more expensive per unit, typically in the range of $650,000 to $750,000 per
dwelling.
Escalation of 40% in the 2011 Capital Value amounts has been assumed, but this may
be an underestimate given recent sale prices. If we assume a doubling of the 2011 CV
this raises the price for the New Lynn apartments to about $334,000 per unit, which is
still reasonably “affordable”. A household income of between $55,000 and $75,000,
depending on the mortgage type, is sufficient to afford this unit.
Redevelopment appears to work best on large sections or when adjacent sections can
be combined. Under the proposed rules a land parcel of over 1200 sqm allows for at
least six dwelling units per site in the mixed housing zones. Over 20 units are possible
in an apartment zone. This demonstrates the potential of intensification in existing areas
of single-house land parcels.
Further public feedback on the second iteration of the Unitary Plan is underway. But it is
likely there will be minimal changes in the Plan and any will be advised mid-2014.
75. REFERENCES
Auckland Council (2012) The Auckland Plan.
Auckland Council (2012) Capacity for growth study 2012 Technical Report 2013/010
April 2013.
Auckland Council (2013) Auckland Unitary Plan.
BRANZ (2013) http:www.branz.co.nz/ then Toolbox, then Auckland Atlas of
Construction, accessed 15 July 2013.
Page I (2007) Changing housing need. Study Report No. 183. Building Research
Association of New Zealand.
6. APPENDIX
This Appendix contains:
• Details of the three new housing scenarios.
• Affordability criteria.
• Building workload details.
• Possible redevelopments on selected sites.
• Housing consent trends in recent years in Auckland.
6.1 Housing scenarios
The three scenarios are:
• Low redevelopment – a high proportion of demand is provided by one or two-house
infills and in green field developments outside the MUL. Redevelopment of
business centres for housing is quite low.
• Medium redevelopment – infill is reduced and instead these sites are redeveloped
for medium density housing up to four storeys. There is still significant green field
development outside the MUL.
• Intensive redevelopment – most new housing is provided in the mixed housing and
terraced housing zones, and in the business centres. There are no new green
field developments.
The numbers are derived from the Auckland Council capacity for Growth 2012 study, in
which an assessment was done by council staff of plot development/redevelopment
potential in the two housing zones (mixed, terraced) and in the business zones. The chart
and table shows the results based on BRANZ assumptions on the percentage uptake of
these potential developments by 2021.
In the expected (or moderate) scenario the assumed uptake in the mixed zones is quite
low at 15% to 20% to reflect community concern about moving away from existing
housing densities. However, terraced housing, near local and town centres, is likely to
be more acceptable than the earlier widespread distribution of this zone. Some medium
to high rise CDB, metro and town centre development is foreseen, as the likely
purchasers, namely young singles and some empty nesters, find the lifestyle attractive.
8New housing 2013 to 2021
100
80
Number (000)
60
40
20
0
Low intensification Medium intensification High intensification
Vacant sections & Greenfield in MUL Single house zone infill
Mixed housing zone Terraced housing & apartmts zone
Redevelopmt CBD, metro, town centres Rural and greenfield outside MUL
Figure 4 New housing intensification scenarios
9Table 3 Three new housing scenarios
New housing scenarios 2013 to 2021
At 22nd Sep 2013 Forecast new housing numbers
Demo replace New units Detached Terraced Med- Detached/ Terraced Med-hi
Low intensification within MUL New housing units Assumptions (000) (10) required or semi units hi rise semi (000) units (000) rise (000)
Vacant sections capacity 20.0 (1) 90% uptake 0 20.0 90% 10% 0% 18.0 2.0 0.0
Green field within MUL 13.5 (2) 90% uptake 0 13.5 90% 10% 0% 12.2 1.4 0.0
Single house zone, infill 7.3 (3) 25% uptake 0 7.3 100% 0% 0% 7.3 0.0 0.0
Mixed housing suburban zone 3.1 (4) 10% uptake 0.9 4.1 90% 10% 0% 3.6 0.4 0.0
Mixed housing urban zone 1.0 (5) 10% uptake 0.3 1.4 20% 80% 0% 0.3 1.1 0.0
Terraced housing/apartments zone 6.2 (6) 10% uptake 1.2 7.5 0% 90% 10% 0.0 6.7 0.7
Redevelopmt (CBD, metro,town ctres) 5.2 (7) 5% uptake 0 5.2 0% 40% 60% 0.0 2.1 3.1
Rural areas 7.5 (8) 30% uptake 0 7.5 100% 0% 0% 7.5 0.0 0.0
Green field outside MUL 15.6 (9) balance needed 0 15.6 90% 10% 0% 14.0 1.6 0.0
79.5 2.5 82.0 62.9 15.2 3.9
90% 10% 0%
Moderate intensification within MUL
Vacant sections capacity 17.8 (1) 80% uptake 0 17.8 90% 10% 0% 16.0 1.8 0.0
Green field within MUL 12.0 (2) 80% uptake 0 12.0 90% 10% 0% 10.8 1.2 0.0
Single house zone, infill 5.8 (3) 20% uptake 0 5.8 100% 0% 0% 5.8 0.0 0.0
Mixed housing suburban zone 4.7 (4) 15% uptake 1.4 6.1 90% 10% 0% 5.5 0.6 0.0
Mixed housing urban zone 2.1 (5) 20% uptake 0.6 2.7 20% 80% 0% 0.5 2.2 0.0
Terraced housing/apartments zone 12.5 (6) 20% uptake 2.5 15.0 0% 90% 10% 0.0 13.5 1.5
Redevelopmt (CBD, metro,town ctres) 15.7 (7) 15% uptake 0 15.7 0% 40% 60% 0.0 6.3 9.4
Rural areas 2.5 (8) 10% uptake 0 2.5 100% 0% 0% 2.5 0.0 0.0
Green field outside MUL 6.5 (9) balance needed 0 6.5 90% 10% 0% 5.9 0.7 0.0
79.5 4.5 84.0 47.0 26.1 10.9
56% 31% 13%
High intensification within MUL Per year = 5.9 3.3 1.4
Vacant sections capacity 8.9 (1) 40% uptake 0 8.9 90% 10% 0% 8.0 0.9 0.0
Green field within MUL 10.5 (2) 70% uptake 0 10.5 90% 10% 0% 9.5 1.1 0.0
Single house zone, infill 4.4 (3) 15% uptake 0 4.4 100% 0% 0% 4.4 0.0 0.0
Mixed housing suburban zone 6.2 (4) 20% uptake 1.9 8.1 90% 10% 0% 7.3 0.8 0.0
Mixed housing urban zone 2.6 (5) 25% uptake 0.8 3.4 20% 80% 0% 0.7 2.7 0.0
Terraced housing/apartments zone 24.9 (6) 40% uptake 5.0 29.9 0% 90% 10% 0.0 26.9 3.0
Redevelopmt (CBD, metro,town ctres) 21.9 (7) 21% uptake 0 21.9 0% 40% 60% 0.0 8.8 13.2
Rural areas 0.0 (8) 0% uptake 0 0.0 100% 0% 0% 0.0 0.0 0.0
Green field outside MUL 0.0 (9) balance needed 0 0.0 90% 10% 0% 0.0 0.0 0.0
Total 79.5 7.6 87.1 29.8 41.2 16.1
34% 47% 19%
(1) to (8) Source is "Capacity for growth study 2012: Results" Technical Report 2013/010, April 2013, Auckland Council
(1), (2), (3) Potential is 22,200, 15,000, and 49,100 housing units respectively.
(4),(5), (6) Uses redevelopment potential of residential zones (116,000 units) and assumes 30% mixed suburban, 10% mixed urban and 60% terraced/apartment zoning.
(7) Redevelopment in business areas capaicity is 103,900 units.
(8) Rural areas capacity is 25,000 units.
(9) Green field outside MUL is the required extra needed to get the 84,000 new units over the eight-year period. (Warkworth, Silverdale, Kumeu, Pukekohe)
(10) Demolition replacements are required in the mixed housing and the terraced housing zones. The assumption is 0.3 demolition per new units in the mixed zone
and 0.2 units in the terraced housing/ apartment zone.
6.2 Affordability
Table 4 shows the housing package that is affordable at different income levels. The
table assumes mortgage repayment outgoings of 30% of household income. The amount
of deposit available is assumed to increase with income, as shown in the tables. The
current median household income in Auckland is about $81,000 for wage and salary
earners. This equates to an affordable housing package of about $380,000.
Table 4 assumes repayment of the principal within 25 years but interest-only loans allow
a significant increase in borrowings, see Table 5. The median income household can
now afford a house priced at $515,000.
Interest rates are currently at a long term low and are expected to rise in 2014. If they
increase to 7% then the affordable packages are $335,000 and $405,000 respectively
for principal repayment and interest-only loans.
10Table 4 Household income and new house price – includes principal repayments
Affordable house price modelling
Principal repayments included
Household income $ Deposit % House price $
50,000 10% 194,226
60,000 10% 233,072
70,000 10% 271,917
80,000 15% 329,042
90,000 15% 370,173
100,000 15% 411,303
110,000 15% 452,433
120,000 20% 524,411
130,000 20% 568,112
140,000 20% 611,813
160,000 20% 699,215
Interest rates = 7.0%
Loan period = 25 years
Mortgage repayments as % of income = 30%
USPWF= 11.65
Table 5 Household income and new house price – interest-only mortgage
Affordable house price modelling
Interest payments only
Household income $ Deposit % House price $
50,000 10% 238,095
60,000 10% 285,714
70,000 10% 333,333
80,000 15% 403,361
90,000 15% 453,782
100,000 15% 504,202
110,000 15% 554,622
120,000 20% 642,857
130,000 20% 696,429
140,000 20% 750,000
160,000 20% 857,143
Interest rates = 7.0%
Mortgage repayments as % of income = 30%
Some potential redevelopments allowed by the Plan were trialled in different zones and
suburbs as shown in Table 6. The parameters are based on the Unitary Plan (September
2013) specifications. The summary of the trials is in Table 6 and the details for each site
are shown in Figure 7 to Figure 11 in Section 6.5 of the Appendix. These are actual sites
but the addresses have been omitted to preserve existing owner anonymity in potential
redevelopments.
116.3 Workloads
The estimated total workloads in Auckland on building work are shown in Table 7. The
value of work averages about $8 billion over the next few years. At present workloads
are about $5.5 billion.
The forecasts allow for new housing based on the Moderate scenario in Table 3. There
is a “normal” level of additions and alterations to existing housing related to adapting a
house to the new owner or the changing family needs of the exiting owner. In addition,
we have an aging stock of houses. The 1960s and 1970s were periods of large scale
house building in Auckland and as these now average about 50 years in age they are
beginning to need major renovation, repairs and maintenance. Many will be demolished
and the sites redeveloped in accordance with the Plan. But the majority will remain where
they are and will need significant work so they can continue to provide housing services
to their occupants.
This report is mainly focused on housing but as commercial work often uses similar
resources it has been included to complete the picture. Its growth is estimated at about
11% on average over the next few years.
12Table 6 Cost of typical potential redevelopments
Cost of typical redevelopments Price
Total $/sqm
Location Zoning Number Total CV Redevelopment Gross Site Total Price floor area
of land land area 2010/11 Comment # storeys # units sqm Footprint cover price per unit (includes
parcels sqm $M per unit sqm % $M $000 land)
Blockhouse Bay Rd Single house 1 1012 0.64 Infill, exist hse OK 1 2 161 322 32% 1.43 713 4430
Balmoral, Milton Rd Mixed, suburban 1 1673 1.70 Demolish 1 house 2 8 165 662 40% 5.8 723 4368
New Lynn, Margan Ave THAB 3 2436 1.12 Demolish 3 houses 4 48 81 976 40% 15.3 318 3912
Onehunga, Forbes Rd Mixed Urban 2 1664 1.37 Demolish 2 house 2.5 11 126 686 41% 7.1 649 5166
Mt Albert, Benfield Ave Mixed Suburban 1 890 0.76 Move exist hse back 1 2 150 236 27% 1.8 922 6149
Balmoral, Dominion Rd THAB 2 1241 1.25 Demolish 2 houses 4 24 116 696 56% 11.6 484 4173
Avondale, Blockhse B Rd Mixed Suburban 1 1011 0.44 Demolish 1 house 1 2 198 396 39% 1.6 810 4089
Flat Bush, empty section Mixed Urban 1 1200 0.86 New section 2.5 12 142 681 57% 6.3 523 3685
Court Cres Panmure Mixed Urban 2 1533 0.82 Demolish 2 houses 2 12 138 825 54% 5.1 426 3100
Assume:
Purchase price percentage above 2011 CV 40%
Rebuild cost terraced housing/apartments to 4 storey 3000 $/sqm THAB = Terrace housing & apartment buildings zone.
Rebuild cost terraced housing/apartments to 3 storey 2500 $/sqm
Rebuild cost one-two storey detached houses 2000 $/sqm
Profit on costs 15%
The cheapest units occur in New Lynn at $318,000 each in a four-storey apartment development. This development has scale economies
of three adjacent sections and the ability to fit a large number of units on the amalgamation. However, when the total cost is divided by the
total floor area provided then the Flat Bush development is the “best value”, mainly because the capital value only includes land and not an
existing house as in the other options. The Avondale development has a high cost per house but the total cost per square metre of land is
quite low and indicates purchasers are “getting more for their dollar”. It indicates that demolishing existing housing on the cheaper sites and
redeveloping for two houses may become widespread.
13Table 7 Estimated total workloads on buildings
Building workloads in Auckland to 2021
Multi- Detached Totals $/sqm $/sqm Floor area sqm $ million
units Multi- Detached Multi- Detached Multi- Detached
New housing (Moderate scenario) (000) (000) (000)
Vacant sections capacity 2 16 18 $2,000 $1,700 80 200 284 5,435
Green field next eight years 1 11 12 $2,000 $1,700 80 200 192 3,672
Single house zone, infill 0 6 6 $2,200 $1,800 80 200 0 2,102
Mixed housing suburban zone 1 5 6 $2,200 $1,800 100 200 134 1,969
Mixed housing urban zone 2 1 3 $2,500 $1,800 100 200 540 195
Terraced housing/apartments zone 15 0 15 $3,000 $1,800 100 200 4,488 0
Redevelopmt (CBD, metro,town centres) 16 0 16 $3,500 $1,700 80 200 4,385 0
Rural areas 0 3 3 $2,000 $1,700 80 200 0 850
Green field outside MUL 1 6 7 $2,000 $1,700 80 200 104 1,995
Total 37 47 84 10,128 16,217
26,345 Year to
$ million per year Mar-13
Other residential work New housing per year to 2021 = 3,293 1,529
Consented alteration/additions consents (i.e. normal level of routine A&A consents) 471 478
Consented renovations to the aging stock (130,000 1950s, 1960s houses @ $40K each repaired over 20 yrs) 210 -
Leaky housing consented repairs (approx $9 billion and 33% in Auckland, 50% repaired by 2021) 186 139
Non-consented repairs and maintenance work (three times consented A&As) 1,413 2,279 1,435
Non-residential buildings
New and A&A consented work (approx $4.0 billion per year all NZ, excl Cant EQ, and 37% in Auckland) 1480 1,455
Leaky Non-res bldgs in Auckland (approx $3 billion all NZ, 35% Auckland, repaired over 15 years) 70 18
Earthquake strengthening (approx $5 billion all NZ, 35% in Auckland, strengthened over 15 years) 117 -
Non-consented repairs and maintenance work (assumed equal to consented A&A non-res work) 460 2,127 443
Average workloads per year 2013 to 2021 $m = 7,699 5,498
% increase = 40%
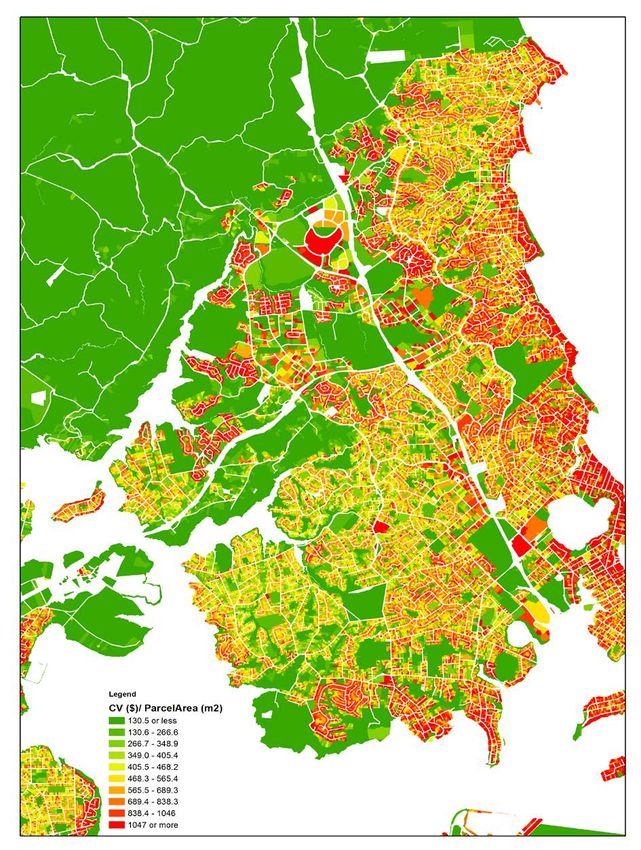
14Figure 5 Capital value by land area – Central Auckland
15Red = over $1000/sqm, Yellow/orange = $400-$700/sqm, Green = $100-$400/sqm
Figure 6 Capital value by land area – North Shore
166.4 Capital values across the council region
Figure 4 and Figure 5 above show selected areas of the council region. The different
colours represent varying ratios of capital value divided by land area in square metres
which have been calculated for all land parcels in the region.
The charts give an indicator of the value proposition of redeveloping a site for more
intensive housing. Red colours represent sites where the likely purchase price is high
per unit of land and the redevelopment would need to be quite intensive and/or for high-
cost housing. The yellows represent sites where redevelopment is likely to be feasible at
lower intensities and for lower cost housing. Orange is in between. Green generally
represents industrial areas, reserves, schools and parks, however it also includes
undeveloped residential zoned land within the MUL.
The capital values are mainly from the 2011 revisions, so they are somewhat out-of-date.
However, they indicate certain patterns such as a general trend of higher unit costs in
the CBD and on the shore lines. As we move away from these areas the unit cost
declines. For example, moving south from the CBD along Dominion and Sandringham
Roads, the dark reds change to light reds, oranges and yellows. These types of maps
can be produced at larger scales to better identify localised redevelopment potential.
6.5 Redevelopment scenarios for selected sites
Particular parcels of land within the mixed housing and apartment/terraced housing
zones were assessed for their redevelopment potential. Actual land parcels are shown
in Figure 6 to Figure 12. In all cases there are existing dwellings on these sites. The
assumption was they would be demolished and the site redeveloped. In some cases two
or three adjacent sections have been amalgamated to enable a large apartment to be
constructed. The requirements in the Unitary Plan on heights, unit density, boundary
distances and coverage have been followed.
Construction costs are shown. The existing property purchase price is also shown and
assumes a 40% premium on existing valuations. This may be an underestimate given
recent trends in prices so the new unit prices to buyers may be on the optimistic side.
17Blockhouse Bay Rd, Avondale
One section Zoned Single housing
Total land area = 1012 sqm Infill permitted as have> 1000sqm section.
N
10
3
existing
house
15
(remains)
23.0 66.0
20.0
5.0
road frontage
2.5 8.6 5.0
16.1 m
Site cover = 322 sqm = 32%
Existing house remains 10.0 m wid x 15.0 m = 150 sqm ea
New house 8.6 m wide x 20.0 m = 171.8 sqm
Costs
Demolish, build, landscaping, etc $2000/sqm bldg
New houses 0.34 $M
Purchase land/house = 0.896 SM 11/12 CV + 40%
Profit 15% 0.19 $M
1.43 $M Ave price / hse= 713 $000
Figure 7 Redevelopment example Avondale
18Milton Rd, Balmoral
One section Zoned terraced housing/ apartments
Total land area = 1673 sqm
N
section plan
57.7 m
10
29 15.5
3.5
7.5 42.7 m 7.5
road frontage
Demolish existing house and replace with 4 storey apartments
Site cover = 661.9 sqm = 40%
Assume 7 units/ level = 6.1 m wide x 15.5 m = 94.55 sqm ea
deduct 15% for services/ stairs, etc 80.37 sqm ea
Number of units = 28
Costs
Demolish, build landscaping, etc $3000/sqm bldg
New Apartments 7.94
Purchase land/house = 2.38 SM allow 40% above CV.
Profit 15% 1.55 $M
11.87 $M
Price per unit = 424 $000
Figure 8 Redevelopment example Balmoral
19Margan Ave, New Lynn
Amalgamate 3 adjacant sections Zoned Terraced housing/ apartments
Total land area = 2436 sqm
N
road frontage
7.5 30.7 7.5
45.7
3.5
15.9
53.3
15
15.9
3
Demolish existing houses and replace with two 4 storey apartments
Site cover = 976.3 sqm = 40%
Assume 6 units/ level = 5.12 m wide x 15.9 m = 81.36 sqm ea
deduct 15% for services/ stairs, etc 69.15 sqm ea
Number of units = 48
Costs
Demolish, build landscaping, etc $3000/sqm bldg
New Apartments 11.72 $M
Purchase land/house = 1.57 SM allow 40% above CV.
Profit 15% 1.99 $M
15.28 $M
Price per unit = 318 $000
Figure 9 Redevelopment example New Lynn
20Forbes Rd Onehunga
Amalgamate 2 adjacant sections Zoned Mixed housing
Total land area = 1664 sqm
N
road frontage
4.0 24.8 m 2.0
30.8
2.5
12.0
54
20 36.7
4.0 12.5 6.0 6.3 2.0 2.8
Demolish existing houses & replace with 14 two(or2.5) storey terraced houses
Site cover = 779 sqm = 47%
Front 5 units= 4.96 m wide x 12.0 m = 119.1 sqm ea
Back 6 units (2.5 storeys) = 6.12 m wide x 6.3 m = 96.34 sqm ea
Back4 units= 5 m wide x 12.5 m = 125 sqm ea
Number of units = 15
Costs
Demolish, build, landscaping, etc $2500/sqm bldg
New terraced hses 4.18 $M
Purchase land/house = 1.92 SM allow 40% above CV.
Profit 15% 0.92 $M
7.02 $M
Average price per unit = 468 $000
Figure 10 Redevelopment example Onehunga
21Benfield Ave, Mt Albert
One section Zoned Mixed housing
Total land area = 890 sqm
N
11.0
2.1
52.0
48.0 63.0
4.0
road frontage
3.0 7.5 5.0
15.5 m
Demolish existing house and replace with four 1.5 storey terraced houses
Site cover = 360 sqm = 40%
Assume 4 townhouses 7.5 m wide x 12.0 m = 135 sqm ea
Number of units = 4
Costs
Demolish, build, landscaping, etc $2000/sqm bldg
New terraced hses 1.08 $M
Purchase land/house = 1.06 SM allow 40% above CV.
Profit 15% 0.32 $M
2.47 $M
Average price per unit = 616 $000
Figure 11 Redevelopment example Mt Albert
22Dominion Rd Balmoral
Amalgamate 2 adjacant sections Zoned Mixed housing use
Total land area = 1041 sqm
N
road frontage
8.0 15.0 5.0
28 m
2.5
39.8
34.3
3.0
Demolish existing house and replace with five 2 storey terraced houses
Site cover = 514.5 sqm = 49%
Units= 6.86 m wide x 15.0 m = 205.8 sqm ea
Number of units = 5
Costs
Demolish, build, landscaping, etc $2000/sqm bldg
New terraced hses 2.06 $M
Purchase land/house = 1.75 SM allow40% above CV.
Profit 15% 0.57 $M
4.38 $M
Average price per unit = 876 $000
Figure 12 Redevelopment example Dominion Rd
23Blockhouse Bay Rd, Avondale
One section Zoned Mixed housing
Total land area = 1011 sqm
N
3.0
26.5
65.2
6.7
26.5
2.5
road frontage
2.5 9.0 4.0
15.5 m
Demolish existing house and replace with four 1.5 storey terraced houses
Site cover = 477 sqm = 47%
Assume 5 townhouses
Front 2 units 9.0 m wide x 13.3 m = 178.9 sqm ea
Back 2 units 9.0 m wide x 13.3 m = 178.9 sqm ea
Number of units = 4
Costs
Demolish, build, landscaping, etc $2000/sqm bldg
New terraced hses 1.43 $M
Purchase land/house = 0.62 SM allow 40% above CV.
Profit 15% 0.31 $M
2.35 $M
Average price per unit = 589 $000
Figure 13 Redevelopment example Avondale again
24New development, Flat Bush
One section Zoned Mixed housing
Total land area = 1200 sqm
N
3.0
25.0
60.0
7.5
22
2.5
road frontage
2.5 12.5 5.0
20 m
Demolish existing house and replace with five 2 storey terraced houses
Site cover = 588 sqm = 49%
Assume 5 townhouses
Front 4 units 5.5 m wide x 12.5 m = 137.5 sqm ea
Back 5 units 5.0 m wide x 12.5 m = 125 sqm ea
Number of units = 9
Costs
Section, landscaping 0.8 $M
New terraced hses 2.35 $M $2000/sqm bldg
Profit 15% 0.47 $M
3.62 $M
Average price per unit = 403 $000
Figure 14 New housing development on bare land Flat Bush
256.6 Recent trends in Auckland’s new residential construction
Construction trends and other building related data is presented as charts on the BRANZ
website (BRANZ 2013). The following charts are from the Auckland Atlas of
Construction, developed by Hans Roberti of BRANZ, and the commentary on the charts
is his.
Construction of new residential buildings is sensitive to economic cycles. Over the period
of 13 years covered in the regional trends graphs in the atlas it is clear that the Auckland
new housing market went through the same boom and subsequent bust period as the
rest of New Zealand, see Figure 13. This bust period was caused by the global economic
downturn. The activity in Auckland during the boom was three and a half times higher
than during the bust when only 3475 consents were issued. Compared to the national
figures it appears that the Auckland market was hit twice as hard by the crisis. The reason
for this is not clear. There might have been some other factors at work. For instance, the
change of the Building Code in 2004 triggered by the leaky homes problems also seems
to have subdued building activity in Auckland by 37% from 12,115 in 2004 in to 7707 in
2005. The scale of the drop in building activity at the national level over the same period
indicates that the effect is almost exclusively linked to Auckland. Production seems to
stabilise on this new production level (around 7000) in the second part of the boom period
that ended in 2007.
Figure 15 Number of residential consents in Auckland by year
To meet Auckland’s population growth prognosis, housing production will have to return
to peak boom period production levels of over 11,000 dwellings per year. Will Auckland
be able to create the required conditions that will allow the industry to deliver to the plan
ambitions? The previous period might already contain some lessons on the structure of
housing supply under different market conditions.
26Figure 16 Average new dwelling consent value in Auckland by year
If we look at the change in investment per building consent in the graph on average value
per building consent, see Figure 14, then we can see a doubling of the amount of money
per project over the period. The boom and bust does not seems to have any impact on
this trend. In 2012, average values in Auckland were priced 7% above the New Zealand
average, whereas they were similar or lower ten years before. Costs appear on average
to increase by 8% per year in Auckland. According to Reserve Bank figures inflation was
on average around 2.6% per year over this period with fluctuations of about a percentage
point around this value. Therefore the cost increase was more than triple the inflation
rate. From 2004-2005 and from 2006-2007 there appears to have been a jump in the
prices in Auckland that was not visible in the national figure. The first jump could be a
result of changes in the Building Code in 2004. The only event that coincides with the
second jump is the change of Clause H1/AS1 in the acceptable solution of the Building
Code.
27Figure 17 Average new dwelling consent floor areas in Auckland by year
Another driver might have been a change in what was actually built. For this we can
evaluate the trend in the average floor area per building consent, see Figure 15. The
physical size of new buildings increased 30% in Auckland. The average annual increase
over the period was 2.7%. There appears to have been a step change with the main shift
in demand happening between 2004 and 2007. Before the shift new buildings were about
160 square metres, after the shift they were around 210 square metres. The national
increase is about 15%. New buildings in Auckland used to be smaller, currently they are
on average larger than the national figure. Therefore an appetite for larger buildings is
partially responsible for the increased value per building consent.
Larger new housing is not the whole reason because the cost increase per unit floor area
is still 5.2% per year, which is about 2.8% above the average inflation level in the period
(see Figure 16 for trends in dollars per square metre). Therefore, new built residential
construction has become significantly more expensive at a steady rate over the previous
decade. Over the same period average real gross domestic product has risen at a rate
of 2.7% per year. Under these conditions it is clear that the increased purchasing power
of New Zealanders will not result in the construction of more square metres unless a
larger fraction of household income is spent on new builds.
What will be the impact of this increase and what mechanisms are driving it? Given that
housing affordability is already an issue in Auckland, rising construction costs will not
help. Therefore it will be essential for the sector to indicate the sources of this substantial
rise in cost. This will not be easy since low productivity growth has been persistent in the
sector for decades. The business model in the construction sector appears to change
only very slowly.
28Figure 18 Average new dwelling consent $ per sqm of floor area in Auckland by year
Figure 19 Petrol and diesel price trends
What other factors are driving cost increases in construction? Could some of the increase
be transport-related? Petrol and diesel prices over this period are shown in the 2011
New Zealand energy data file produced by the former Ministry of Economic Development
(now part of the new Ministry of Business, Innovation and Employment). We can see that
petrol prices have increased on average by 6.5 % per year and diesel by 7.3% per year.
Corrected for inflation we would still look at a net increase of 3.5% to 4% for fuel. This is
a tremendous rise that is bound to have an effect on the cost of construction materials,
since they are typically bulky and therefore high-volume and low-value. Literature
indicates that circa 30% of the cost of construction is hidden transport costs. Therefore
it seems appropriate to attribute a significant fraction of the cost increase in new
residential construction to a rise in transport costs. However, does the sector recognise
its sensitivity to it?
29You can also read