Lakeland-Winter Haven, Florida - COMPREHENSIVE HOUSING MARKET ANALYSIS
←
→
Page content transcription
If your browser does not render page correctly, please read the page content below

The analysis presented in this report includes data from the early stages of
the COVID-19 outbreak in the United States. The unprecedentedly large and
rapid changes in many data series, and the similarly unprecedentedly large
policy responses, make analysis of, and longer run predictions for, the economy
and housing markets exceptionally difficult and uncertain. HUD will continue to
monitor market conditions in the HMA and provide an updated report/addendum
in the future.

      COMPREHENSIVE HOUSING MARKET ANALYSIS
      Lakeland-Winter Haven, Florida

      U.S. Department of Housing and Urban Development,
      Office of Policy Development and Research
      As of October 1, 2020

      Share on: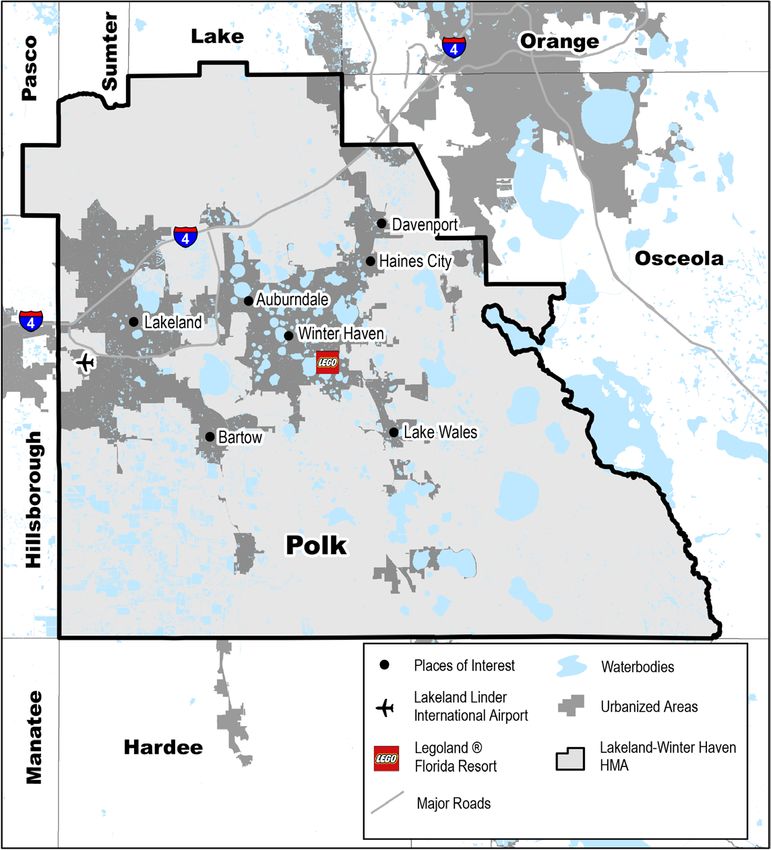
Lakeland-Winter Haven, Florida Comprehensive Housing Market Analysis as of October 1, 2020                                                                              Executive Summary 2

Executive Summary
Housing Market Area Description
The Lakeland-Winter Haven Housing Market Area (HMA)
in central Florida consists of Polk County, Florida, and is
coterminous with the Lakeland-Winter Haven, FL Metropolitan
Statistical Area (MSA). The HMA is about 35 miles east of
the city of Tampa and 35 miles west of the city of Orlando.
The HMA is home to LEGOLAND® Florida Resort and the
headquarters of Publix Super Markets, Inc. (hereafter, Publix).
Historically, the production of processed citrus and commercial
phosphate was important to the local economy, but in the past
20 years, the economy in the HMA has diversified.
                                                                                                 Tools and Resources
The current HMA population is estimated at 706,400.                                               Find interim updates for this metropolitan area, and select geographies nationally,
                                                                                                  at PD&R’s Market-at-a-Glance tool.
                                                                                                  Additional data for the HMA can be found in this report’s supplemental tables.
                                                                                                  For information on HUD-supported activity in this area, see the Community Assessment Reporting Tool.

                                                                                                  Comprehensive Housing Market Analysis Lakeland-Winter Haven, Florida
                                                                                             U.S. Department of Housing and Urban Development, Office of Policy Development and Research
Lakeland-Winter Haven, Florida Comprehensive Housing Market Analysis as of October 1, 2020 Executive Summary 3
Market Qualifiers
Economy Sales Market Rental Market
Weak: Approximately 63 percent Balanced: Existing home sales Balanced: The number of rental
of the jobs lost in March and April declined 5 percent and the average units permitted surged in 2019, with
2020, at the start of the COVID-19 sales price for an existing home 2,675 units permitted—more than
pandemic, were recovered by increased 9 percent during the 75 percent higher than the previous
September 2020. 12 months ending September 2020. record in 2006.
During the 12 months ending September 2020, The home sales market is balanced, with an The overall rental housing market is balanced
nonfarm payrolls decreased by 2,900 jobs, or estimated sales vacancy rate of 2.0 percent— with a current rental vacancy rate estimated at
1.2 percent, to 230,600 jobs, compared with a down from 4.3 percent in 2010. During the 7.5 percent, down from 15.8 percent in 2010.
7,800-job, or 3.4-percent, increase during the 12 months ending September 2020, new and The apartment market is also balanced, with
previous 12 months. Before the onset of the existing home sales decreased by 320, or a vacancy rate of 4.1 percent during the third
COVID-19 pandemic, payrolls had increased 2 percent, whereas the average home sales quarter of 2020—down from 4.3 percent a year
every year since 2010. Job losses during price increased 6 percent, or by $13,200, to earlier (Reis, Inc.). During the same period, the
the past 12 months were most severe in the $221,800 (Zonda). During the forecast period, average apartment rent was unchanged, at $973.
leisure and hospitality sector, with a decline demand is estimated for 8,125 new homes. During the forecast period, demand is estimated
of 2,600 jobs, or 10.6 percent. During the The 2,225 homes under construction are for 3,125 units. The 4,075 units under construction
3-year forecast period, nonfarm payroll growth expected to meet a portion of demand during will exceed the anticipated demand during the
is expected to average 1.1 percent annually. the first year of the forecast period. entire forecast period.
TABLE OF CONTENTS
Economic Conditions 4 3-Year Housing Demand Forecast
Sales Units Rental Units
Population and Households 9 Total Demand 8,125 3,125
Lakeland-Winter Haven HMA
Home Sales Market 11 Under Construction 2,225 4,075
Rental Market 16 Notes: Total demand represents estimated production necessary to achieve a balanced market at the end of the forecast period. Units under
construction as of October 1, 2020. Sales demand includes an estimated demand for 300 mobile homes. The forecast period is October 1, 2020,
Terminology Definitions and Notes 20 to October 1, 2023.
Source: Estimates by the analyst
Comprehensive Housing Market Analysis Lakeland-Winter Haven, Florida
U.S. Department of Housing and Urban Development, Office of Policy Development and ResearchLakeland-Winter Haven, Florida Comprehensive Housing Market Analysis as of October 1, 2020 Economic Conditions 4
Economic Conditions the education and health services sector, with 14 percent each (Figure 1). Ranked 87 on Fortune 500, the
largest employer in the HMA is Publix Super Markets, Inc. With 12,500 employees (Table 1), Publix is the
Largest Sector: Wholesale and Retail Trade largest employee-owned company in the world. Publix is also a major contributor to the professional and
business services sector, the sector with the most jobs gained since 2001 (Figure 2). The number of jobs
The mining, logging, and construction
in the sector doubled, from 16,100 in 2000 to 32,300 currently. The HMA also attracts more than 5 million
sector was one of the few sectors to gain
tourists each year, with LEGOLAND® Florida Resort (hereafter, LEGOLAND) and its affiliated and unaffiliated
jobs in the 12 months ending September
hotels and resorts being the backbone of the local leisure and hospitality sector. Tourists spent $1.5 billion
2020, adding 1,200 jobs, or 8.5 percent.
That gain was due mostly to the job in 2019 in the HMA, on pastimes including shopping, accommodations, and entertainment (Central Florida
increases in the construction industry and Visitors & Convention Bureau).
exemptions to COVID-19 countermeasures.
Figure 1. Share of Nonfarm Payroll Jobs in the Lakeland-Winter Haven HMA, by Sector
Primary Local Local 10% Mining, Logging, & Construction 7%
Economic Factors State 2%
The Lakeland-Winter Haven HMA is home to the Federal 1% Manufacturing 8%
Amazon.com, Inc. (hereafter, Amazon) air hub, the
Other Services 3%
largest in the Southeast region, which opened in Government Wholesale 5%
the summer of 2020, and the new Walmart Inc. 13%
(hereafter, Walmart) e-commerce fulfillment facility, Leisure & Hospitality 9%
which has been operating since 2017. The two
Total Trade 17%
facilities are the result of a combined investment 230.6 Retail 12%
of $400 million and created as many as 1,800 new
jobs. The HMA connects the cities of Tampa and
Orlando through the Interstate 4 corridor, which, Education & Health Services 14%
along with an intermodal logistics center for rail
Transportation & Utilities 9%
freight from the rest of the country, contributed to
Information 1%
growth in the transportation and utilities sector.
The wholesale and retail trade sector is the largest Professional & Business Services 14%
Financial Activities 6%
in the HMA, with 17 percent of all jobs during the
12 months ending September 2020, followed by Notes: Total nonfarm payroll is in thousands. Percentages may not add to 100 percent due to rounding. Based on 12-month averages through
September 2020.
the professional and business services sector and Source: U.S. Bureau of Labor Statistics
Comprehensive Housing Market Analysis Lakeland-Winter Haven, Florida
U.S. Department of Housing and Urban Development, Office of Policy Development and ResearchLakeland-Winter Haven, Florida Comprehensive Housing Market Analysis as of October 1, 2020 Economic Conditions 5
Table 1. Major Employers in the Lakeland-Winter Haven HMA The Effects of the
Name of Employer Nonfarm Payroll Sector Number of Employees COVID-19 Pandemic
Publix Super Markets, Inc. Professional & Business Services 12,500 The COVID-19 pandemic has severely weakened
Lakeland Regional Health Systems, Inc. Education & Health Services 5,575 the economy in the Lakeland-Winter Haven HMA,
Walmart Inc. Wholesale & Retail Trade 4,250 as countermeasures to slow the spread of the
Geico Corp. Financial Activities 3,700 disease were put in place. On March 17, 2020,
City of Lakeland Government 2,800 restrictions were put in place on bars and
Winter Haven Hospital, Inc. Education & Health Services 2,200 nightclubs, followed by the closing of restaurants
Watson Clinic LLP Education & Health Services 1,875
3 days later. On April 1, 2020, the governor issued
a statewide stay-at-home order, which was relaxed
LEGOLAND® Florida Resort Leisure & Hospitality 1,500+
in May. By June, major tourist attractions began to
The Mosaic Company Manufacturing 1,350
reopen, with lower capacity and safety precautions;
Polk State College Government 1,200
LEGOLAND was the first major resort in central
Note: Excludes local school districts and county government.
Source: Central Florida Development Council
Florida to reopen. Along with the reopening of
the resort, LEGOLAND went forward with previous
plans to open a new hotel, Pirate Island Hotel,
Figure 2. Sector Growth in the Lakeland-Winter Haven HMA, 2001 to Current but because safety and health measures limited
Total Nonfarm Payroll Jobs
hotel and resort capacity, an undisclosed number
Goods-Producing Sectors of LEGOLAND workers were laid off. As a result of
Mining, Logging, & Construction efforts to curb the pandemic, nonfarm payrolls fell
Manufacturing by 23,100 jobs, or 9.7 percent, in March and April
Service-Providing Sectors
before recovering 7,400 jobs in May. An additional
Wholesale & Retail Trade
Transportation & Utilities
5,600 jobs were recovered from June through
Information September; however, payrolls remain 10,100 jobs
Financial Activities below February levels. The large number of job
Professional & Business Services losses stemming from the COVID-19 pandemic
Education & Health Services
Leisure & Hospitality
has had an enormous effect on the unemployment
Other Services rate in the HMA. The unemployment rate peaked
Government in May 2020 at 17.6 percent but dropped to
-30 -20 -10 0 10 20 30 40 50 60 70 80 90 100 110 8.4 percent in September 2020. In February 2020,
Change in Jobs (%) the month before the pandemic was declared,
Note: The current date is October 1, 2020. the unemployment rate in the HMA had been
Source: U.S. Bureau of Labor Statistics 3.5 percent.
Comprehensive Housing Market Analysis Lakeland-Winter Haven, Florida
U.S. Department of Housing and Urban Development, Office of Policy Development and ResearchLakeland-Winter Haven, Florida Comprehensive Housing Market Analysis as of October 1, 2020 Economic Conditions 6
Current Conditions— Figure 3. 12-Month Average Nonfarm Payrolls in the Lakeland-Winter Haven HMA
Nonfarm Payrolls 250
National Recession Nonfarm Payrolls
During the 12 months ending September 2020,
Nonfarm Payrolls (in Thousands)
nonfarm payrolls in the HMA decreased by 2,900 230
jobs, or 1.2 percent, to 230,600, compared with
an increase of 3.4 percent, or 7,800 jobs, during 210
the previous 12 months (Figure 3). Approximately
190
63 percent of the jobs lost in March and April
2020 were recovered through September 2020. 170
Job losses were greatest in the leisure and
hospitality sector, which decreased by 2,600 150
jobs, or 10.6 percent, in the 12 months ending
Se 1
Se 2
Se 3
Se 4
Se 5
Se 6
Se 7
Se 8
Se 9
0
0
1
2
3
4
Se 5
Se 6
Se 7
Se 8
Se 9
Se 0
-0
-0
-0
-0
-0
-1
-1
-1
-1
-1
-1
-1
-1
-1
-1
-2
-0
-0
-0
-0
-0
pt
pt
pt
pt
pt
pt
pt
pt
pt
pt
pt
pt
pt
pt
pt
pt
pt
pt
pt
pt
pt
Se
Se
Se
Se
Se
Se
September 2020 because of a decline in tourism
(Table 2). Note: 12-month moving average.
Sources: U.S. Bureau of Labor Statistics; National Bureau of Economic Research
Declines were also strong in the education and
health services sector, which lost 1,200 jobs, Table 2. 12-Month Average Nonfarm Payroll Jobs (1,000s) in the Lakeland-Winter Haven HMA, by Sector
or 3.5 percent, compared with an increase of 12 Months Ending 12 Months Ending Absolute Change Percentage Change
800 jobs, or 2.5 percent, during the previous September 2019 September 2020
Total Nonfarm Payroll Jobs 233.5 230.6 -2.9 -1.2
12 months, in part due to state-issued guidelines
Goods-Producing Sectors 32.0 33.1 1.1 3.4
prohibiting all unnecessary medical procedures Mining, Logging, & Construction 14.1 15.3 1.2 8.5
from March 20 through April 30. The largest Manufacturing 17.9 17.9 0.0 0.0
increase in jobs during the past 12 months was Service-Providing Sectors 201.4 197.5 -3.9 -1.9
in the mining, logging, and construction sector, Wholesale & Retail Trade 40.2 39.8 -0.4 -1.0
Transportation & Utilities 20.1 20.2 0.1 0.5
which gained 1,200 jobs, or 8.5 percent—twice
Information 1.9 1.9 0.0 0.0
as many jobs as during the previous 12 months. Financial Activities 13.1 13.5 0.4 3.1
This reflects the fast pace of construction Professional & Business Services 32.3 32.3 0.0 0.0
projects that were already in progress before Education & Health Services 34.2 33.0 -1.2 -3.5
the pandemic, such as the new Auto Inspection Leisure & Hospitality 24.5 21.9 -2.6 -10.6
Other Services 6.6 6.2 -0.4 -6.1
and Reconditioning Center built by Carvana
Government 28.6 28.8 0.2 0.7
Co. that is expected to open in late 2020. Also Notes: Based on 12-month averages through September 2019 and September 2020. Numbers may not add to totals due to rounding. Data are in thousands.
contributing to continued growth in the sector, Source: U.S. Bureau of Labor Statistics
Comprehensive Housing Market Analysis Lakeland-Winter Haven, Florida
U.S. Department of Housing and Urban Development, Office of Policy Development and ResearchLakeland-Winter Haven, Florida Comprehensive Housing Market Analysis as of October 1, 2020 Economic Conditions 7
construction jobs were classified as essential during Figure 4. 12-Month Average Unemployment Rate in the Lakeland-Winter Haven HMA and the Nation
the pandemic and therefore were not affected as
significantly as jobs in some other sectors. Lakeland-Winter Haven HMA Nation
14.0
Current Conditions— 12.0
12.1%
Unemployment
Unemployment Rate (%)
10.0
The average unemployment rate for the 12 months
8.0
ending September 2020 was 8.1 percent—more than 4.7%
9.7%
twice the 3.8-percent rate from the 12 months ending 6.0 3.6%
September 2019 and the highest rate since 2013
4.0
(Figure 4). The unemployment rate in the HMA has
3.6%
been higher than the national rate since 2008 except 2.0 3.6%
for before the pandemic, during the 12 months ending 0.0
February 2020, when the HMA and national rates
Se 0
Se 1
Se 2
Se 3
Se 4
Se 5
Se 6
Se 7
Se 8
Se 9
Se 0
Se 1
Se 2
Se 3
Se 4
Se 5
Se 6
Se 7
Se 8
Se 9
0
-0
-0
-0
-0
-0
-0
-0
-0
-0
-0
-1
-1
-1
-1
-1
-1
-1
-1
-1
-1
-2
were equal. The unemployment rate has been higher
pt
pt
pt
pt
pt
pt
pt
pt
pt
pt
pt
pt
pt
pt
pt
pt
pt
pt
pt
pt
pt
Se
in the HMA than in the nation during the pandemic
because of the relatively large number of leisure and Note: Based on the 12-month moving average.
Source: U.S. Bureau of Labor Statistics
hospitality sector jobs associated with LEGOLAND.
Economic Periods
to gains in the sector was the opening of the new Publix headquarters in 2002, which resulted in 1,200
of Significance new jobs by 2006. The only sector that declined was the manufacturing sector, which was down by an
2003 through 2007 average of 200 jobs, or 1.3 percent, annually. The shutdown of three mines and two phosphate plants by
From 2003 through 2007, before the effects The Mosaic Company resulted in the permanent loss of 1,560 mining and manufacturing jobs during the
of the Great Recession, nonfarm payrolls in the period. A boom in residential construction during the period resulted in construction subsector job growth
HMA increased by an average of 6,000 jobs, or offsetting mining and logging subsector job losses and contributing to growth of an average of 400 jobs,
3.1 percent, annually. Approximately 38 percent of or 3.0 percent, annually in the mining, logging, and construction sector. The education and health services
new jobs were in the professional and business sector increased by an average of 1,100 jobs, or 4.4 percent, annually, reflecting an increased need for
services sector, which increased by an average of hospitals stemming from population growth during the period. Lakeland Regional Health Medical Center,
2,300 jobs, or 9.7 percent, annually. Contributing currently the fifth largest hospital in Florida, opened a new wing in 2005, with approximately 280 beds.
Comprehensive Housing Market Analysis Lakeland-Winter Haven, Florida
U.S. Department of Housing and Urban Development, Office of Policy Development and ResearchLakeland-Winter Haven, Florida Comprehensive Housing Market Analysis as of October 1, 2020 Economic Conditions 8
2008 through 2011 utilities sector and the professional and business services sector each had
The Great Recession had a significant effect on the economy in the HMA, average annual increases of 1,000 jobs, or 6.2 and 3.6 percent, respectively,
with nonfarm jobs falling by an average of 5,000 jobs, or 2.5 percent, a annually. O’Reilly Automotive, Inc., expanded its auto parts stores and
year from 2008 through 2011. As the demand for housing weakened, the constructed a distribution center in 2014, adding 400 new jobs. The creation
mining, logging, and construction sector lost an average of 1,500 jobs, or of a significant number of warehouses, depots, and distribution centers
10.5 percent, annually, and the professional and business services sector contributed to growth in the transportation and utilities sector. The CSX
declined by an average of 1,500 jobs, or 5.3 percent, annually—each Intermodal Logistics Center opened in the city of Winter Haven in 2014, as rail
accounting for 30 percent of losses. Job losses were widespread and freight was routed away from the city of Orlando. Combined with other major
affected every private sector except the education and health services expansions of infrastructure connecting the cities of Orlando and Tampa, such
sector, which gained an average of 400 jobs, or 1.2 percent, annually. as improvements to local airports, the hub contributed to job gains in the
transportation and utilities sector. The leisure and hospitality sector increased
In 2009, the Cyprus Gardens theme park in the city of Winter Haven was
by an average of 900 jobs, or 4.1 percent, which was the second fastest rate
shut down, which led to a decrease in tourism, affecting both the leisure
of growth in the HMA. The opening of the Streamsong Resort in 2015, the
and hospitality and the wholesale and retail trade sector. The closed park
LEGOLAND Hotel in 2015, and the LEGOLAND Beach Retreat in 2017 also
was subsequently bought and reopened in 2011 as LEGOLAND, adding an
contributed to growth in the sector.
undisclosed number of jobs. The reduction in consumer demand accounted
for a decline in trade—a loss of 800 jobs, or 2.2 percent, annually. The Job growth during the 2012-through-2019 period also occurred in the trade,
manufacturing sector lost the same number of jobs, declining an average healthcare, and construction industries. The wholesale and retail trade sector
of 4.7 percent annually, and the leisure and hospitality sector decreased increased by 900 jobs, or 2.4 percent, a year; part of that growth is attributed
by an average of 100 jobs, or 0.6 percent, annually. to the opening of the Lakeland Park Center shopping mall in 2014, which
created 200 new jobs. The education and health services sector maintained a
2012 through 2019 pace of 600 jobs, or 1.8 percent, added annually, in response to the education
Nonfarm payrolls in the HMA began to recover in 2012 and increased at a rate and healthcare demands of an increasing population. The mining, logging,
of 5,600 jobs, or 2.7 percent, a year through 2019. Growth from 2012 through and construction sector increased by an average of 500 jobs, or 4.2 percent,
2019 was widespread across all private sectors. The transportation and annually, partially due to an increase in residential and commercial construction.
Employment Forecast
During the forecast period, nonfarm payrolls are expected to increase an during the next few years, adding up to 700 jobs, which will contribute to
average of 1.1 percent annually. Job growth is likely to occur at a slower continued job growth in the professional and business services sector. Also,
pace compared with recent years because recovery from the pandemic is Nucor Corporation is building a steel manufacturing facility in the second half
expected to occur more slowly in service-providing sectors, especially the of 2020 that is expected to create 250 new jobs, which will contribute to job
leisure and hospitality sector. Publix has plans to expand its headquarters gains in the manufacturing sector.
Comprehensive Housing Market Analysis Lakeland-Winter Haven, Florida
U.S. Department of Housing and Urban Development, Office of Policy Development and ResearchLakeland-Winter Haven, Florida Comprehensive Housing Market Analysis as of October 1, 2020 Population and Households 9
Population and Table 3. Lakeland-Winter Haven HMA Population and Household Quick Facts
2010 Current Forecast
Households Population
Quick Facts
Population
Average Annual Change
602,095
11,800
706,400
9,950
729,800
7,800
Current Population: 706,400 Percentage Change 2.2 1.5 1.1
2010 Current Forecast
From 2015 to 2019, net in-migration
Household Households 227,485 260,500 269,000
was strong, averaging 14,000 people
Quick Facts Average Annual Change 4,025 3,150 2,850
annually and accounting for 94 percent Percentage Change 2.0 1.3 1.1
of population growth during the period. Notes: Average annual changes and percentage changes are based on averages from 2000 to 2010, 2010 to current, and current to forecast.
The forecast period is from the current date (October 1, 2020) to October 1, 2023.
Sources: 2000 and 2010—2000 Census and 2010 Census; current and forecast—estimates by the analyst
Population Trends
As of October 1, 2020, the population of the population growth (Figure 5). The Great Recession contributed to a sharp decrease in net in-migration
Lakeland-Winter Haven HMA, is estimated at in the HMA. From 2007 to 2012, population growth slowed to 4,275 people, or 0.7 percent, annually;
706,400, representing an average increase of net in-migration slowed to 2,200 people annually, or 51 percent of population growth. Since 2012, a
9,950, or 1.5 percent, annually since April 2010 strong local economy has contributed to relatively high levels of net in-migration, whereas an increased
(Table 3). Net in-migration averaged 8,900 portion of the population ages 65 and older contributed to lower net natural increase. Average annual
annually reflecting strong job growth. Net natural population growth in the HMA rose to 12,000, or 1.8 percent, since 2012, with net in-migration reaching
change (resident births minus resident deaths)
an average of 11,050, or 92 percent of total population growth, annually, and net natural change slowing
has averaged 1,050 people annually since 2010
to 950 people a year.
but has been declining since 2007 because an
increasing portion of the population are 65 years Age Cohort Trends
and older. From 2010 to 2018, Lakeland—the The fastest growing age cohort from 2010 to 2019 was the 65-and-older cohort, having increased from
largest city in the HMA—gained, on average, 18.0 percent of the population in 2010 to 20.6 percent of the population in 2019 (2010 and 2019 American
1,550 people, or 1.5 percent, annually, to reach Community Survey [ACS] 1-year data). The population size and portion of each of the five smaller age
110,500, whereas Winter Haven, the next largest
subcategories of the 65-and-older age cohort increased during the period. The only other age cohort to
city, grew by 1,025 people, or 2.7 percent,
increase during the period was the cohort ages 25 to 34, which increased from 11.8 percent in 2010 to
annually, to 43,000.
13.2 percent in 2019 (Figure 6).
From April 2000 to July 2007, when the economy
was generally expanding, population growth in Household Trends
the HMA averaged 14,100 people, or 2.7 percent, Similar to population growth trends, household growth in the HMA since 2010 has been slower than
annually. Net in-migration during that period during the 2000s. The current number of households in the HMA is estimated at 260,500, an average
averaged 12,150 people, or 86 percent of total annual increase of 3,150, or 1.3 percent, since 2010—slightly lower than the rate of population growth,
Comprehensive Housing Market Analysis Lakeland-Winter Haven, Florida
U.S. Department of Housing and Urban Development, Office of Policy Development and ResearchLakeland-Winter Haven, Florida Comprehensive Housing Market Analysis as of October 1, 2020 Population and Households 10
Figure 5. Components of Population Change in the
which was 1.5 percent during the same period. Lakeland-Winter Haven HMA, 2000 Through the Forecast
By comparison, from 2000 to 2010, household
Net Natural Change Net Migration Population Growth
growth averaged 4,025, or 2.0 percent, annually.
22,000
An increase in doubling up of households and 20,000
a trend of delayed household formation that 18,000
Population Change
16,000
began in the late 2000s as a result of the Great 14,000
12,000
Recession have contributed to the slower pace 10,000
in household growth since 2010. The average 8,000
6,000
household size rose from 2.52 in 2000 to 2.59 4,000
2,000
in 2010 and is currently estimated at 2.66. 0
Nationally, household size dropped from 2.59 in
t
t
20 018
rr -Cu 9
01 1
02 2
03 3
04 4
05 5
06 6
07 7
08 8
09 9
10 0
11 1
12 2
13 3
14 4
15 5
16 6
20 017
t-F ren
as
01
2000 to 2.58 in 2010 and was back up to 2.61
20 00
20 00
20 00
20 00
20 00
20 00
20 00
20 00
20 00
20 01
20 01
20 01
20 01
20 01
20 01
20 01
ec
-2
-2
-2
-2
-2
-2
-2
-2
-2
-2
-2
-2
-2
-2
-2
-2
-2
-2
-2
r
or
17
18
00
in 2019 (Decennial Census and 2019 ACS 1-year
20
Cu 19
en
20
data). For the HMA, homeownership has been
falling: from 73.4 percent in 2000 to 70.5 percent Notes: Net natural change and net migration totals are average annual totals over the time period. The forecast period is from the current date
in 2010, with a further decrease to 68.9 percent, (October 1, 2020) to October 1, 2023.
Sources: U.S. Census Bureau; current to forecast—estimates by the analyst
currently, because of the large increase in
rental households. Figure 6. Population by Age Range in the Lakeland-Winter Haven HMA
2010 2019
Forecast 25%
The population of the HMA is expected to increase
an average of 1.1 percent annually during the 20%
forecast period, reflecting relatively slower job
15%
growth compared with recent years. During the
period, net in-migration is expected to account
10%
for 93 percent of population growth. Net natural
increase is expected to continue to slow due to
5%
an increasing portion of residents aged 65 and
older. Households are expected to increase by
0%
an average of 2,850, or 1.1 percent, a year, a pace 0 to 14 15 to 24 25 to 34 35 to 44 45 to 54 55 to 64 65+
in line with population growth.
Sources: U.S. Census Bureau; 2010 and 2019 American Community Survey [ACS] 1-year data
Comprehensive Housing Market Analysis Lakeland-Winter Haven, Florida
U.S. Department of Housing and Urban Development, Office of Policy Development and ResearchLakeland-Winter Haven, Florida Comprehensive Housing Market Analysis as of October 1, 2020 Home Sales Market 11
Home Sales Market $221,800, compared with a 9-percent increase
in the previous 12 months. Existing homes were
Market Conditions: Balanced responsible for almost all the increase during the
past year because new home prices increased less
New home sales accounted for 27 percent of total home sales during the 12 months ending than one-half percent. The relative affordability of
September 2020. housing in the HMA has contributed to population
growth in recent years. During the 12 months
Current Conditions ending September 2020, new and existing home
The sales housing market in the Lakeland-Winter Haven HMA is currently balanced, with an estimated sales prices averaged $295,800 and $334,400 for
2.0-percent vacancy rate (Table 4)—down from 4.3 percent in 2010. The inventory of homes for sale the Tampa-St. Petersburg-Clearwater, FL MSA and
fell to 2.2 months during September 2020, a decrease from the 3.1-month supply in September 2019 the Orlando-Kissimmee-Sanford, FL MSA—33 and
and slightly lower than the national inventory of 2.3 months (CoreLogic, Inc.). During the 12 months
51 percent higher, respectively, than the average
ending September 2020, new and existing home sales (including single-family homes, townhomes,
price in the Lakeland-Winter Haven HMA.
and condominiums) totaled 16,650—a 2-percent decrease from the number of homes sold a year
earlier, compared with a decrease of 5 percent nationally (Zonda). Before the start of the COVID-19 New and Existing Home Sales
pandemic, home sales were already declining in the HMA due to low inventory. The average sales price Sales of new homes totaled 4,550 in the
for new and existing homes increased 6 percent during the 12 months ending September 2020, to 12 months ending September 2020—7 percent
higher than a year earlier, compared with a
Table 4. Home Sales Quick Facts in the Lakeland-Winter Haven HMA
near-record-high increase of 25 percent for the
Lakeland-Winter Haven
Nation 12 months ending September 2019. New home
HMA
Vacancy Rate 2.0% NA sales peaked at 8,000 in 2005, during the
Months of Inventory 2.2 2.3 housing boom, before declining by an average
Total Home Sales 16,650 4,268,000 of 1,200, or 31 percent, annually, to a low of
Home Sales 1-Year Change -2% -5% 840 in 2011, following the Great Recession
Quick Facts New Home Sales Price $253,200 $405,600 (Figure 7). As the economy improved and in-
1-Year Change 0% 2% migration accelerated, new home sales increased
Existing Home Sales Price $209,700 $333,000 every year from 2012 through 2019, averaging
1-Year Change 9% 6% 450, or 23 percent, annually, to approximately
Mortgage Delinquency Rate 6.0% 4.4% 4,450 homes in 2019.
NA = data not available.
Notes: The vacancy rate is as of the current date; home sales and prices are for the 12 months ending September 2020; and months of inventory New home sales represented 27 percent of total
and mortgage delinquency data are as of September 2020. The current date is October 1, 2020.
Sources: CoreLogic, Inc.; Zonda homes sales in the 12 months ending September
Comprehensive Housing Market Analysis Lakeland-Winter Haven, Florida
U.S. Department of Housing and Urban Development, Office of Policy Development and ResearchLakeland-Winter Haven, Florida Comprehensive Housing Market Analysis as of October 1, 2020 Home Sales Market 12
2020—the highest share since 2008. The new Figure 7. 12-Month Sales Totals by Type in the Lakeland-Winter Haven HMA
home share had previously reached a high of
REO Sales New Home Sales Regular Resales
39 percent in 2006. The share has been 25,000
consistently increasing every year from a low
of 11 percent in 2011 as a result of both the 20,000
absorption of surplus housing since the Great
Sales Totals
Recession and the increasing demand for housing 15,000
due to in-migration from the strengthening
economy—prior to the COVID-19 pandemic. 10,000
During the 12 months ending September 2020, 5,000
existing home sales decreased by 610, or 5 percent,
compared with the previous 12 months. Existing 0
home sales peaked at 15,200 homes in 2005 but
6
7
8
9
0
1
2
3
4
5
6
7
8
9
0
-1
-1
-1
-0
-0
-0
-0
-1
-1
-1
-1
-1
-1
-1
-2
pt
pt
pt
pt
pt
pt
pt
pt
pt
pt
pt
pt
pt
pt
pt
declined by an average of 3,250, or 29 percent,
Se
Se
Se
Se
Se
Se
Se
Se
Se
Se
Se
Se
Se
Se
Se
a year to a low of 5,425 homes in 2008, during REO = real estate owned.
the Great Recession. Sales of existing homes Source: Zonda
fluctuated from 2009 through 2011 during the worst
of the housing market crisis and averaged 6,775 During the economic expansion in 2006, the total of 290 REO sales made up 3 percent of existing homes sales
homes sold. Sales began increasing in 2012 as the that year. By 2010, REO sales had increased more than tenfold, to 3,850, or 54 percent of existing home sales.
economy started to recover, averaging increases of During the 12 months ending September 2020, the number of REO sales decreased by 260, or 30 percent,
10 percent, or 880 homes, annually through 2018, to 600 homes, compared with the previous 12 months, and represented 5 percent of existing home sales.
when home sales reached 12,700 before declining
2 percent in 2019 to 12,450. Although existing home New and Existing Home Sales Price Trends
sales decreased by 270 homes, new home sales During the 12 months ending September 2020, the average price of a new home sold was $253,200—
offset the decline with an increase of more than a slight increase of less than 1 percent from the previous 12 months, compared with a 5-percent increase
970 homes. Most new home sales in 2019 were in
a year earlier (Figure 8). The average new home sales price has not recovered to the previous peak of
areas of the HMA that were relatively undeveloped,
$276,400 in 2007, which is $23,200, or 9 percent, higher than the current average price. The average
with fewer existing homes and more available land.
new home sales price increased 15 percent annually from 2006 through 2007 to a peak of $268,300
Real estate owned (REO) sales were a significant before beginning to decline as a result of worsening economic and sales housing market conditions.
portion of existing home sales in the early 2010s, From 2008 through 2011, the average new home sales price decreased by an average of $23,050, or
as the HMA recovered from the housing crisis. 10 percent, annually to a low of $176,100. As economic conditions improved and in-migration increased
Comprehensive Housing Market Analysis Lakeland-Winter Haven, Florida
U.S. Department of Housing and Urban Development, Office of Policy Development and ResearchLakeland-Winter Haven, Florida Comprehensive Housing Market Analysis as of October 1, 2020 Home Sales Market 13
from 2012 through 2019, the average new Figure 8. 12-Month Average Sales Price by Type of Sale in the Lakeland-Winter Haven HMA
home sales price rose to $252,700, an average New Home Sales Regular Resales REO Sales
increase of 5 percent, or $9,575, a year. 300,000
Existing homes, which had greater supply 250,000
Average Sales Price ($)
constraints due to the COVID-19 pandemic, had
a sales price increase of $16,600, or 9 percent, 200,000
to an average of $209,700 during the 12 months
ending September 2020—the same increase 150,000
as during the previous 12 months. Before the
100,000
Great Recession, the average existing home
sales price peaked in 2006, at $194,800, a
50,000
$23,700, or 14-percent, increase from the
6
previous year. Subsequently, the average
7
8
9
0
1
2
3
4
5
6
7
8
9
0
-0
-0
-0
-0
-1
-1
-1
-1
-1
-1
-1
-1
-1
-1
-2
pt
pt
pt
pt
pt
pt
pt
pt
pt
pt
pt
pt
pt
pt
pt
Se
Se
Se
Se
Se
Se
Se
Se
Se
Se
Se
Se
Se
Se
Se
existing home sales price decreased by
$16,650, or 11 percent, annually, to a low of REO = real estate owned.
$111,600 in 2011, due to the housing crisis. In Source: Zonda
the years that followed, the improving economic
conditions and the resulting in-migration led to the national rate reached a high of 8.6 percent in February 2010. Mortgage delinquencies trended
an increase in the average existing home sales downward for much of the 2010s and only recently began to rise as a result of the economic downturn
price of $10,550, or 7 percent, annually, to caused by the COVID-19 pandemic. In August 2020, 5.9 percent of mortgages in the HMA were seriously
$195,800 in 2019. The average existing home delinquent or in REO status—up from 2.1 percent a year earlier. Nationally, the rate increased from
sales price surpassed the peak reached before 1.4 percent in August 2019 to 4.4 percent in August 2020.
the Great Recession in 2019.
Sales Construction Activity
Delinquent Mortgages and Sales construction activity, as measured by the number of sales units permitted—including single-family
REO Properties homes, townhomes, and condominiums—has generally increased in the HMA since 2009 (Figure 9).
The rate of seriously delinquent mortgages During the 12 months ending September 2020, approximately 5,800 sales units were permitted—down
and REO properties in the HMA has generally 5 percent from 6,075 during the previous 12-month period (preliminary data, with adjustments by the
been higher than the national average since analyst). From 2001 through 2006, the number of sales units permitted increased by an average of
2000 (CoreLogic, Inc.). In January 2010, the 710 units, or 14 percent, annually, to 7,800 units in 2006, to meet demand stemming from the surge in
rate of seriously delinquent mortgages and REO in-migration due to economic growth. Demand for new sales housing slowed as a result of the housing
properties in the HMA peaked, at 18.6 percent; crisis and the Great Recession, contributing to a decline in the number of units permitted from 2007
Comprehensive Housing Market Analysis Lakeland-Winter Haven, Florida
U.S. Department of Housing and Urban Development, Office of Policy Development and ResearchLakeland-Winter Haven, Florida Comprehensive Housing Market Analysis as of October 1, 2020 Home Sales Market 14
through 2009 by an average of 2,225, or Figure 9. Average Annual Sales Permitting Activity in the Lakeland-Winter Haven HMA
47 percent, annually to 1,125 units permitted Single-Family Homes/Townhomes Condominiums
in 2009. During 2010 and 2011, the number 14,000
of homes permitted continued to decline but
at a slower pace, decreasing an average of 12,000
30 homes, or 3 percent, annually, to a low of 10,000
1,075 homes in 2011. Increasing population and
8,000
robust economic growth beginning in 2012 led
to renewed confidence in the housing market 6,000
and increased demand for new homes. The
4,000
number of sales units permitted increased by
an average of 670 units, or 25 percent, 2,000
annually from 2012 through 2019, to 6,450 units.
0
Condominiums represented 2 percent of sales
00
01
02
03
04
05
06
07
08
09
10
11
12
13
14
15
16
17
18
19
20
construction activity from 2002 through 2007,
20
20
20
20
20
20
20
20
20
20
20
20
20
20
20
20
20
20
20
20
20
but since 2008, condominiums have accounted Notes: Includes single-family homes, townhomes, and condominiums. Data for 2020 are through September 2020.
for less than 1 percent of home construction. Sources: U.S. Census Bureau, Building Permits Survey; 2000 through 2019—final data and estimates by the analyst; 2020—preliminary data and
estimates by the analyst
Most new subdivisions are in the northern half of
the HMA, near the Interstate 4 corridor and the Forecast
two largest cities of Lakeland and Winter Haven.
During the next 3 years, demand is expected for 8,125 new sales units in the HMA (Table 5). The 2,225
A significant increase in development has been
homes currently under construction are expected to meet part of the demand during the first year. Sales
occurring in the northeast part of the HMA since
demand is expected to remain stable during the forecast period due to stable economic growth. Demand
2017 because of the development of higher
by price range is expected to be similar to the distribution of new home sales during the past 12 months,
density infrastructure to meet the demand for
with most demand falling in the $200,000-to-$249,999 price range (Figure 10).
commuters to the Orlando-Kissimmee-Sanford
MSA and employees at the Walmart e-commerce
fulfillment facility in the city of Davenport. Table 5. Demand for New Sales Units in the Lakeland-Winter Haven HMA During the Forecast Period
Subdivisions underway in the area include the Sales Units
fourth phase of Highland Meadows, totaling Demand 8,125 Units
200 homes. Prices in the community range from Under Construction 2,225 Units
$197,000 for a three-bedroom home to $243,000 Notes: The forecast period is from October 1, 2020, to October 1, 2023. Sales demand includes an estimated demand for 300 mobile homes.
for a five-bedroom home. Source: Estimates by the analyst
Comprehensive Housing Market Analysis Lakeland-Winter Haven, Florida
U.S. Department of Housing and Urban Development, Office of Policy Development and ResearchLakeland-Winter Haven, Florida Comprehensive Housing Market Analysis as of October 1, 2020 Home Sales Market 15
Figure 10. Share of Sales by Price Range During the 12 Months Ending
September 2020 in the Lakeland-Winter Haven HMA
Existing Sales New Sales
50
45
40
35
Share of Sales (%)
30
25
20
15
10
5
0
$0 to $99k $100k to $149k $150k to $199k $200k to $249k $250k to $299k $300k to $399k $400k and More
Note: New and existing sales include single-family homes, townhomes, and condominium units.
Source: Zonda
Comprehensive Housing Market Analysis Lakeland-Winter Haven, Florida
U.S. Department of Housing and Urban Development, Office of Policy Development and ResearchLakeland-Winter Haven, Florida Comprehensive Housing Market Analysis as of October 1, 2020 Rental Market 16
Rental Market and strong renter household growth during
the remainder of the decade. The effects of
Market Conditions: Balanced the countermeasures used to slow the spread
of COVID-19 were mostly mitigated because
More than 68 percent of market-rate rental construction in the HMA since 2016 has been
of eviction protection policies at the state and
concentrated in the northeastern part of the HMA, away from the traditional population centers.
federal levels.
Current Rental Market Conditions and Recent Trends Apartment Market Trends
The rental market in the Lakeland-Winter Haven HMA is currently balanced, with an overall estimated
The average apartment vacancy rate rose from
rental vacancy rate of 7.5 percent—down from 15.8 percent in April 2010 (Table 6). Strong net in-migration,
6.3 percent in the third quarter of 2007 (Reis, Inc.)
relatively slow rental construction activity during and following the Great Recession, and increased renter
to a high of 11.7 percent for the same quarter in
household growth contributed to declining vacancy rates and rising rents during the mid- to late 2010s.
2009 as a result of job losses and the completion
The proportion of renter households in the HMA increased from 29.5 percent in 2010 to an estimated
of a large number of apartment properties
31.1 percent currently because of the large number of foreclosures in the sales market in the early 2010s
(Figure 11). From 2007 through 2009, 2,000
Table 6. Rental Market Quick Facts in the Lakeland-Winter Haven HMA apartment units were completed and added to
the supply. The average monthly rent increased
2010 (%) Current (%)
an average of 2 percent, annually, during the
Rental Vacancy Rate 15.8 7.5
period, to $709. The average vacancy rate fell
Occupied Rental Units by Structure
Rental Market considerably in 2012, to 8.0 percent. As the
Single-Family Attached & Detached 40.0 44.0
Quick Facts economy and the housing market recovered
Multifamily (2–4 Units) 17.0 15.0
Multifamily (5+ Units) 27.0 28.0 and apartment construction stalled, the vacancy
Other (Including Mobile Homes) 16.0 13.0 rate dropped to 2.6 percent in the third quarter
Current YoY Change of 2017, whereas the average rent continued
Apartment Vacancy Rate 4.1 -2.0
to climb an average of 3 percent annually, to
Apartment Average Rent $980 1.5 $888. As new apartments entered the market,
Market Studio $689 6.2 the vacancy rate rose to 4.3 percent in the third
Quick Facts One-Bedroom $838 -0.2 quarter of 2019, with the average rent increasing
Two-Bedroom $1,015 0.2 an average of 4 percent annually from 2017 to
Three-Bedroom $1,319 2.8
2019, to a high of $973. As of the third quarter
YoY = year-over-year. of 2020, apartment market conditions in the
Notes: The current date is October 1, 2020. Percentages may not add to 100 due to rounding.
Sources: 2010 and 2019 American Community Survey, 1-year data; Reis, Inc. HMA were balanced, with a 4.1-percent vacancy
Comprehensive Housing Market Analysis Lakeland-Winter Haven, Florida
U.S. Department of Housing and Urban Development, Office of Policy Development and ResearchLakeland-Winter Haven, Florida Comprehensive Housing Market Analysis as of October 1, 2020 Rental Market 17
rate, compared with 4.3 percent during the third Figure 11. Apartment Rents and Vacancy Rates in the Lakeland-Winter Haven HMA
quarter of 2019. During the same period, the Average Monthly Rent ($) Vacancy Rate (%)
average apartment rent was unchanged, at $973. 1,200 14
As of the third quarter of 2020, the market for 1,000 12
Average Monthly Rent ($)
senior apartments in the HMA was soft, with 10
Vacancy Rate (%)
800
a 14.4-percent vacancy rate, compared with
8
13.5 percent a year earlier. The average rent 600
6
for senior apartments during the third quarter
400
of 2020 was $2,553, representing a 1-percent 4
decrease from a year earlier and an average 200 2
increase of 1 percent annually since the third 0 0
quarter of 2015. Rents for senior housing tend
19
20
12
14
15
16
17
18
07
08
09
10
11
13
to be higher due to the more comprehensive
20
20
20
20
20
20
20
20
20
20
20
20
20
20
3
3
3
3
3
3
3
3
3
3
3
3
3
3
Q
Q
Q
Q
Q
Q
Q
Q
Q
Q
Q
Q
Q
set of amenities provided. In 2019, 18 percent
Q
of households with heads of household aged Q3 = third quarter.
Source: Reis, Inc.
65 or older were renter households, compared
with 14 percent in 2010 (2010 and 2019 ACS
1-year data). September 2020, the average vacancy rate among professionally managed, two-bedroom, single-family
rental homes was 2.4 percent—down from 3.8 percent in 2012. The average rent in September 2020
Single-Family Homes for Rent for a professionally managed, two-bedroom single-family rental home was $1,151—up 4 percent from a
year earlier and an average of 4 percent annually since 2012 (CoreLogic, Inc.). The vacancy rate among
The average vacancy rate for professionally professionally managed, three-bedroom, single-family rental homes was 1.5 percent—unchanged from
managed single-family rental homes was a year earlier and down from 2.3 percent in 2012. The average monthly rent for professionally managed,
2.7 percent in September 2020—down from three-bedroom, single-family rental homes was $1,461—up 8 percent from a year earlier and up from an
4.0 percent in September 2012 (CoreLogic, Inc.), average of 5 percent annually since 2012.
the earliest year for which those data were
collected. Renter households residing in single- Rental Construction Activity
family homes represent a significant portion Since 2000, rental construction activity, as measured by the number of rental housing units permitted,
of all renter households in the HMA. In 2019, has fluctuated, with a limited number of units permitted from 2009 through 2014 (Figure 12). An average
44.0 percent of renter households lived in of 910 rental units were permitted annually from 2000 through 2008. During 2009, no rental housing
single-family homes—up from 40.0 percent permits were issued, as builders responded to job losses and a soft apartment market. From 2010 through
in 2010 (2010 and 2019 ACS 1-year data). In 2014, rental housing construction remained low, averaging 110 units permitted annually. Job losses during
Comprehensive Housing Market Analysis Lakeland-Winter Haven, Florida
U.S. Department of Housing and Urban Development, Office of Policy Development and ResearchLakeland-Winter Haven, Florida Comprehensive Housing Market Analysis as of October 1, 2020 Rental Market 18
2010 and 2011 contributed to relatively low rental Figure 12. Average Annual Rental Permitting Activity in the Lakeland-Winter Haven HMA
housing construction; the number of rental units
3,000
permitted stayed low through 2014 despite a
strengthening economy and rental market, as
2,500
developers were slow to respond to increased
demand. From 2015 through 2018, rental housing 2,000
construction increased, averaging 750 units
permitted annually, and then peaked at 2,675 1,500
units permitted in 2019. Increased demand
stemming from job and population growth 1,000
contributed to increased rental housing permitting
500
during this period. The number of units permitted
increased 8 percent during the 12 months ending
0
September 2020, to nearly 2,100 units, from
00
01
02
03
04
05
06
07
08
09
10
11
12
13
14
15
16
17
18
19
20
a year earlier.
20
20
20
20
20
20
20
20
20
20
20
20
20
20
20
20
20
20
20
20
20
Rental Construction Activity Notes: Includes apartments and units intended for rental occupancy. Data for 2020 are through September 2020.
Sources: U.S. Census Bureau, Building Permits Survey; 2000–2019—final data and estimates by the analyst; 2020—preliminary data and
by Geography estimates by the analyst
Recent apartment construction activity has
been concentrated in the city of Davenport in particularly leisure and hospitality workers who have been priced out of the neighboring market closer to
the northeast portion of the HMA, due to a $300 their workplaces. The city of Davenport has accounted for 38 percent of rental construction since 2016.
million state-of-the-art Walmart Inc. e-commerce
fulfillment center that opened in 2017. The Current Rental Construction Activity
following year, the facility created 1,000 jobs, Approximately 4,075 rental housing units are under construction in the HMA; 1,400 of the units are in
with further room to expand as necessary. Since the city of Davenport, slightly fewer than the much larger city of Lakeland, which has 1,750 units under
the completion of the fulfillment center, the construction. Currently under construction in the city of Davenport is the Thrive by Watermark apartments,
county focused resources on developing the with 328 units, which is scheduled to be completed in March 2021. Rents for one-, two-, and three-
area, such as building new schools. The location bedroom units at the development start at $1,199, $1,460, and $1,799, respectively. In the city of Lakeland,
of the city of Davenport, along the border of the the 305-unit Mirrorton apartments are under construction and scheduled to be completed in April 2021.
Orlando-Kissimmee-Sanford MSA, has attracted Rents at the development for one-, two-, and three-bedroom units are expected to start at $1,050, $1,600,
commuters to the relatively affordable area, and $2,225, respectively.
Comprehensive Housing Market Analysis Lakeland-Winter Haven, Florida
U.S. Department of Housing and Urban Development, Office of Policy Development and ResearchLakeland-Winter Haven, Florida Comprehensive Housing Market Analysis as of October 1, 2020 Rental Market 19
Forecast Table 7. Demand for New Rental Units in the Lakeland-Winter Haven HMA
During the Forecast Period
During the forecast period, apartments in the HMA are expected to remain
Rental Units
more affordable than in the Tampa or Orlando metropolitan areas, and
Demand 3,125 Units
demand is estimated for 3,125 new rental units in the HMA (Table 7). Rental
Under Construction 4,075 Units
demand is expected to increase each year during the forecast period as
Note: The forecast period is October 1, 2020, to October 1, 2023.
economic conditions improve. The 4,075 units under construction are expected Source: Estimates by the analyst
to exceed demand during the forecast period.
Comprehensive Housing Market Analysis Lakeland-Winter Haven, Florida
U.S. Department of Housing and Urban Development, Office of Policy Development and ResearchLakeland-Winter Haven, Florida Comprehensive Housing Market Analysis as of October 1, 2020 Terminology Definitions and Notes 20
Terminology Definitions and Notes
A. Definitions
Building permits do not necessarily reflect all residential building activity that occurs in an HMA. Some units are constructed or created without a building
permit or are issued a different type of building permit. For example, some units classified as commercial structures are not reflected in the residential building
Building Permits
permits. As a result, the analyst, through diligent fieldwork, makes an estimate of this additional construction activity. Some of these estimates are included in
the discussions of single-family and multifamily building permits
The demand estimates in the analysis are not a forecast of building activity. They are the estimates of the total housing production needed to achieve a
Demand balanced market at the end of the 3-year forecast period given conditions on the as-of date of the analysis, growth, losses, and excess vacancies. The
estimates do not account for units currently under construction or units in the development pipeline.
Forecast Period 10/1/2020–10/1/2023—Estimates by the analyst.
Home Sales/
Home Sales Includes single-family home, townhome, and condominium sales.
Prices
In this analysis conducted by the U.S. Department of Housing and Urban Development (HUD), other vacant units include all vacant units that are not available
Other Vacant
for sale or for rent. The term therefore includes units rented or sold but not occupied; held for seasonal, recreational, or occasional use; used by migrant
Units
workers; and the category specified as “other” vacant by the Census Bureau.
Rental Market/
Rental Vacancy Includes apartments and other rental units, such as single-family, multifamily, and mobile homes.
Rate
Comprehensive Housing Market Analysis Lakeland-Winter Haven, Florida
U.S. Department of Housing and Urban Development, Office of Policy Development and ResearchLakeland-Winter Haven, Florida Comprehensive Housing Market Analysis as of October 1, 2020 Terminology Definitions and Notes 21
Seriously
Delinquent Mortgages 90+ days delinquent or in foreclosure.
Mortgages
B. Notes on Geography
The metropolitan statistical area definition noted in this report is based on the delineations established by the Office of Management and Budget (OMB) in the
1.
OMB Bulletin dated April 10, 2018.
C. Additional Notes
This analysis has been prepared for the assistance and guidance of HUD in its operations. The factual information, findings, and conclusions may also be
1. useful to builders, mortgagees, and others concerned with local housing market conditions and trends. The analysis does not purport to make determinations
regarding the acceptability of any mortgage insurance proposals that may be under consideration by the Department.
The factual framework for this analysis follows the guidelines and methods developed by the Economic and Market Analysis Division within HUD. The analysis
and findings are as thorough and current as possible based on information available on the as-of date from local and national sources. As such, findings or
2.
conclusions may be modified by subsequent developments. HUD expresses its appreciation to those industry sources and state and local government officials
who provided data and information on local economic and housing market conditions.
D. Photo/Map Credits
Cover Photo iStock
Contact Information
Maciej Misztal, Economist
Atlanta HUD Regional Office
678–732–2660
maciej.d.misztal@hud.gov
Comprehensive Housing Market Analysis Lakeland-Winter Haven, Florida
U.S. Department of Housing and Urban Development, Office of Policy Development and ResearchYou can also read