Fiscal 2022 Three-Month Period Ended June 30, 2021 Earnings Announcement - UNITED ARROWS LTD.

Page created by Richard Simpson
 
CONTINUE READING
Fiscal 2022 Three-Month Period Ended June 30, 2021 Earnings Announcement - UNITED ARROWS LTD.
Fiscal 2022
  Three-Month Period
 Ended June 30, 2021
Earnings Announcement

          August 6, 2021

      UNITED ARROWS LTD.

                           1
Fiscal 2022 Three-Month Period Ended June 30, 2021 Earnings Announcement - UNITED ARROWS LTD.
 Contents

 I.       Overview of Business Results for the Three-Month Period
          Ended June 30, 2021                         PP. 3–14
 II. Current Situation and Future Action                                                                                 PP. 15–20
 III. Message from Matsuzaki
      Representative Director, President and CEO                                                                         PP. 21–23
 IV. Reference Materials                                                                                                 PP. 24–40
                                                               Cautionary Statement
 Descriptions for earnings forecasts and descriptions other than objective facts in this document are based on decisions made by UNITED
 ARROWS LTD. in light of information obtainable as of the date of this report and, therefore, include risks and uncertainties. Actual earnings may
 differ materially from forecasts due to global economic trends, market conditions and other factors. Investors are asked to refrain from making
 investment decisions based solely on the information contained in this document.

 (1) Abbreviations used throughout this report: The following abbreviations may be used for each Group business, store brand, and
 consolidated subsidiary and affiliated company.
 UA = UNITED ARROWS; BY = BEAUTY&YOUTH UNITED ARROWS; monkey time = monkey time BEAUTY&YOUTH UNITED ARROWS; District =
 District UNITED ARROWS; GLR = UNITED ARROWS green label relaxing; Lurow GLR = Lurow GREEN LABEL RELAXING; THE STATION STORE = THE
 STATION STORE UNITED ARROWS LTD.; CHJP = CHROME HEARTS JP, GK; CH = CHROME HEARTS
 (2) The store brands contained within Trend-conscious Market and Basic Trend-conscious Market are as follows.
 Trend-conscious Market: UA, District, ASTRAET, BY, monkey time, STEVEN ALAN, ROKU, H BEAUTY&YOUTH, Odette e Odile, DRAWER, BLAMINK,
 AEWEN MATOPH, and LOEFF
 Basic Trend-conscious Market: GLR, Lurow GLR, THE STATION STORE

 Note: In this earnings announcement, fractional sums of less than one million yen are rounded down and percentages are calculated from
       raw data.                                                                                                                                     2
Fiscal 2022 Three-Month Period Ended June 30, 2021 Earnings Announcement - UNITED ARROWS LTD.
I. Overview of Business Results
   for the Three-Month Period
   Ended June 30, 2021

                                  3
Fiscal 2022 Three-Month Period Ended June 30, 2021 Earnings Announcement - UNITED ARROWS LTD.
 Performance Summary for the Three-Month Period FY2022

Consolidated P/L (for details, see slides 5-8)
 Sales:                 ¥25,264 million, YoY increase of 13.8%, decrease of 32.6% over the same period of FY20.
                        Excluding the impact of changes in the consolidation structure and revenue recognition
                        standards, sales increased 25.4% YoY and decreased 24.0% over the same period of
                        FY20
 Gross margin:          51.5%, up 8.0 percentage points YoY, down 3.3 percentage points over the same period
                        of FY20
 SGA Expenses:          ¥13,902 million, YoY decrease of 5.1%, decrease of 20.1% over the same period of FY20.
                        Even if the impact of the change in revenue recognition standards is excluded, SGA
                        expenses were kept at the 80% level of the same period of FY20
 Operating loss:        ¥903 million, operating loss decreased significantly from ¥5,019 million in the same period
                        of FY21
Non-Consolidated Sales (for details, see slides 9–10)
 Non-Consolidated Sales: ¥22,919 million, YoY increase of 21.5%, decrease of 27.1% over the same period of FY20.
                         Excluding the impact of changes in revenue recognition standards, non-consolidated sales
                         increased 25.0% YoY and decreased 25.0% over the same period of FY20
 Online Sales:           ¥6,808 million, composition rate : 29.7% (significantly up from 20.8% in the same period
                         of FY20)
Inventory (for details, see slide 11)
 Inventory:             YoY decrease of 33.7%,
                        28.2% decrease even if the impact of the change in consolidation structure is excluded
Opening and Closing of Stores (for details, see slide 13)
 1Q Results:            Group total number of new stores opened: 3; number of stores as of the end of 1Q: 333;
                        expected number of stores at the end of the fiscal 22: 316
Group companies (for details, see slide 14)
 COEN CO., LTD. and UNITED ARROWS TAIWAN LTD.: Increased in both revenue and income
                                                                                                                      4
Fiscal 2022 Three-Month Period Ended June 30, 2021 Earnings Announcement - UNITED ARROWS LTD.
 Consolidated P/L Overview

Sales were below target but SGA expenses were curbed, and operating
loss, ordinary loss, and net loss were less than expected
                                                                                                                                                          (Millions of yen)

                                                              1Q FY20              1Q FY21             1Q FY22
                                                             (Apr. 2019 to       (Apr. 2020 to        (Apr. 2021 to
                                                              Jun. 2019)          Jun. 2020)           Jun. 2021)            vs. 1Q FY20               vs. 1Q FY21

  Sales                                                           37,505              22,198              25,264          (12,241)       67.4%       3,065       113.8%
    Excluding the impact of change in the consolidation
    structure*                                                            -                   -                   -             -        74.0%            -      122.1%
    Excluding the impact of change in revenue recognition
    standards                                                             -                   -                   -             -        69.2%            -      116.9%
    Excluding the impact of both changes                               -                    -                  -                -        76.0%            -      125.4%
  Gross Profit                                                    20,532                9,637             12,998           (7,533)       63.3%       3,361       134.9%
                                              vs. Sales               54.7%                43.4%               51.5%        -3.3pt           -         8.0pt            -
  SGA Expenses                                                    17,389              14,656              13,902           (3,486)       79.9%         (753)       94.9%
                                              vs. Sales               46.4%                66.0%               55.0%         8.7pt           -       -11.0pt            -
  Operating Income                                                  3,143              (5,019)                (903)        (4,047)           -       4,115         18.0%
                                              vs. Sales                 8.4%                     -                    -         -            -            -             -
     Non Op. P/L                                                       (24)                  78                185            209            -         106       235.0%
                                              vs. Sales                      -              0.4%                0.7%            -            -         0.4pt            -

  Ordinary Income                                                   3,118              (4,940)                (718)        (3,837)           -       4,221         14.5%
                                              vs. Sales                 8.3%                     -                    -         -            -            -             -

     Extraordinary income (loss)                                       (31)                  (9)                (47)          (15)           -          (37)     490.1%
                                              vs. Sales                      -                   -                    -         -            -            -             -
  Net Income Attributable to Owners of Parent                       1,914              (3,582)                (648)        (2,562)           -       2,934         18.1%
                                              vs. Sales                 5.1%                     -                    -         -            -            -             -

   * Calculated from the total sales of UA LTD., COEN CO., LTD., and UNITED ARROWS TAIWAN LTD. Actual consolidated sales include inter-subsidiary transactions, so please
     refer to them as reference values.                                                                                                                                       5
Fiscal 2022 Three-Month Period Ended June 30, 2021 Earnings Announcement - UNITED ARROWS LTD.
 Factors behind changes in consolidated gross margin

 Although promoting the consumption of products for spring and
 summer of last year at outlets has significant impacts, the negative
 impact is expected to diminish in fall and winter

                                                          Gross Margin
                                                            1Q FY22
                                                                             vs. 1Q FY20     vs. 1Q FY21

 Consolidated                                                    51.5%              -3.3pt          8.0pt

 UNITED ARROWS LTD.                                              50.9%              -3.5pt          9.3pt

   Total Business Unit Sales                                             -          -2.3pt          8.6pt

   Outlet, etc.                                                          -          -5.5pt          -3.1pt

   Items exclusively sold at outlets, Composition ratio                  -          -7.6pt          -6.8pt

 COEN CO., LTD.                                                          -          -0.5pt          4.1pt

 UNITED ARROWS TAIWAN LTD.                                               -          5.3pt           6.0pt

                                                                                                             6
 Consolidated SGA Expenses

    The ratio of SGA expenses is at a high level due to the delay in sales
    recovery, but the control of SGA expenses continues

                                                                                                                                                                         (Millions of yen)

                                                     1Q FY20                     1Q FY21                     1Q FY22
                                                   (Apr. 2019 to                (Apr. 2020 to               (Apr. 2021 to
                                                    Jun. 2019)                   Jun. 2020)                  Jun. 2021)                   vs. 1Q FY20                vs. 1Q FY21

Sales                                                        37,505                      22,198                       25,264             (12,241)       67.4%         3,065        113.8%

Total SGA Expenses                                          17,389                      14,656                       13,902                (3,486)      79.9%          (753)       94.9%
                                vs. Sales                          46.4%                        66.0%                       55.0%            8.7pt            -      -11.0pt             -

   Advertising Expenses                                            869                          836                         499              (369)      57.5%          (336)       59.7%
                                vs. Sales                          2.3%                         3.8%                        2.0%            -0.3pt            -        -1.8pt            -

   Personnel Expenses                                         6,345                       6,090                        5,347                 (998)      84.3%          (742)       87.8%
                                vs. Sales                          16.9%                        27.4%                       21.2%            4.2pt            -        -6.3pt            -

   Rent                                                       5,335                       4,087                        4,422                 (912)      82.9%           334        108.2%
                                vs. Sales                          14.2%                        18.4%                       17.5%            3.3pt            -        -0.9pt

   Depreciation                                                    485                          429                         295              (189)      61.0%          (133)       68.9%
                                vs. Sales                          1.3%                         1.9%                        1.2%            -0.1pt            -        -0.8pt            -

   Other                                                      4,352                       3,212                        3,336               (1,016)      76.6%            124       103.9%
                                vs. Sales                          11.6%                        14.5%                       13.2%            1.6pt            -        -1.3pt            -

    * Note: Details pertaining to consolidated SGA expenses to sales ratio by major expenditure item on a 1H, 2H, and full-year basis in the past two fiscal years
      are included in the attachment at the end of this document.
                                                                                                                                                                                             7
 Impact of change in revenue recognition standards

Even if the impact of the change in revenue recognition standard is excluded,
SGA expenses were kept at the 80% level of the same period of FY20
                                                                                                                                        (Millions of yen)

                                                     1Q FY20             1Q FY21             1Q FY22
                                                    (Apr. 2019 to       (Apr. 2020 to       (Apr. 2021 to
                                                     Jun. 2019)          Jun. 2020)          Jun. 2021)           vs. 1Q FY20        vs. 1Q FY21

 Sales                                                    37,505              22,198              25,264       (12,241)     67.4%   3,065      113.8%
   Excluding the impact of change in revenue
   recognition standards                                            -                   -         25,961       (11,544)     69.2%   3,762      116.9%

 Gross Profit                                             20,532               9,637              12,998        (7,533)     63.3%   3,361      134.9%
                                     vs. Sales               54.7%               43.4%               51.5%       -3.3pt         -     8.0pt             -
   Excluding the impact of change in revenue
   recognition standards                                            -                   -         13,384        (7,147)     65.2%   3,747      138.9%

                                     vs. Sales                      -                   -            51.6%       -3.2pt         -     8.1pt             -
 Total SGA Expenses                                      17,389              14,656              13,902         (3,486)     79.9%    (753)       94.9%
                                     vs. Sales               46.4%               66.0%               55.0%        8.7pt         -   -11.0pt             -
   Excluding the impact of change in revenue
   recognition standards                                            -                   -        14,288         (3,100)     82.2%    (367)       97.5%

                                     vs. Sales                      -                   -            55.0%        8.7pt         -   -11.0pt             -
      Advertising Expenses                                   869                 836                 499          (369)     57.5%    (336)       59.7%
                                     vs. Sales                2.3%                3.8%                2.0%       -0.3pt         -    -1.8pt
         Excluding the impact of change in
         revenue recognition standards                              -                   -            885            16     101.9%      49      106.0%

                                     vs. Sales                      -                   -             3.4%        1.1pt         -    -0.4pt             -

* Advertising expenses for 1Q FY22 includes the impact of UA LTD.'s Rakuten Points program, which began in October 2020.
                                                                                                                                                            8
 Non-Consolidated Sales Results by Sales Channel

                                                                                                                                                                 (Millions of yen)

                                                  1Q FY20                 1Q FY21                 1Q FY22
                                                 (Apr. 2019 to           (Apr. 2020 to           (Apr. 2021 to
                                                  Jun. 2019)              Jun. 2020)              Jun. 2021)                vs. 1Q FY20                    vs. 1Q FY21

  Non-Consolidated Sales                               31,427                  18,858                  22,919             (8,508)          72.9%          4,060         121.5%
  Excluding the impact of change in
                                                                  -                       -                       -               -        75.0%                 -      125.0%
  revenue recognition standards
     Total Business Unit Sales                         26,809                  16,641                  19,019             (7,789)          70.9%          2,377         114.3%
                                vs. Sales                   85.3%                   88.2%                   83.0%           -2.3pt              -          -5.3pt             -
       Retail                                          20,109                    7,347                 11,958             (8,150)          59.5%          4,611         162.8%
                                vs. Sales                   64.0%                   39.0%                   52.2%         -11.8pt                -        13.2pt                 -
       Online                                            6,526                   9,148                   6,808               282         104.3%          (2,340)          74.4%
                                vs. Sales                   20.8%                   48.5%                   29.7%            8.9pt               -        -18.8pt                -
       Other (wholesale, etc.)                              173                     146                     252                78        145.3%             106         172.7%
                                vs. Sales                    0.6%                    0.8%                    1.1%            0.5pt               -          0.3pt                -
     Outlet, etc.                                        4,618                   2,216                   4,053              (564)          87.8%          1,836         182.9%
                                vs. Sales                   14.7%                   11.8%                   17.7%            3.0pt               -          5.9pt                -

                                                                   Existing Store Sales YoY
                                                                            Number of                Ave. spend per
                                                    Sales
                                                                            customers                  customer
  Retail + Online                                         113.3%                         97.1%                   121.6%
  Retail                                                  162.0%                     139.5%                      116.1%
  Online                                                    75.6%                        68.7%                   108.5%

      * Data on number of customers and average spend per customer for existing retail and online stores as well as for other online stores are calculated using data
        available to the Company through its own online stores and ZOZOTOWN stores. These data are for reference only.

                                                                                                                                                                                     9
 Non-Consolidated Sales Results by Business

                                                                                                                                                         (Millions of yen)

                                                        1Q FY20                   1Q FY21                1Q FY22
                                                       (Apr. 2019 to             (Apr. 2020 to          (Apr. 2021 to
                                                        Jun. 2019)                Jun. 2020)             Jun. 2021)            vs. 1Q FY20           vs. 1Q FY21

Total Business Unit Sales                                     26,809                    16,641                19,019          (7,789)        70.9%   2,377      114.3%
  Excluding the impact of change in revenue
  recognition standards                                                  -                          -                   -           -        72.8%       -      117.3%

  Trend-conscious Market                                      17,281                    11,247                12,412          (4,868)        71.8%   1,165      110.4%
     Excluding the impact of change in
     revenue recognition standards                                       -                          -                   -           -        74.1%       -      113.9%

  Basic Trend-conscious Market                                  9,527                       5,394              6,606          (2,920)        69.3%   1,212      122.5%
     Excluding the impact of change in
     revenue recognition standards                                        -                         -                   -           -        70.4%       -      124.4%

                                                                              Existing store sales YoY

                                                       Retail + Online                      Retail                  Online

  Trend-conscious Market                                            108.6%                       160.7%                     69.2%
  Basic Trend-conscious Market                                      123.6%                       164.6%                     89.8%

 * Please refer to slide 2 for a list of the store brands included in each business unit.
                                                                                                                                                                             10
 Consolidated B/S Overview

 Even if the impact of the change in consolidation structure is excluded,
 inventory decreased 28.2% YoY
                                                                                                            (Millions of yen)

                                                             FY21-End           FY22 1Q-End
                                                          As of Mar. 31, 2021   As of Jun. 30, 2021
                                                                                                        vs. FY21-End
             Total Assets                                       63,619                 62,209          (1,410)       97.8%
                                      Composition ratio             100.0%                100.0%             -              -
             Current Assets                                     39,745                 38,556          (1,189)       97.0%
                                      Composition ratio               62.5%                 62.0%                           -
             Noncurrent Assets                                  23,874                 23,653           (221)        99.1%
                                      Composition ratio               37.5%                 38.0%                           -
             Current Liabilities                                29,564                 28,787           (777)        97.4%
                                      Composition ratio               46.5%                 46.3%                           -
             Noncurrent Liabilities                                4,210                 4,270            59       101.4%
                                      Composition ratio                6.6%                  6.9%                           -
             Total Net Assets                                   29,844                 29,151           (692)        97.7%
                                      Composition ratio               46.9%                 46.9%                           -
             Reference: Balance of short- and
             long-term loans payable
                                                                15,600                 15,470           (130)        99.2%

                                      Composition ratio               24.5%                 24.9%                           -

                                                                                                            (Millions of yen)

                                                          FY21 1Q-End           FY22 1Q-End
                                                          As of Jun. 30, 2020   As of Jun. 30, 2021
                                                                                                       vs. FY21 1Q-End
             Reference: Inventory                               31,212                 20,686         (10,526)       66.3%
                                                                                                                                11
 Consolidated C/F Overview

   Net cash flows from operating activities were negative, though this
   improved substantially from 1Q FY21

                                                                                                                   (Millions of yen)

                                            1Q FY21         1Q FY22                    Major components of results
                                           (Apr. 2020 to   (Apr. 2021 to
                                                                                               for 1Q FY22
                                            Jun. 2020)      Jun. 2021)

    Cash flows from operating activities
    (sub-total)
                                              (11,280)             (245)

                                                                           Depreciation                                        296
                                                                           Decrease in trade receivables                       878
    Cash flows from operating activities      (11,378)             (312)   Loss before income taxes                           -766
                                                                           Increase in Inventory                              -771

                                                                           Purchases of property, plant and equipment          -88
    Cash flows from investing activities        (1,470)            (371)   Performance of asset retirement obligations         -72
                                                                           Purchases of Intangible noncurrent assets          -340

    Cash flows from financing activities       12,527              (130)   Decrease in short-term loans payable               -130

    Cash and cash equivalents at the end
    of the period
                                                 5,413           5,745

                                                                                                                                       12
 Opening and Closing of Stores in 1Q (Group Total)

The number of stores at the end of FY22 is expected to decrease by 14
from the end of FY21 due to careful selection of store openings and review
of unprofitable stores

                                                                                      FY22

                                                       1Q Results                                         FY22 Forecasts
                       No. of stores as                                 No. of stores as                                    No. of stores as
                        of FY21-end       Opened         Closed            of 1Q-end         Opened           Closed         of FY22-end

Group Total                       330              3                0              333                5                19              316
  UNITED ARROWS LTD.              236              1                0              237                3                17              222

  COEN CO., LTD.                    87             2                0                89               2                 2                87
  UNITED ARROWS
  TAIWAN LTD.
                                      7            0                0                  7              0                 0                  7

                                                                                                                                               13
 Progress at Group Companies

 COEN CO., LTD. (February–April)
 Increased in both revenue and income
 • Sales: ¥2.2 billion, up 23.5% YoY, down 18.6% over 1Q FY20 (excluding changes in revenue recognition standards: up
   25.5% YoY, down 17.3% over 1Q FY20)
 • Revenue and income increased as a rebound from the results of the previous year, but recovery remains slow
 • Despite measures such as controlling inventory procurement and offering reductions, a gap with market needs occurred
 • From Fall/Winter 2021, price will be set more carefully and adapted to the market
 • The new target setting (revised from junior baby boomers to people in their 20s to 30s) implemented in the spring and
   summer of 2021 will continue in the fall and winter

 UNITED ARROWS TAIWAN LTD. (February–April)
 Increased in both revenue and income
 • Sales: ¥0.25 billion, up 69.8% YoY, up 38.1% over 1Q FY20
 • Despite a strong performance in the 1Q, the current situation is challenging due to the COVID-19 pandemic in Taiwan

                                                                                                                           14
II. Current Situation and
    Future Action

                            15
 Current Situation: change over the same period of FY20 by channel

  Although retail sales in May fell sharply due to the extension of the state of
  emergency and the expansion of the coverage area, they are gradually recovering

120%

                                        109.8%                                                                        110.4%
                                                                                                                          Online
                                                                                         103.9%

            98.6%
100%

                                                                                                                      87.3%
                                                                                                                          Total for the
                                                                                                                          entire company
                                                                                         78.5%
 80%
            74.8%                                                                                                     74.8%
                                                                                                                          Retail
                                                                                         67.3%
                                         65.6%
            62.7%

 60%

                                         48.3%

 40%                     After the declaration on April 25, we
                          temporarily closed up to 97 stores

                                                       After May 12, more stores reopened, but business hours were
                                                     shortened and some stores were closed on Saturdays and Sundays

 20%
            April                         May                                             June                         July

                                      Total for the entire company           Retail         Online

                                Change in sales at entire UA LTD., retail, and online
                                     compared with the same period of FY20
                                            (Figures for July are preliminary figures)
                                                                                                                                           16
 Current Situation: change over the same period of FY20 by region

  In the Kanto region (outside Tokyo), where a state of emergency was
  not declared, the level remained at 80% of the same period of FY20.
  The negative margin is limited unless retail stores are closed

                Hokkaido/Tohoku                                                Kanto (Outside Tokyo)                                                Tokyo

 100%                                                      100%                                                            100%
                                         82.2%                        80.9%         78.3%                81.4%
                                                                                               76.7%
 80%                                                        80%                                                             80%
                             68.1%                                                                                                                          63.1%     66.6%
        61.4%                                                                                                                        56.9%
 60%              50.9%                                     60%                                                             60%
                                                                                                                                                 42.1%
 40%                                                        40%                                                             40%

 20%                                                        20%                                                             20%

  0%                                                          0%                                                             0%
        April      May        June        July                        April          May       June       July                        April       May        June      July
          May 16 to June 21: Hokkaido                               A state of emergency was not declared                                       April 25 to June 21
                                                                                                                                               July 12 to August 31

           Koshinetsu/Hokuriku/Tokai                                                  Kansai                                              Chugoku/Shikoku/Kyushu

 100%                                                      100%                                                            100%                                       89.3%
                                         83.2%
 80%                                                        80%                                          73.1%              80%      73.7%                  71.4%
        68.3%                68.2%                                                             64.6%
                  61.2%
                                                                                                                                                 56.9%
 60%                                                        60%       48.9%                                                 60%

 40%                                                        40%                                                             40%

                                                            20%                     15.6%                                   20%
 20%

  0%                                                          0%                                                             0%
        April      May        June        July                         April         May       June       July                        April      May        June       July
            May 12 to June 21: Aichi                               April 25 to June 21: Kyoto, Osaka, Hyogo                            May 12 to June 21: Fukuoka
                                                                                                                                       May 16 to June 21: Okayama, Hiroshima

                                        Change in UA LTD.’s sales by region compared with the same period of FY20
                       (Figures for July are preliminary figures, and below the graph is the time when the state of emergency was declared in each area)
                                                                                                                                                                               17
 Current Measures and Future Policies

 1. Measures from April to the present
    • Flexible distribution of salespersons
      Supporting sales activities by flexibly assigning sales staff of temporarily closed stores to operating
      stores and headquarters offices

    • Expanding contact points through online means
      Active holding of live streaming, increased posting of staff styling, expansion of LINE customer
      service

    • Increasing online sales products
      Attracting customers to retail stores in major cities is expected to be difficult due to the
      declaration of the sate of emergency. Focusing sale inventory on online sales

 2. Future Policies
    • Increasing inventory for fall and winter
      Aiming to recover from the second half of FY22, increasing inventory of products for fall and
      winter to 113% of FY21 and 90% of FY20

    • Curbing discount sales at online
      Curbing discount sales at online in parallel with inventory control

    • Expanding new actions
      Launching new actions including outdoor and wellness to increase UA brand presence
                                                                                                                18
 New action (1)

    We will propose affluent lifestyles for a new era and continue to set a
    standard for lifestyle culture

      Our first outdoor label                       A new brand that enriches our                     Establishment of contact points
                                                           new daily lives                                for corporate customers
Our first outdoor label "koti BEAUTY &          "CITEN" is a new brand which will debut in fall and   A consulting service for corporate
YOUTH," which launched in April, offers a       winter in 2021, and sell products mainly online.      customers that makes use of aesthetic,
one-stop selection of gear and wear. Offering   With the participation of external creators, CITEN    planning, and creativity cultivated in
camping equipment and other outdoor             develops highly empathetic that reflect customer      select shops. "PRODUCE," "UNIFORM,"
supplies, the label aims to propose new         needs to enrich customers' new daily lives.           and "NOVELTY" are the core of the
values and expand its customer base.                                                                  services.

                                                                                                                                               19
 New action (2)

 We will propose affluent lifestyles for a new era and continue to set a
 standard for lifestyle culture

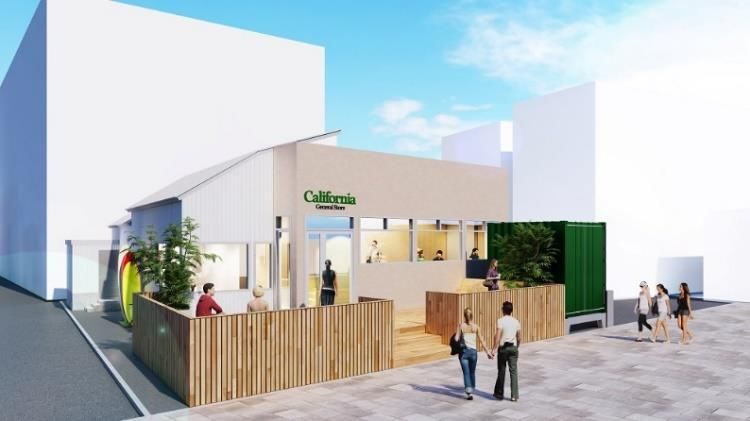
           Communicating wellness and                                Starting the sale of selected
                sustainability                                                  alcohol
     We inherited the trademark of the legendary surf shop    From August, we open the "UNITED ARROWS BOTTLE
     "California General Store." In September, a new store    SHOP" corner at H BEAUTY & YOUTH in United Arrows
     will open in Kugenuma Beach, Fujisawa City, Kanagawa     Harajuku main store and start selling alcohol selected
     Prefecture in Japan. We propose a lifestyle for a new    from Japan and overseas. Propose a rich lifestyle with
     era as a base for providing information on "wellness"    alcohol through regular collaboration projects.
     and "sustainable" including not only surfing, but also
     yoga and activity casual.

                                                                                                                       20
III. Message from Matsuzaki,
Representative Director,
President and CEO

                               21
 What values should the UA LTD. Group provide?

 With sincerity and a sense of beauty, we continually create new
 tomorrows for our customers, setting the standard for lifestyle culture

 Past –    ☞ Expanding opportunities to     Present –
 Present     provide values by increasing
                                            Future    ☞ Increase the value of the
             store brands and broadening                corporate brand itself
             the range of stores

                                                                                    22
 Source of Corporate Brand Value

Keeping these three elements in step with the times and providing things
that are half a step ahead of customers' expectations

 Service Products
☞ High level of
  customer
  service
                   ☞ Selection of
                     products                     Service Products
                                              ☞ CRM                          ☞ SCM
                                                Understanding each             Satisfy customer needs
            Places                  DX
                                                customer and building          with appropriate
                                                deeper relationships of        inventory management
                                utilization     trust with customers
         ☞ Aesthetic sales
           environment

                                                                  Places
                                                             ☞ OMO
                                                               Realization of a world view
                                                               that attracts customers
                                                               and high convenience
                                                               through the release of our
                                                               new EC site

                                                                                                        23
IV. Reference Materials

                          24
 Consolidated P/L Plan for FY22

 Dividend payout ratio is set at 31% provisionally, and the resumption of
 dividends is scheduled to take place at ¥19 annually, aiming to return to
 profitability on a full-fiscal-year basis
                                                                                                                                                               (Millions of yen)

                                              FY20 Full Fiscal   FY21 Full Fiscal
                                                                                     FY22 Plan
                                                   Year               Year                                   vs. 1Q FY20                            vs. 1Q FY21
                                                                                    (Apr. 2021 to
                                               (Apr. 2019 to      (Apr. 2020 to                                   (Ref erence) Excluding the            (Ref erence) Excluding the
                                                                                     Mar. 2022)
                                                Mar. 2020)         Mar. 2021)                                     impact of change in the               impact of change in the
                                                                                                                  consolidation structure               consolidation structure

Sales                                              157,412            121,712           124,800          79.3% Approximately 86%               102.5% Approximately 110%

Gross Profit                                          79,983             55,020           63,300         79.1%                                 115.0%
                                 vs. Sales               50.8%              45.2%            50.7%           -                                     -
SGA Expenses                                         71,224             61,634           60,300          84.7%                                  97.8%
                                 vs. Sales               45.2%              50.6%            48.3%           -                                     -
Operating Income                                      8,758             (6,613)            3,000         34.3%                                     -
                                 vs. Sales                5.6%                  -              2.4%          -                                     -
   Non Op. P/L                                             44            1,735               580        1294.5%                                 33.4%
                                 vs. Sales                0.0%               1.4%              0.5%          -                                     -
Ordinary Income                                       8,803             (4,878)            3,580         40.7%                                     -
                                 vs. Sales                5.6%                  -              2.9%          -                                     -
   Extraordinary income (loss)                       (2,582)            (2,641)           (1,120)            -                                     -
                                 vs. Sales                   -                  -                   -        -                                     -
Net Income Attributable to Owners of Parent           3,522             (7,197)            1,750         49.7%                                     -
                                 vs. Sales                2.2%                  -              1.4%          -                                     -

                                                                                                                                                                                     25
 FY22 Group Management Policy

  Medium-Term Management Plan for FY21 through FY23
   Basic Policy: “Weather the crisis and regain our earnings power”
   1. Drastically review the revenue structure
   2. Regain earnings power

  FY22 Group Management Policy
 Major reforms toward sustainable growth and future
        For customer satisfaction in a new era
 • Required achievement of the operating income and productivity
   plan (operating income plan per person)
 • Required achievement of 50.7% of the consolidated gross margin
   plan
 • Implementation of base strategies that support sustainable growth
   (sustainability, DX)

                                                                       26
 FY22 Group Management Policy

 Major reforms toward sustainable growth and future
        For customer satisfaction in a new era
 • Required achievement of the operating income and productivity plan
   (operating income plan per person)
  1. Assessment of underperforming businesses, stores, labels and subsidiaries, and redrafting of the
     growth strategy
  2. Continued structural reforms toward increased efficiency of the headquarters organization and
     personnel expenses
  3. Implementation of measures toward improved productivity of stores

 • Required achievement of 50.7% of the consolidated gross margin
  1. Thorough improvement of inventory efficiency through product reforms of the main labels
  2. Expansion of sales measures through OMO promotion and digital marketing
  3. Increase in online sales accompanied by profitability improvement

 • Base strategies that support sustainable growth
  1. Realization of the customer-first concept by promoting digital transformation
  2. Promotion of sustainability corresponding to the market characteristics

                                                                                                        27
New Medium-Term
Management Plan
From FY2021 to FY2023

                        28
 Changes in the market environment due to the COVID-19
  pandemic

       The market environment has significantly changed against a
   background of changes in society caused by the COVID-19 pandemic

                 Behavior to avoid                                                   Suppressing
Changes in        closed spaces,                               Expansion of       consumption due to
               crowded places, and
                                       Avoiding going out
society                                                        remote work         anxiety for lower
              close-contact settings                                                    income

Changes in                                                                           Suppressing
               Decrease in the                                Accelerating the
                                         Shorter time in                          consumption due to
the retail     number of store
                                       stores than before
                                                               shift to online
                                                                                   anxiety for lower
industry           visitors                                  shopping/services
                                                                                        income

Changes in    Delayed recovery in
                                        Accelerating the    Decline in customer
                  commercial                                                      Decline in demand
the apparel    facilities in large
                                         shift to online     needs for favorite
                                                                                  for formal clothes
industry                               shopping/services          products
                       cities

                                                                                                       29
 Issues the Company must deal with amid the COVID-19
  pandemic

  Delayed recovery in       • Delayed recovery in sales of stores located in commercial facilities in large cities
 commercial facilities in     compared to those in the suburbs of regional cities
      large cities          • Decline in the advantage of locations, i.e., convenience and ability to attract customers

                            • Surge in online sales, which cannot offset a decline in sales of physical stores
  Further strengthening
                            • Need to strengthen the ability to attract customers by utilizing contactless
       online sales
                              communication via the Internet

     Acceleration of        • Need to promptly adjust merchandise to deal with rapid casualization of business wear
     casualization of
                            • Development of a business style suitable for the new normal in the age of COVID-19
      business wear

                            • Decrease in product unit prices due to a lower composition ratio of heavy clothing such
  Decline in product          as suits and jackets
     unit prices            • Decline in customers’ desire to buy their favorite products due to anxiety for lower
                              income
                            • Increase in remaining stock of 2020 spring and summer season products due to the
                              closure of physical stores
 Inventory efficiency       • Negative effects on the gross margin due to an increase in markdown sales stemming
                              from factors described above

  Problem regarding         • Need to establish a cost structure that can withstand a sales decline
    cost structure          • Need to implement drastic reform by being free from existing perspectives

                                                                                                                          30
 The Company’s Strengths to Survive the COVID-19
  Pandemic

            Possible to solve problems by utilizing the Company’s
                                  strengths
1. Strong trust-based relationships                 2. Ability to address the evolving                    3. High composition ratio of online
    with customers                                      needs of customers                                    sales
• Strong capability of physical stores to deal      • Ability to analyze trends by grasping social        • Percentage of online sales on a non-
  with customers and sell products                    trends                                                consolidated basis
• Sales representatives’ problem-solving            • Ability to address the evolving needs of              FY2020: 22.6% (industry average: 13.8%*)
  ability offered to customers                        customers in collaboration between the
                                                                                                           *“FY2019 E-Commerce Market Survey” published by the Ministry of Economy, Trade and
                                                                                                           Industry

• Knowhow to attract new customers                    Product, Sales, and Promotion                       • Necessary measures are under
                                                      Departments                                           development for the establishment of the
                                                                                                            OMO system

                                 Solving issues the Company must deal with

                      Delayed recovery in
                                                          Further strengthening online               Acceleration of casualization
                   commercial facilities in large
                                                                      sales                               of business wear
                             cities

                                                                                                       Problem regarding cost
                   Decline in product unit prices              Inventory efficiency
                                                                                                             structure

                                                                                                                                                                                                31
 Preconditions for the Period of the Medium-Term Management
  Plan (From FY2021 to FY2023)

     In light of changes in the market environment, priority
      has been put on improvement in profitability for the
          period of the Medium-Term Management Plan

      1. Recovery in commercial facilities in large cities may take
         time
      2. Difficult to expand businesses based on new store openings
         → Review a strategy for store openings and an area strategy

      3. Changes in business demand are accelerating
         → Rethink the mix of merchandise suitable for the new normal

      4. The need to strengthen customer contact through the
         Internet is increasing
         → Further strengthening measures centering on the Company’s e-
            commerce site

                                                                          32
 New Medium-Term Management Plan for the Period from FY
  2021 to FY 2023

  Basic policy: “Weather the crisis and regain our earnings
    power”
  1. Drastically review the revenue structure
  2. Regain earnings power
  Financial targets (partly modified in light of the COVID-19
   pandemic)

     Consolidated operating
   income for the final fiscal    ¥7,000-8,000 million
   year of the Medium-Term         *We intend to improve this from an expected loss of ¥6,500 million for FY2021 to an
       Management Plan             increase by ¥13,500-14,500 million on a cumulative basis for the next two years.

  ROE for the final fiscal year
    of the Medium-Term            12-14%
      Management Plan             *Remain unchanged

  Dividend payout ratio during
                                  Plan to disclose it after scrutinizing financial conditions,
       the Medium-Term            including the Company’s future investment plan, financial                              33

       Management Plan
                                  market developments, and other necessary factors

                                                                                                                         33
 New Medium-Term Management Plan
  “Drastically Review the Revenue Structure”
   • Determining unprofitable subsidiaries, businesses and stores (closure of
     stores/streamlining, etc.)
      - Expecting to close consolidated stores by around 10% at this stage, and continue to consider
        closure/streamlining

   • Structural reform of the head office organization
      - Reorganizing functions/operations, and enhancing productivity by reducing low value added
        operations
      - Continuing remote work, integrating the head office through introduction of the free address
        system, etc., and reducing fixed costs

   • Changes in personnel measures
      - Expecting a reduction in the number of employees by around 10% by the final fiscal year of
        the Medium-Term Management Plan through a reduction in hiring, etc.
      - Strategically assigning staff members in priority areas such as online sales and customer
        support
      - Correcting downward rigidity of personnel expenses and shifting to a remuneration system
        highly linked with business performance
      - Continuing partial cuts in compensation paid to directors

   • Improvement in the gross margin by enhancing inventory efficiency
      - Investigating an appropriate way to hold inventories through the inventory improvement
        project, and improving the gross margin

                                                                                                       34
 New Medium-Term Management Plan
  “Regain Earnings Power”

 • Improvement in revenue of
   core businesses
 1. Improvement in terms of merchandise
 •   Changes in season-based merchandise, introduction of
     seasonless products to deal with climate change
 •   Product development focusing on the new normal
     Strengthening casual products, development of one mile wear,
     expansion of wellness products (outdoor, yoga, etc.)
 •   Modification of the price range

 2. Improvement in terms of sales/
    promotion
 •   Establishment of contactless communication
     with customers through online customer
     services, live stream of explanatory video of
     products, etc.
 •   Brushing up comments appeared in the
     e-commerce site

                                                                    35
 New Medium-Term Management Plan
  “Regain Earnings Power”
    • Business development in line with the new era
       • New business development with a concept focusing on the new normal
       • Business conditions for which multi-store openings are not assumed, based on the
         Company’s e-commerce site
       • Acquiring our new customer base by introducing a price range between GLR and COEN

    • Promotion of OMO
      1. Enhancement in terms of software
       • Aiming to become the top company in the industry in terms of ability to serve customers
         for online shopping and the quality of comments on merchandise and styling images
         (Utilization of SNS, enhanced engagement of sales representatives in online sales, etc.)

    2. Innovation of hardware
       • Redesigning the Company’s e-commerce site by using our own infrastructure, possibly
         during FY2022
       • Intend to offer services equivalent to those of physical stores in online shopping

Software     Enhancement of software such as online customer services and live streaming             Promoting measures
                                                                                             Site
                                                                                                     harmonizing with the
                                                                                           renewal
                                                                                                          new site
Hardware                                System development

           FY2021                                                    FY2022                                      FY2023

                                                                                                                            36
 The Matrix of Issues the Company Must Deal With and Matters to
  Be Handled in the New Medium-Term Management Plan

                                                                   Delayed
                                                                                                 Acceleration of
                                                                 recovery in         Further                        Decline in                    Problem
                                                                                                  casualization                   Inventory
                                                                 commercial      strengthening                     product unit                regarding cost
                                                                                                   of business                    efficiency
                                                                 facilities in    online sales                        prices                      structure
                                                                                                      wear
                                                                 large cities
                                  Withdrawal from or
                                  streamlining of unprofitable
                                                                                                                                                  
 Drastically review the revenue

                                  stores, businesses, and
                                  subsidiaries

                                  Structural reform of the
                                                                                                                                                   
             structure

                                  head office organization

                                  Changes in personnel
                                  measures                                                                                                         
                                  Improvement in inventory
                                  efficiency                                                                                                       
                                  Improvement in revenue of
                                  core businesses
                                  Improvement in terms of                                                                          
                                  merchandise
        Regain earnings power

                                  Improvement in revenue of
                                  core businesses
                                  Improvement in terms of                                                                          
                                  sales/promotion

                                  Business development in
                                  line with the new era                                                              

                                  Promotion of OMO                                                                                              

                                                                                                                                                                37
 Steps to Recover Earnings and the Breakdown of
  Improvements
              First half: Switching to a structure that can secure profit;
            Latter half: Building the foundation for new business growth
Aiming to improve operating income by ¥13,500-14,500 million for the next two years
    Switching to a low cost structure (increasing income even when sales decline)

                                                                                          Building the foundation for long-term business growth
                                                      • Correction of the mix of
                                                        merchandise for “Sale,”
                                                        which has dramatically
                                                        increased this fiscal                                     Changes in consolidated
                                                                                                 Increase in         subsidiaries, etc.
                                                        year
                                                      • Reviewing a way to                     income backed
                                                        hold inventories                      by a recovery in
                                                                                                    sales

                                                                                                                                             Operating
                                                                                               • Recovery in sales                           income of
                                                                                                 through operations at                        ¥7,000 -
           • Reduction in hiring      • Reaction to the                                          full capacity in physical
           • Revision in                booking of                        Increase in                                                          ¥8,000                  Aiming to
                                                                                                 stores
             personnel measures         valuation loss                  income backed
                                                                                               • Online store sales                            million                  improve
           • Scrutinizing               stemming from                  by a recovery in                                                                                operating
                                                                                                 growth
             unprofitable               the COVID-19                  the gross margin                                                                                income by
             businesses, etc.           pandemic                                                                                                                       ¥13,500-
                                                                                                                                                                    14,500 million
                                                                                                                                                                     for the next
     Expecting                         Decrease in valuation loss                                                                           FY2023                     two years
                                          stemming from the
    an operating                         COVID-19 pandemic
       loss of                                                      * We expect sales for FY2023 to be equivalent to around 95% of sales in FY2019
       ¥6,500                                                         (excluding effects from the deconsolidation of CHJP).
                       Reduction in
       million          fixed costs                                 * We expect the gross margin for FY2023 to be a little over 50%, equivalent to the result
                                                                      in FY2019 (the gross margin for FY2021 is expected to be 45.3%).

                                                                                   * Please note that the above perspectives for improvements are based on provisional calculations at
   FY2021                                                                            this stage. There is a possibility that the breakdown of items will change in the future.

                                                                                                                                                                                  38
 Movements in the Consolidated Gross Margin
     (Degree of Impact)

                                                                           FY19                                       FY20                                   FY21
                                                                                       Full Fiscal                                Full Fiscal                          Full Fiscal
                                                               1H           2H           Year             1H           2H           Year            1H       2H          Year

Gross margin for the fiscal year                              51.5%         51.4%        51.4%           51.7%         50.1%        50.8%          42.9%     47.0%       45.2%

Gross margin for the corresponding period of the
previous fiscal year                                          51.2%         51.7%        51.5%           51.5%         51.4%        51.4%          51.7%     50.1%       50.8%

Difference                                                      0.3pt        -0.3pt       -0.0pt           0.2pt       -1.4pt        -0.6pt         -8.7pt    -3.1pt      -5.6pt

 Factors that impacted the consolidated gross margin and the levels of overall impact
  Impact of movements in the gross margin of UNITED
  ARROWS LTD.’s total business units                            0.3pt        -0.3pt        0.0pt          -0.1pt       -1.4pt        -0.8pt         -6.0pt        -            -

  Impact of movements in the gross margin of UNITED
  ARROWS LTD.’s outlet and other stores                         0.1pt         0.1pt        0.1pt           0.1pt         0.2pt        0.1pt         -0.9pt        -            -

  Impact of movements in other costs at UNITED
  ARROWS LTD.                                                  -0.1pt         0.1pt        0.0pt           0.0pt         0.0pt        0.0pt         -1.4pt        -            -

  Other factors (subsidiary trends, consolidated
  adjustments, sales composition, etc.)                         0.1pt        -0.2pt       -0.1pt           0.2pt       -0.1pt         0.0pt         -0.5pt        -            -

  * Due to the change in the scope of consolidation, the breakdow n of the differences in the 2H and the Full Fiscal year of the FY21 period is omitted.

                                                                                                                                                                                39
 Trends in the Consolidated SGA Expenses to Sales Ratio

                       FY19                               FY20                               FY21
               1H      2H      Full Fiscal Year   1H      2H      Full Fiscal Year   1H      2H      Full Fiscal Year

Total of SGA
Expenses
               47.3%   42.2%      44.5%           46.4%   44.2%      45.2%           55.8%   46.6%      50.6%
Advertising
Expenses
               2.4%     2.1%         2.2%         2.3%     3.1%         2.7%         3.0%     2.6%         2.8%
Personnel
Expenses
               17.0%   14.4%      15.6%           16.9%   15.1%      15.9%           21.1%   16.1%      18.3%
Rent           14.7%   13.9%      14.2%           14.4%   14.2%      14.3%           17.1%   15.6%      16.3%
Depreciation   1.3%     1.1%         1.2%         1.3%     1.2%         1.2%         1.6%     1.2%         1.4%
Other          12.0%   10.7%      11.3%           11.5%   10.6%      11.1%           12.9%   11.1%      11.9%

                                                                                                                        40
You can also read