COVID 19: the Impact of Lockdown announcement on Indian Stock Market
←
→
Page content transcription
If your browser does not render page correctly, please read the page content below
IOSR Journal of Business and Management (IOSR-JBM)
e-ISSN: 2278-487X, p-ISSN: 2319-7668. Volume 23, Issue 6. Ser. VII (June 2021), PP 27-36
www.iosrjournals.org

  COVID 19: the Impact of Lockdown announcement on Indian Stock
                             Market
                                                      Samrat Banerjee
                           (Assistant professor in commerce, St. Xavier’s University, Kolkata)
                                                       Sagnik Ghosh
                                   (B.Com Hons. from St. Xavier’s University, Kolkata)

Abstract
This empirical research paper studies the Impact of Covid 19 Lockdown on the Indian Stock Market Indices.
The paper undertakes Event Study methodology to showcase the short-term effect of the Lockdown on the
various Indian Stock Market Indices, mainly SENSEX and NIFTY. The paper follows the hypothesis of how an
event can have an impact on the stock market as it takes into account all current political and social situations
into its financial information. Through this paper, six Indian Stock Market Indices like BSE SENSEX, NIFTY
50, BSE AUTO, BSE BANKS, BSE HEALTHCARE, NSE AUTO, NIFTY BANK, NSE PHARMA and their returns
have been analyzed before and after the imposition of Lockdown. The correlation among these indices then have
been calculated to understand the relation between these indices. A period of 50 days has been taken into
account to conduct the descriptive statistical research.
Keywords: Lockdown, Abnormal returns, Stock Market
---------------------------------------------------------------------------------------------------------------------------------------
Date of Submission: 08-06-2021                                                                 Date of Acceptance: 21-06-2021
---------------------------------------------------------------------------------------------------------------------------------------

                                                      I.     Introduction
         Indian stock market which was introduced as a mean to bring transparency in the equity market, started
to become excessively exposed to the global market since post liberalization in the 1900’s. Most of the
exchange of securities in India happen over NSE and BSE. SEBI played an important role in handling the Indian
Stock market in a matured way. The Indian Stock grew rapidly by adhering and undertaking globally accepted
procedures. The SENSEX of Bombay Stock Exchange was created in the 1990’s which was majorly
concentrated to assist the Indian Stock Market to be connected to the global stock markets. This meant both the
global investors and domestic investors would shape up the economy of India, thus help in increasing the
reserve and growth. At a time when the global investors are looking to invest heavily into the midcap and large
cap funds, this COVID-19 comes as a big halt. It has been recorded that since the pandemic outbreak, the S&P
500 indices have a return of -12.2% (Parag Verma and Ankur Dumka). As on the date before the lockdown was
announced, the 30-share index ended at 29,915, rising 1,629 points and the 50-share barometer closed 483
points higher at 8,745 (Businesstoday.in) In Europe, the Financial Times Stock Exchange 100 index witnessed a
sharp one-day fall since 1987 (BBC News, 2020). In March 2020, the leading stock exchange of UK, FTSE saw
a decline of 12%. “The global stock market has struck out about US$6 Trillion in one week from 24th to 28th
February”(Arun O. , 2020). Many studies on this pandemic have empirically proved that the shocks from this
pandemic can have an inconsequential negative impact on the economic and financial system across globe.

                                                II.        Literature Review
        Elt on et al (1981) concluded in his study that abnormal stock movements can be recorded if there are
unexpected earnings in excess of expectations during the earnings announcement period.
        MacKinley (1997) in this empirical study argued that the event study methodology spanning from the
1930’s to the late 1960’s improved in context of identifying biases
        Iqbal and Mallikarjunappa (2007) examined the market response to quarterly salary announcement of
149 organizations listed on the Bombay Stock Exchange for September 2001 through using each parametric and
non-parametric test. It is determined that throughout evet window, runs exams are full-size at 5% level, which
signifies that bizarre returns appear randomly. On the different hand, t-test rejects the existence of peculiar
returns on day-by-day basis., which gives a possibility to beat the market and earn ordinary returns. The learn
about concludes that Indian inventory market is now not environment friendly in semi-strong form.
        Kruger, Nthoesane and Mlonzi (2011) observe that whether or not there are any good-sized ordinary
returns round the public announcement of revenue and to set up whether or not the environment friendly capital
market speculation applies to the small ALtX market. The learn about centred on all the organizations listed on
DOI: 10.9790/487X-2306072736                                 www.iosrjournals.org                                          27 | Page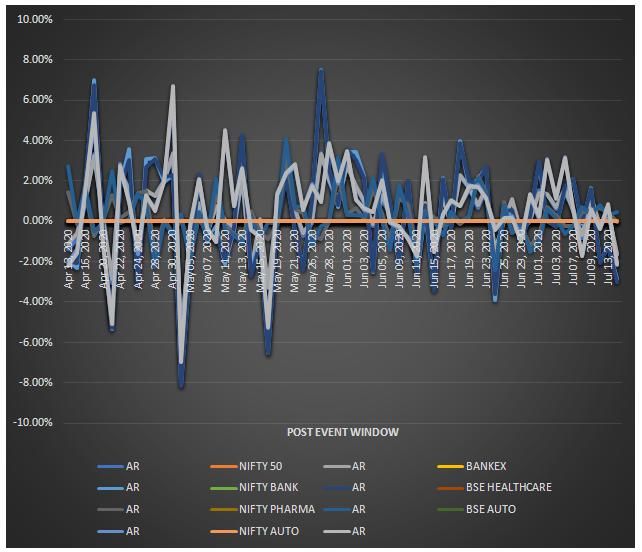
COVID 19: The Impact of Lockdown announcement on Indian Stock Market

the JSE-ALtX market. Methodologies like Capital Asset Pricing Model (CAPM) had been used to calculate the
anticipated returns. The find out about concluded that the shareholder’s wealth was once eroded throughout the
recessionary length in the ALtX market, on the other hand the vulnerable shape of market effectivity affords a
probability for entrepreneurs and traders to take advantage of the market for earnings when the market is
performing well.Donadelli et al. (2017) and Zouaoui et al. (2011) documented that they have an effect on of a
sickness outbreak on an investor’s sentiment is greater outstanding in culturally interdependent countries.

        Another associated investigation on the impact of flu epidemic on inventory market evaluation with the
aid of (Dong and Heo 2014) offers an immediately proof that confined consideration delivered about by using
exogenous interruption influences the inventory market members and widely wide-spread investors. In
particular, they appeared at the progressions of professional forecast behavior at some point of flu pandemics
when investigators are confronting barriers triggered with the aid of interruption of encountering influenza facet
consequences with the aid of their relatives, household members, associates, and themselves.
        The study is close to the impact on of Covid-19 on Global Stock Market indices (Mohammed N. Abu-
Alfoul, Mohammed Bani Hani, 2020). Analysis of the effect of Covid 19 on the Global Economy for the time
duration of starting of 2020 to March when Covid unfold to most of the different international locations (Ozili
and Arun, 2020)
        Mondal (2020) has fastidiously analysed the bad influence of the lethal pandemic on the Indian
inventory market.
        Cepoi (2020) used statistical quantile regression learn about to exhibit the asymmetry relationship
between the inventory market of exclusive rising economies and the COVID 19 associated news.

                                      III.    Objective of the Study
         The objective of this study is to empirically analyse the returns of the stock market indices like BSE
SENSEX, NIFTY 50, BSE BANKEX, NIFTY BANKS, BSE HEALTHCARE AND NSE PHARMA The paper
empirically tries to revaluate the effect of the pandemic lockdown announcement on these aforementioned
indices. The paper tries to examine the selected companies’ stocks based on the announcement of the Lockdown
by the government of India.

                                     IV.      Research Methodology
         The data from which we will apply the statistical methodology is secondary data. The data we have
collected for the above indices is from Yahoo Finance and InvestingIndia.com. The time period taken into
consideration is from 15th November, 2019 to 20th August 2020. Now, in this empirical study we have applied
some statistical methods that have been used to observe if there is any noteworthy effect of the Lockdown on the
India’s Financial Stock Indices.
         This study aims to check how the stock market indices of India react to the COVID-19 Pandemic
lockdown event, using the standard event study methodology of Warner and Brown (1985). Browner and
Warner (1985) in their empirical study applied this methodology which would help us understand the economic
impact of the COVID-19 on the stock market indices. Other statistical tools like Standard Deviation and
Correlation have been used to find the volatility in the pre-lockdown announcement and post-lockdown
announcement period. In order to maintain uniformity of our research, we have collected data of historical
prices with regards to NSE and BSE. We have collected secondary data from the time period of 15 November,
2019 to 15 August, 2020.
         The data focussed in this research paper are the historical prices(daily) of the BSE and NSE stock
indices. The study of this event, the deviation of the stock index to its historical average is measured. This study
works on the working of calculation of abnormal returns and the cumulative abnormal returns. The analysis
provides positive or negative abnormal returns based on how the market reacts to the announcement, can be
both favourably or unfavourably.

1.1.1     Event Date: On the evening of 24th March, 2020, Hon’ble Prime Minister of India announced the
nationwide lockdown due to the corona virus for a period of 21 days. After such an announcement, the eyeballs
and attention of people across the country were caught. Thus, the event date for this empirical study has been
considered as the 25th March, 2020.
1.1.2     Event Window: The event window refers to the time period that has been taken into consideration for
analysing the impact of COVID 19 containment protocols on the stock market. For this an event window of 10
days have been considered to see if the stock indexes/market reflect all true information of the economic market
or not in the short run. The t day is referred to as the event day that is the 25th March, 2020.

DOI: 10.9790/487X-2306072736                         www.iosrjournals.org                                 28 | Page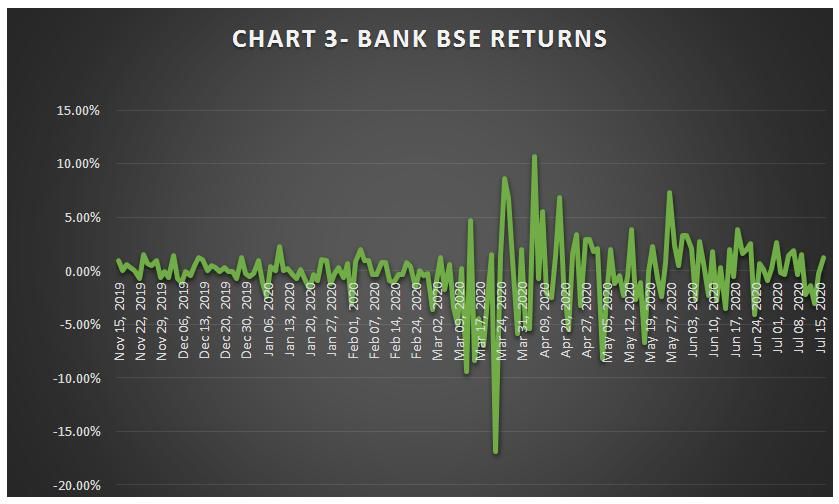
COVID 19: The Impact of Lockdown announcement on Indian Stock Market
1.1.3 Estimation Window: This window is the time period within which all the historical data compiled of
are averaged and results in the expected return. In this research paper, the estimation window is considered for 80
days that is from the (-91) to (-10) days prior to the event day. A total of 80 trading days have been considered to
find the average historical returns.
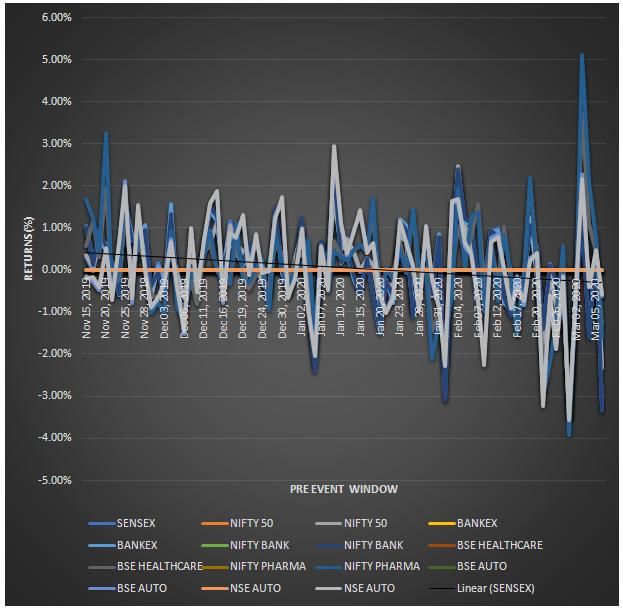
In the next section, we will study and analyse the event study results. We will begin by analysing the
Index charts – Abnormal Return and Cumulative Abnormal Returns. We have calculated the abnormal returns
and cumulative abnormal returns of stock indices (BSE SENSEX, NIFTY50, NIFTY BANKS, BSE BANKEX,
NIFTY PHARMA, BSE HEALTHCARE, BSE AUTO, NIFTY AUTO). The Cumulative Abnormal Returns
have been calculated for (5) days and (10) days post the event and (-5) days and (-10) days before the event
announcement. Then we move on to descriptive statistics where we divide the event between pre-event and post
event time period. In this process we use the statistical tools like Mean, Variance, Standard Deviation, Skewness
and Kurtosis on the daily returns of the Indices aforementioned – to check the desirability and the volatility of the
indices based on the event of Pandemic Lockdown announcement.
V. DATA FINDINGS AND ANALYSIS
BSE SENSEX INDEX
The volatility of the BSE SENSEX has been measured using statistic mechanisms. The returns of the
BSE SENSEX were calculated for a period of 167 days including both pre lockdown and post lockdown
announcement. As we can observe from the above Chart 1, the daily returns of the BSE SENSEX index have
been recorded for a time period from November 2019 to July, 2020. We can understand that the peak rise in the
Index above is lower than the sharp decline in the Index i.e., the fall is almost near 15%.
NIFTY 50 INDEX
The Chart 2 below shows the daily return graph of NIFTY 50 returns. This graph represents the change
or volatility of returns in the NIFTY 50 stock index from the time period of November,2019 to July,2020. In the
month, the pandemic lockdown was announced, there was a sharp increase and fall in the return of the stock
index, especially around the date of March,24, 2020. Even in this stock index, we observe that the fall or
decline(almost,15%) is more than the rise in the average return of the index.
DOI: 10.9790/487X-2306072736 www.iosrjournals.org 29 | Page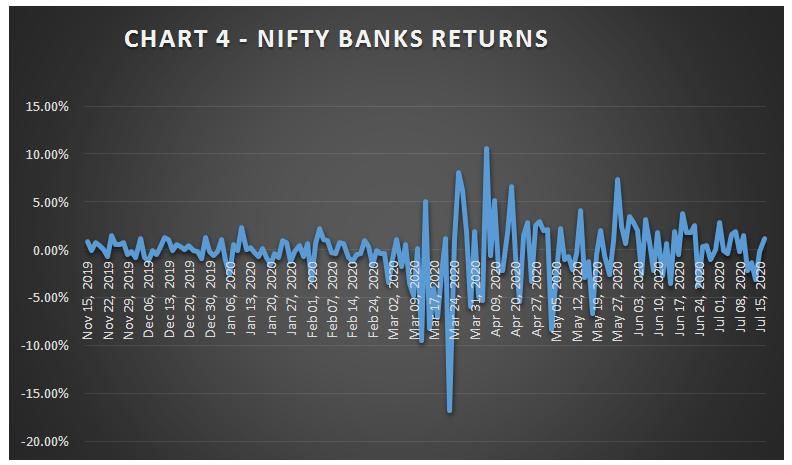
COVID 19: The Impact of Lockdown announcement on Indian Stock Market

BSE BANK INDEX
          The Chart 3 is an indicator of how the Banks listed on the BSE index were recording returns from a time
period of November,2019 to July,2020. In this chart, the volatility is in its peak during the announcement of the
lockdown. The time period before the year 2020 shows not much volatility however the fall in the BANK BSE
returns is steep and in larger percentage.

NIFTY BANKS INDEX
The banks listed on NIFTY 50 are more or less secured and don’t have much risk associated to it. However, in the
time frame of March15, 2020 to April,01,2020, the returns of this index are largely volatile. The daily returns of
this index during this period are fluctuating and shows huge difference in the returns. (as shown in the Chart 4).

DOI: 10.9790/487X-2306072736                        www.iosrjournals.org                                30 | Page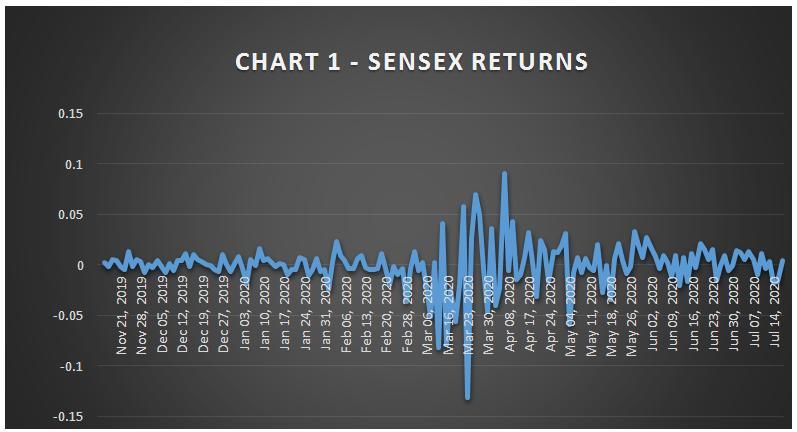
COVID 19: The Impact of Lockdown announcement on Indian Stock Market

          The table below reports the ARs and CARs of the stock indices BSE SENSEX, NIFTY 50, BSE
BANKEX, NIFTY BANKS, NIFTY AUTO, BSE AUTO, NIFTY PHARMA, BSE HEALTHCARE for the days
pre and post announcement of the Pandemic Nationwide Lockdown – containment protocols measures. The CAR
(5) days CAR (10) DAYS, CAR (-5) days and CAR (-10) days have been calculated. Of the 8 indices that have
been taken into consideration, 5 indices have significant high CAR for the 5 days and 10 days event window.
          BSE SENSEX had negative ARs and significant positive CARs for both 5-day and 10-day event
window. However, following up to the event, we observe that the CARs of (-5) days and (-10) days have been
significant negative returns. For NIFTY50, we observe insignificant Abnormal Returns post the event and
significant positive CARs (5) and (10) days of event window. However, NIFTY 50 has a rather more
insignificant CARs (-5) and (-10) days pre the event announcement as compared to BSE SENSEX. BSE
BANKEX and NIFTY BANKS both have significant and equivalent CARs (5) and (10) days. However, NIFTY
BANKS have insignificant negative ARs and BSE BANKEX have recorded significant positive ARs post the
announcement of the lockdown. BSE AUTO has recorded negative ARs while it recorded only a minimal CAR in
the 5 days event window. However, the CAR of BSE Auto increased exponentially in the 10-day event window.
This means in the first few days just after the announcement of the lockdown, people were not desiring to invest
heavily in the automobile companies listed in the BSE. However, in the days before the event, automobile
industry was undergoing a slump and that reflects well and clear in the CAR (-5) and (-10) days event window.
NIFTY Pharma if observed properly, we will notice has significant CAR (10) days event window. It has a
positive CAR of 32.14% as compared to -13.72% CAR of (-10) days event window. The cumulative abnormal
returns of BSE Healthcare in the 5 days and 10 days event window are 5.89% and 27.29% respectively. In the (-
5) and (-10) days event window, the CAR of BSE Healthcare was a negative -5.94% and -16.04%. O
          Overall, if we observe the chart below, we realise that the lockdown protocols have led to a positive
impact on the economic activity of the country. The stock indexes have recorded a positive CAR in the 5 days
and 10 days event window.
          The pharma and healthcare industries have in particular recorded higher CAR in the 10 days event
window, which reflects that the lockdown protocols reassured the investors to be investing more in the healthcare
and pharma industries. Even though the stock indices recorded a positive CAR in the 5-day event, we observe
that the CAR of BSE AUTO and NIFTY AUTO was an insignificant percentage, largely because of the reason
that lockdown meant, less usage of private transportation. Investors felt that auto industries will be making losses,
which resulted in the prices or returns of those industries.

DOI: 10.9790/487X-2306072736                         www.iosrjournals.org                                  31 | Page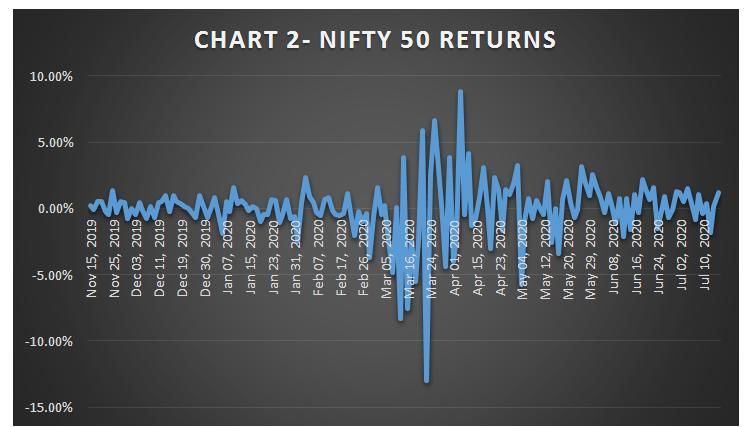
COVID 19: The Impact of Lockdown announcement on Indian Stock Market

1 : Abnormal Returns1 and Cumulative Abnormal Returns of 8 Stock Indicis of India following the

    STOCK INDEX     AR%          CAR5%      AR%         CAR10%     AR%         CAR (-5)%    AR%       CAR (-10)%
    BSE SENSEX          -3.94%    7.26%        -1.37%     16.69%    -5.45%         -4.50%    11.76%       -18.29%
    NIFTY 50            0.39%     7.06%         0.39%     16.87%    0.39%          -5.11%    12.17%       -18.89%
    BSE BANKEX          0.39%     8.02%         0.39%     16.76%    0.39%         -13.87%     0.39%       -30.37%
    NIFTY BANKS         -0.70%    8.12%        -0.70%     16.58%    -0.70%        -14.88%    23.00%       -30.73%
    NIFTY AUTO          -0.70%    1.17%        -0.70%     18.89%    -0.70%        -13.05%    -0.70%       -24.55%
    BSE AUTO            -1.29%    0.81%        -2.04%     18.53%    -4.74%        -12.20%    13.01%       -23.67%
    NIFTY
    PHARMA              -2.10%    6.14%         2.76%     32.14%    -3.93%         -3.72%     9.86%       -13.72%
    BSE
    HEALTHCARE          -1.52%    5.89%         1.44%     27.29%    -4.71%         -5.94%    11.83%       -16.04%

The table 2 below is a representation of the Abnormal Returns recorded in the event window

                  Figure 1 - Stacked Line Graph of 8 stock indices in the pre-event period

1
    Source: Own study
DOI: 10.9790/487X-2306072736                            www.iosrjournals.org                              32 | Page
COVID 19: The Impact of Lockdown announcement on Indian Stock Market
Figure 2- Stacked Line Graph of the 8 stock indices in the post event window
2 - Descriptive Statistics in the Pre-Event Period
In the table above, the descriptive statistical tool have been used with regards to the pre-lockdown
announcement period, ranging from November 15th,2020 to January 24th, 2020. The period is a total of 50 days.
We observe that the average return of SENSEX stock index is around 7%, however the variance is 0.000540854
which means the numbers in the data set are more or less identical and the spread is low. This results in smaller
standard deviation, that shows us that the price of the stock in general hasn’t moved much further away from the
mean return of the indices.We also see that the daily returns are negatively skewed meaning that if any negative
shock takes places across any of the indexes, the investors would expect to receive negative yield thus, leading
to increase in disinvestment in the stock market. A positive kurtosis value can be observed that means, the
distribution is peaked and possesses thick tails. This means that the values are located more towards the tails of
the distribution rather than around the mean. But as we observe, even though the kurtosis are highly positive, the
DOI: 10.9790/487X-2306072736 www.iosrjournals.org 33 | PageCOVID 19: The Impact of Lockdown announcement on Indian Stock Market
standard deviation are equally low, that means it’s a positive indicator. BSE AUTO AND NSE AUTO however
have shown negative kurtosis, which means that they have flat distribution and thin tails. SENSEX and NIFTY
50 have negative skewness. The Kurtosis values are huge and the Skewness values are positive, that means there
is not a high function of risk in the market. Kurtosis values are large which means tails are smaller and the data
in the data set are not on the extreme sides. However, if we observe
3 - Descriptive Statistics in the Post Event Period
BSE
NIFTY NIFTY BSE NSE
SENSEX NIFTY 50 BANKEX HEALTHCA
BANKS PHARMA AUTO AUTO
RE
MEAN 0.25% 0.31% 0.22% 0.22% 0.20% 0.21% 0.48% 0.50%
0.000181 0.0001699 0.0001447 0.00029421 0.00030434
VARIANCE 0.0005867 0.0005867 9.7153E-05
02 6 03 6 6
STD 9.0509E- 8.49799E- 0.0002933 7.23514E- 0.00014710 0.00015217
0.00029335 4.85765E-05
DEVIATION 05 05 5 05 8 3
0.351285 0.5538011 0.9585680 0.95856802 1.8728863 1.85180897 1.69204643
KURTOSIS 1.427737072
53 7 25 5 33 2 5
- - - - - -
0.7526644
SKEWNESS 0.426839 0.5216115 0.0728410 0.07284107 0.379986213 0.52926112 0.53039948
1
9 7 7 1 4 1
In the table 3, as shown above, we see post the lock announcement, in a time period of 50 days there
are a lot of changes as compared to table 3. We have seen a rise in the mean/average returns of these stock
indices, approximately by 30-40%. This shows that the investors have higher expectations and the negative price
fluctuations have minimalized. In the above table, we have considered the time period of 50 days from the event
date of 25th March,2020, that is to check how the indices have performed post the announcement of the
lockdown. The table reflects the standard deviation to be larger than the standard deviation noted in the table 2.
Standard deviation is the prime measure of risk, this shows that even though average return of the stock indices
have decreased, but the standard deviation values haven’t increased exponentially. This means the stock
investors do not have huge fear of investment.
4 - Correlation Matrix
BSE NIFTY BSE NSE BSE NIFTY
SENSEX NIFTY50 BANKEX BANKS AUTO AUTO HEALTH PHARMA
SENSEX 1
0.995901
NIFTY50 912 1
0.940784 0.938297
BSE BANKEX 638 618 1
NIFTY 0.940784 0.938459 0.93829761
BANKS 638 199 8 1
0.877005 0.881605 0.82283500
BSE AUTO 188 247 8 0.822835008 1
0.875888 0.882916 0.82571403 0.9991334
NSE AUTO 86 708 9 0.825714039 49 1
0.701495 0.717664 0.57719602 0.6409356 0.6358366
BSE HEALTH 702 146 3 0.577196023 14 93 1
NIFTY 0.632748 0.650313 0.50724773 0.5707809 0.5655849 0.97525763
PHARMA 891 5 2 0.507247732 3 51 4 1
Correlation is a statistical methodology which helps in analyzing that if two of variable are related/
dependent on each other or not. The result of correlation is called correlation coefficient which is indicated as
“r”. The value lies between +1 and -1. The relation of the pair of variables depends on the correlation
coefficient. If r=0, then we say that the pair of variables are not related to each other. If r is positive, we say that
the set of 2 variables are directly related to each other meaning if in one variable set gets a positive shock in it’s
data set the other variable set would also showcase a positive shock too. If r is negative, we say that the pair of
variables are inversely related to each other meaning if one data set observes a positive shock, the other data set
would observe a negative shock.
In the above correlation matrix, we study the correlation between returns of 8 stock indices of India, namely the
BSE SENSEX, NIFTY50, BSE BANKEX, NIFTY BANKS, BSE AUTO, NSE AUTO, BSE HEALTHCARE
and NIFTY PHARMA. We test if any of the one stock index undergoes a negative or positive shock, the other
stock index/indices replicate any similar shock or not by any magnitude.
DOI: 10.9790/487X-2306072736 www.iosrjournals.org 34 | PageCOVID 19: The Impact of Lockdown announcement on Indian Stock Market
From table 4, we can observe that the SENSEX being the independent variable and the NIFTY 50, BSE Bankex
and NIFTY Banks being the dependent variable, the correlation is 0.99590, 0.94078 and 0.94078 respectively.
In fact, the correlation between SENSEX and NIFTY BANKS AND BANKEX are the same. This shows that
there is multi-collinearity and the values are less dispersed from each other. This is a positive sign as it shows all
the indices are growing towards the same direction. However, we can notice that NSE AUTO and BSE AUTO
maintains not so close relationship as it maintains a moderate strong relationship.
VI. Conclusions And Recommendations
This study conducted has brought forth many distinct conclusions regarding the short-term impact of
the announcement of the Lockdown Protocols by the Government of India on the stock indices of India. This
paper very strategically has taken basic statistical methodologies which are Event Study Methodology and
Correlation Test to showcase how in the short run (a period of not more than 50 days) can the announcement of
an event have an impact on the stock indices. The information is reflected in the prices of the stock market,
which is the main hypothesis of this research study. We observed that the CARs of the stock indices prior to the
announcement of the lockdown was highly negative, but post the lockdown protocols, the CARs became
positive. This means that the protocol brought a positive shock to the market and relieved the panic.
Correlation Analysis gave us an idea of how the stock indices are connected to each other. The crisis
of COVID 19 has brought a close connection between the indices. Descriptive statistical tools have been used
too to understand and Analyse the stock market indices. The average returns of the stock indices have decreased
post the lock down period, however, the kurtosis of the indices are exceptionally large, indicating that the
returns follow a leptokurtic distribution, especially in the post lockdown period. There is further scope of
research as we are coming across more waves of this pandemic.
References
[1]. Baker, S. R., Bloom, N., Davis, S. J., Kost, K. J., Sammon, M. C., &Viratyosin, T. (2020). The unprecedented stock market impact
of COVID-19 (No. w26945). National Bureau of Economic Research.
[2]. Ball, R., & Brown, P. (2014). Ball and Brown (1968): A Retrospective. The Accounting Review, 89(1), 1-26. Retrieved May 13, 2021, from
http://www.jstor.org/stable/24468510
[3]. Bhowmik, D. (2013). Stock market volatility: An evaluation. International Journal of Scientific and Research Publications, 3(10),
1-17.
[4]. Boone, L., Haugh, D., Pain, N., &Salins, V. (2020). Tackling the fallout from COVID-19. Economics in the Time of COVID-19, 37.
[5]. Bora, D., &Basistha, D. (2020). The outbreak of COVID‐ 19 pandemic and its impact on stock market volatility: Evidence from a
worst‐ affected economy. Journal of Public Affairs, e2623.
[6]. Cha, H., & Lee, B. (2001). The Market Demand Curve for Common Stocks: Evidence from Equity Mutual Fund Flows. The Journal of
Financial and Quantitative Analysis, 36(2), 195-220. doi:10.2307/2676271
[7]. Chaudhary, R., Bakhshi, P., & Gupta, H. (2020). The performance of the Indian stock market during COVID -19. Investment
Management & Financial Innovations, 17(3),
[8]. Chaudhary, R., Bakhshi, P., & Gupta, H. (2020). The performance of the Indian stock market during COVID -19. Investment
Management & Financial Innovations, 17(3), 133.
[9]. Cont, R. (2007). Volatility clustering in financial markets: empirical facts and agent-based models. In Long memory in
economics (pp. 289-309). Springer, Berlin, Heidelberg.
[10]. Fama, E. (1965). The Behavior of Stock-Market Prices. The Journal of Business, 38(1), 34-105. Retrieved May 13, 2021, from
http://www.jstor.org/stable/2350752
[11]. Firth, M. (1975). The information content of large investment holdings. The Journal of Finance, 30(5), 1265-1281.
[12]. Georgieva K, (2020) IMF Managing Director Kristalina Georgieva’s Statement Following a G20 Ministerial Call on the
Coronavirus Emergency.
[13]. Grier, P. C., & Albin, P. S. (1973). Nonrandom price changes in association with trading in large blocks. The Journal of
Business, 46(3), 425-433.
[14]. Ikram, S. (2014). Market efficiency Test of Indian capital market (Doctoral dissertation, Aligarh Muslim University).
[15]. Jonsson, R., &Radeschnig, J. (2014). From Market Efficiency to Event Study Methodology: An Event Study of Earnings Surprises
on Nasdaq OMX Stockholm.
[16]. Keim, D. B., &Madhavan, A. (1996). The upstairs market for large-block transactions: Analysis and measurement of price
effects. The Review of Financial Studies, 9(1), 1-36.
[17]. Khatatbeh, I. N., Hani, M. B., & Abu-Alfoul, M. N. (2020). The Impact of COVID-19 Pandemic on Global Stock Markets: An
Event Study. International Journal of Economics & Business Administration (IJEBA), 8(4), 505-514.
[18]. Khatatbeh, I. N., Hani, M. B., & Abu-Alfoul, M. N. (2020). The Impact of COVID-19 Pandemic on Global Stock Markets: An
Event Study. International Journal of Economics & Business Administration (IJEBA), 8(4), 505-514.
[19]. Kraus, A., & Stoll, H. R. (1972). Price impacts of block trading on the New York Stock Exchange. The Journal of Finance, 27(3),
569-588.
[20]. Lanfear, M., Lioui, A., & Siebert, M. (2017). Flight to Gold: Extreme Weather Events and Stock Returns. Available at SSRN
2894147.
[21]. Mukherjee, D. (2007). Comparative analysis of Indian stock market with international markets. Great Lakes Herald, 1(1), 39-71.
[22]. O’Callaghan, T. (2016). Reputation risk and globalisation: exploring the idea of a self-regulating corporation. Edward Elgar
Publishing.
[23]. Osagie, M., Maijamaa, B., & John, D. O. (2020). On the effects of Covid-19 outbreak on the Nigerian stock exchange performance:
Evidence from GARCH Models.
[24]. Ozili P, Arun T, (2020) Spillover of COVID-19: impact on the Global economy. MPRA paper no 99850.
DOI: 10.9790/487X-2306072736 www.iosrjournals.org 35 | PageCOVID 19: The Impact of Lockdown announcement on Indian Stock Market
[25]. Sarkar, P., Debnath, N., &Reang, D. (2021). Coupled human-environment system amid COVID-19 crisis: A conceptual model to
understand the nexus. Science of the Total Environment, 753, 141757.
[26]. Seetharam, Y. (2016). The dynamics of market efficiency: testing the adaptive market hypothesis in South Africa (Doctoral
dissertation, University of the Witwatersrand, Faculty of Commerce, Law and Management, School of Economic & Business
Sciences).
[27]. Yadav, Y. (2017). Impact of Mergers and Acquisitions on the Performance of the Indian Bank’s Share Price: An Event Study
Approach. Australian Journal of Management, Forthcoming.
References
[28]. Dong, H. a. (2014). Effect of COVID-19 Pandemic on Global Stock Market Values. Retrieved from ŒCONOMICA:
https://core.ac.uk/download/pdf/322522307.pdf
[29]. Geogieva, K. (2020, April 09). International Monetary Fund. Retrieved from International Monetary Fund Website:
https://www.imf.org/en/News/Articles/2020/04/07/sp040920-SMs2020-Curtain-Raiser
[30]. www.investing.com
[31]. www.yahoofinance.com
[32]. https://statisticsbyjim.com/basics/correlations/
Samrat Banerjee. “COVID 19: the Impact of Lockdown announcement on Indian Stock
Market.” IOSR Journal of Business and Management (IOSR-JBM), 23(06), 2021, pp. 27-36.
DOI: 10.9790/487X-2306072736 www.iosrjournals.org 36 | PageYou can also read