Singapore Property Market Index - Q1 2021
←
→
Page content transcription
If your browser does not render page correctly, please read the page content below
Singapore
Property Market Index
Q1 2021

Dr. Tan Tee Khoon
                                   Country Manager - Singapore,
                                   PropertyGuru

     Country Manager’s Note
     2020 was definitely a year to remember, marked by the COVID-19
     outbreak and the resultant global recession. But while Singapore’s
     economy continues to contract, the property sector remained
     surprisingly resilient – some would even say, bullish – in 2020.

     In particular, the final quarter closed with a +0.98% or 1.10-point
     increase in our Property Market Index (PMI) Q1 2021. This is the third
     consecutive quarter where we are seeing an increase in non-landed
     private property prices, showing a strong and consistent upward
     trend. Our PropertyGuru Property Supply Index (PPSI) also saw a
     28.9% or 55.0-point decline, as more properties were sold and their
     listings removed.

     Yet, in the same period, our economy shrank by 2.4% year-on-year
     (YoY). When we look at the full year, although we outperformed
     initial forecasts, Singapore still recorded a devastating 5.4%
     decline, which is our worst annual contraction since 2001 and
     the worst recession since independence.

     While a booming property market may seem counter-intuitive in the
     face of a recession, for many homeowners and home buyers, the
     current climate may present a golden window of opportunity.

PropertyGuru Singapore Property Market Index Q1 2021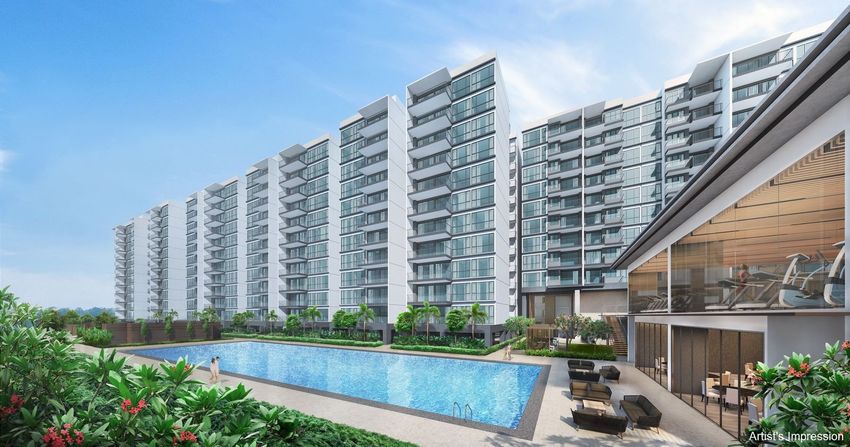
For those with savings and whose incomes are
                     unaffected by the recession, the low interest rate
                     environment may have brought their ambitions
                     forward, explaining the vibrant market.

                     Dr. Tan Tee Khoon
                     Country Manager - Singapore, PropertyGuru

     A word of caution though: While it is good to have aspirations, we
     must always remember that a mortgage is a long-term loan and low
     interest rates do not actually improve affordability.

     On the back of such robust activity, the Government has also hinted
     at possible intervention. If there is a new round of property cooling
     measures, we expect the curbs to focus on preventing new buyers
     from overleveraging and biting off more than they can chew. Instead
     of increasing taxes like the Additional Buyer’s Stamp Duty (ABSD),
     they are likely to tighten policies like the Loan-to-Value limit.

           PropertyGuru Singapore Property Market Index

           QoQ Property Market
           Index & Supply Index
           300

           250

           200

           150

           100

           50
                     4Q 6102

                               1Q 7102

                                         2Q 7102

                                                   3Q 7102

                                                              4Q 7102

                                                                        1Q 8102

                                                                                   2Q 8102

                                                                                             3Q 8102

                                                                                                       4Q 8102

                                                                                                                  1Q 9102

                                                                                                                            2Q 9102

                                                                                                                                      3Q 9102

                                                                                                                                                4Q 9102

                                                                                                                                                          1Q 0202

                                                                                                                                                                    2Q 0202

                                                                                                                                                                              3Q 0202

                                                                                                                                                                                        4Q 0202

                                                             Property Market Index                               Property Supply Index

                                                                                  Source: PropertyGuru

PropertyGuru Singapore Property Market Index Q1 2021
Contents
             1             The Guru View

             2             Property Price Index
                           and Analysis

              3            Property Supply Index
                           and Analysis

             4             District Roundup

                           The Stars: Top 10 Best-
             5             selling Condos

              6            Rising Stars: Condos
                           and Districts to Watch

              7            Conclusion

              8            About This Report
                           Methodology
              9            About PropertyGuru

PropertyGuru Singapore Property Market Index Q1 2021
Property prices continue to inch upwards

The PropertyGuru Property Price Index (SPPI) rose by
0.98% to 113.5 points. While the increase seems slight, this
is the third consecutive quarter that non-landed private
property prices have risen.

Year-end sales unaffected by the usual
seasonal dip

The fourth quarter of the year is typically a slow one
for the property sector, but Q4 2020 bucked the trend.
As year-end festivities were muted and the travel
restrictions remained in place, developers continued to
launch new projects that did well.

Resale market fast gaining momentum
In the non-landed private residential market, resale
transactions accounted for 54.5% of all transactions. This
is a significant change from the previous quarter, when
resale only made up for 42.7% of all transactions. This
may be due to the widening gap between new and
resale prices, as well as construction delays associated
with uncompleted projects.

Developer sales remain strong

Although the secondary market did exceedingly well in
the quarter, the primary market still performed
reasonably well. Developers sold a total of 2,574 non-
landed private residential units, with new launch project
Clavon at Clementi selling 70% of its units on launch
day, making it the best-selling project not just in Q4
2020, but in the entire 2020.

Buyers continue to favour affordable yet
spacious units

As with the previous quarter, buyers remained cautious
in their purchases, favouring properties in the $1,000,000
to $1,500,000 range. They also seem to lean towards more
spacious units that are between 1,000 to 1,300 sq ft, which
is about the size of a 4-room to 5-room flat.

Property Price Index
     and Analysis
     Property prices record slight increase for the
     third consecutive quarter in 2020

          PropertyGuru Singapore Property Market Index

          Property Price Index

                                                                                       113.5

                                                                              112.4
                                                        111.9

                      109.6
                    109.56

                    2020 Q1                            2020 Q2              2020 Q3   2020 Q4
                                                            Source: PropertyGuru

     The PropertyGuru Singapore Property Price Index (SPPI), which tracks
     asking prices in the non-landed private residential market, recorded
     yet again a slight QoQ gain of 0.98% to 113.5 points.

PropertyGuru Singapore Property Market Index Q1 2021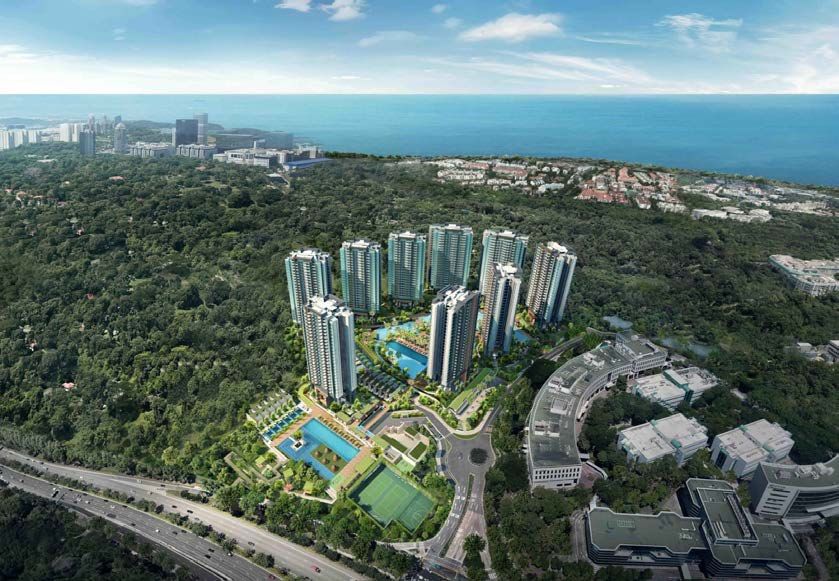
In terms of actual transacted
                                                       prices, URA recorded a 3%
                                                       increase in private non-landed
                                                       residential property prices. For
                                                       both     asking     prices      and
                                                       transacted prices, this is the third
                                                       consecutive quarter of increase.

                                                       Right after the circuit breaker
                                                       period, Q3 2020 saw a burst of
                                                       activity that was explained as the
                                                       release of pent-up demand.
                                                       Although sales volumes began to
                                                       taper down in Q4 2020, the
                                                       euphoria lasted longer than
                                                       expected.

                                                       The quarter seemed largely
                                                       unaffected by any seasonal
                                                       declines typically associated with
                                                       the year-end festivities and travel
                                                       season. Q4 2019 recorded dips in
                                                       both asking and transacted
                                                       prices, whereas Q4 2020 recorded
                                                       increases.

                                                       While the previous quarter saw
                                                       greater demand for new launch
                                                       projects, resale properties seem to
                                                       have quickly caught up in the
                                                       quarter, comprising 54.5% of all
                                                       non-landed private residential
                                                       property transactions. This is
                                                       atypical – the ratio is typically
                                                       closer to 50-50, with new launches
                                                       generally favoured.

PropertyGuru Singapore Property Market Index Q1 2021
PropertyGuru Singapore Property Market Index

          New Sale vs Resale

         New Sale 45.1%

                                                                                           Resale 54.9%

                                    Source: URA | Note: Breakdown excludes sub-sale transactions

    The revival of interest in resale properties can be explained by several
    observations: firstly, developers seem to be adjusting their prices
    upwards, in line with the growing buyer confidence. This is widening
    the price gap between new and resale properties, making resales seem
    more attractive, especially in our extremely price-sensitive market.

    Adding to that, many new and uncompleted projects (Buildings Under
    Construction,                  or      BUCs)       are   also     experiencing          COVID-19-related
    construction delays, which may not be ideal for the large group of
    genuine buyers with a time horizon of two years at most.

    Agents on the ground have also observed a growing preference for
    larger, more spacious properties, which are more easily found in the
    resale market.

    Compared to developer sales, resale transactions may also take longer
    to be recorded in URA’s data set, as the option period can be extended
    if needed. This means that there may have been a potential lag,
    explaining why the resale market seems to only be picking up now.

PropertyGuru Singapore Property Market Index Q1 2021
Property Supply Index
and Analysis
Housing supply glut clearing slowly and steadily
The PropertyGuru Singapore Property Supply Index (SPSI), which
tracks the number of non-landed private residential listings posted
on PropertyGuru, dipped by 32.7%, from 282.4 to 190.1 points this
quarter.
PropertyGuru Singapore Property Market Index
Property Supply Index
285
217
148
80
4Q
1Q
2Q
3Q
4Q
1Q
2Q
3Q
4Q
1Q
2Q
3Q
4Q
1Q
2Q
3Q
4Q
71
8
0
9
71
8
0
71
8
0
61
71
8
0
9
9
9
10
20
10
10
10
20
10
20
20
10
0
10
10
0
0
0
0
2
2
2
2
2
2
2
2
2
2
2
2
2
2
2
2
2
Source: PropertyGuru
PropertyGuru Singapore Property Market Index Q1 2021
Last quarter, the SPSI fell by 32.7% after the number of listings rose
     dramatically in the preceding “circuit breaker” quarter. This quarter,
     the listings count fell yet again by a similar measure.

     By tracking the listings on PropertyGuru, we gain insight on the
     movement of properties for sale. Such continued and sharp declines
     over the past two quarters suggest a healthy take-up rate as more
     advertisements are taken down once the properties have been sold.

     This trend and the supporting numbers indicate that the housing
     supply glut is slowly but surely clearing up. When we look at the
     uncompleted private residential units in the pipeline (including
     Executive Condominiums, or ECs), there were 26,426 units unsold,
     compared to 32,272 last year. At this rate, the supply overhang is
     expected to take about another three years to clear.

     Most of these are slated for completion in 2023 and 2024, which means
     that developers will need to start looking to replenish their land banks
     soon. As predicted in our Property Market Outlook 2021, we expect to
     see a soft en bloc season in 2021.

PropertyGuru Singapore Property Market Index Q1 2021
District Roundup
D25
D26
D23
D18
D22 D10 D8
D15
D2
Based on asking prices on PropertyGuru
Source: PropertyGuru
Top 5 Districts Bottom 5 Districts5 Best Performing Districts with Asking Price Growth
D25
D23
D10
D8
Based on asking prices on PropertyGuru D2
Source: PropertyGuru
Median Asking
District Areas QoQ change
Price (PSF)
Tanglin / Holland / Bukit
10 $2,455 2.51%
Timah
8 Farrer Park / Serangoon Rd $1,686 1.94%
25 Admiralty / Woodlands $796 1.78%
2 Chinatown / Tanjong Pagar $2,502 1.78%
Dairy Farm / Bukit Panjang /
23 $1,250 1.46%
Choa Chu Kang
PropertyGuru Singapore Property Market Index Q1 2021A district’s median asking price is
usually highly correlated with the
number of new launches in the
area. New launch projects are
priced higher, bringing the
median prices up. Additionally,
new launches in the area tend to
create a buzz, sparking renewed
interest in the district and
potentially helping to move resale
properties as well.
However, this did not seem the
case for most of 2020, likely due to
the developers’ cautious pricing of
new projects amid the economic
uncertainty.
In Q4, the top five districts
recorded minimal growth of
mostly under 2%. District 10, which
encompasses the Tanglin, Holland
and Bukit Timah areas, saw the
most significant QoQ increase in
asking prices (2.51%).
District 8 (Farrer Park, Serangoon
Road) is the only repeat
contender on this list, recording a
1.94% increase, which seems tame
in comparison with the 4.66%
QoQ increase last quarter.
PropertyGuru Singapore Property Market Index Q1 20215 Districts with the Highest Asking Price Declines
D26
D18
D22
D15
Based on asking prices on PropertyGuru
Source: PropertyGuru
District Areas Median Asking Price QoQ change
(PSF)
18 Pasir Ris / Tampines $1,154 -1.02%
15 East Coast / Marine $1,792 -1.52%
Parade
6 City Hall / Clarke Quay $2,948 -2.01%
22 Boon Lay / Jurong / Tuas $1,149 -4.70%
26 Mandai / Upper Thomson $1,079 -11.8%
PropertyGuru Singapore Property Market Index Q1 2021The bottom five districts are typically those that see little to no
activity due to a lack of new launches and/or interest. In this case,
District 22 (Boon Lay, Jurong, Tuas) and District 26 (Mandai, Upper
Thomson) are good examples.
Surprisingly, popular districts 18 (Pasir Ris, Tampines) and 15 (East
Coast, Marine Parade) recorded some of the highest price declines of
1.02% and 1.52% respectively.
That’s not to say that these areas are no longer in demand though –
it is likely that prices are simply normalising after the previous years’
hype. Prices in those districts rose in 2019 when popular launches like
Amber Park had more inventory and choice units.
There continues to be activity in District 18, thanks to the strong
continued sales of Treasure at Tampines. However, as the project is
one of the most affordable private properties in the market, it is not
expected to hold prices up.
PropertyGuru Singapore Property Market Index Q1 2021The Stars:
Top 10 Best-selling Condos
Ranking by Units Sold
Project Name District Region
units sold in Q4
1 Clavon 471 5 Clementi OCR
Ki Residences at
2 168 21 Sunset Way OCR
Brookvale
Treasure at
3 129 18 Tampines OCR
Tampines
The Linq @ Beauty Upper Bukit
4 120 21 OCR
World Timah
The Garden
5 119 19 Serangoon OCR
Residences
6 Parc Clematis 111 5 Clementi OCR
7 The Landmark 109 3 Tiong Bahru RCR
8 Jadescape 80 20 Bishan RCR
Forett At Bukit
9 75 21 Bukit Timah OCR
Timah
10 Piermont Grand 71 19 Punggol OCR
Source: PropertyGuru & URA
D19
D20 D18
D21
D5
D3
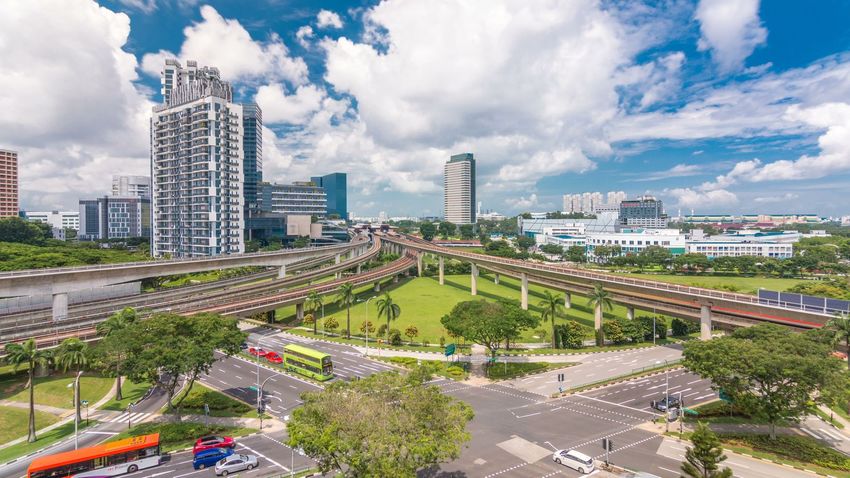
PropertyGuru Singapore Property Market Index Q1 2021The best-selling project of the quarter was Clavon at Clementi, selling
70% of its units on launch day and a total of 471 units in the quarter.
Clavon was the best performing project in 2020 as well.
Located in Clementi, Clavon is appealing to both new upgraders and
investors. It is situated just out of the city center, so it is reasonably
accessible yet carries the affordable Outside Central Region (OCR)
price tag. What’s more, Clavon is jointly developed by UOL Venture
Investment Private Ltd and United Industrial Corporation (UIC) Homes
Private Ltd, two leading developers in Singapore.
Clavon Ki Residences Treasure
at Brookvale at Tampines
Coming in second is Ki Residences at Sunset Way, selling 168 units in
the quarter. Ki Residences was yet another highly anticipated project
due to the lack of launches in the area. Although not yet considered a
luxury development, the buying demographic of Ki Residences is
wealthier then that of the mass-market Clavon.
PropertyGuru Singapore Property Market Index Q1 2021For example, agents have observed wealthy parents living in the
prime Bukit Timah area buying units at Ki Residences as legacy
properties for their children.
The same can be said for The Linq @ Beauty World and Forett at
Bukit Timah, which are also mid to high-end projects in west
Singapore.
A noteworthy entry into this list is Piermont Grand, an EC that
launched back in July 2019. With the soaring HDB resale flat prices
and a growing trend of Cash Over Valuation (COV) transactions, the
price disparity between HDB resale flats and ECs is narrowing,
possibly explaining the renewed interest in Piermont Grand.
Furthermore, the nearby Twin Waterfalls EC recently reached its MOP
and entered the resale market. Buyers are likely to compare the two
and find Piermont Grand to be more value for money.
The Linq @ Beauty World Parc Clematis Forett At Bukit Timah
The Landmark
The Garden Residences Jadescape Piermont Grand
PropertyGuru Singapore Property Market Index Q1 2021Rising Stars: Condos and
Districts to Watch
District 2 and 7
Chinatown, Tanjong Pagar
Beach Road, Bugis, Rochor
The areas in and around the Central Business
District are increasingly popular. This quarter,
District 2 (Chinatown, Tanjong Pagar) saw a 1.78%
rise in median asking prices. We expect this to
increase further with the launch of the upcoming
One Bernam. Nearby, District 7 (Beach Road, Bugis,
Rochor) saw a slight dip in prices (-0.935%) this
quarter, but this trend is likely to change once the
highly anticipated Midtown Modern is launched.
District 9
Orchard, River Valley
Although the CCR was performing
poorly in the early months of 2020,
interest in the prime District 9
(Orchard, River Valley) seems to be
picking up. In Q4, median asking prices
grew by 0.704%, while transaction
prices rose by 3.2% QoQ. There are
fewer new launches in District 9 District 5
(compared to suburban districts), but Buona Vista,
we can look forward to The Atelier in West Coast,
the coming months. Clementi New Town
We expect increased activity in
District 5 (Buona Vista, West Coast,
Clementi New Town). This quarter,
Clavon launched in Clementi and
prices rose by 1.22% QoQ. With
Normanton Park and One North Eden
also launching in the same district,
prices are likely to continue upwards.
PropertyGuru Singapore Property Market Index Q1 2021Conclusion
Despite economic uncertainties, the Singapore property market is still
going strong with surprisingly resilient demand and growing buyer
confidence.
The local COVID-19 situation seems well under control, with
community cases still in the single-digit range even during the festive
season. Vaccines have also reached our shores and immunisation for
frontline workers and vulnerable citizens has already begun. With
such encouraging progress, it is no wonder the market sentiment
remains optimistic.
Judging from the performance of early 2021 new launches such as
Normanton Park and The Reef at King’s Dock, the buying frenzy
shows no signs of slowing down in 2021.
While this is encouraging, the sustainability of these trends is a key
concern. With four Government Budget announcements and relief
measures like mortgage moratoriums, the past year was
characterised by pandemic aid that helped keep many afloat. But
with the possibility of tighter property curbs and as the economic
stimulus tapers off in the coming months, whether such resilience will
continue remains to be seen.
PropertyGuru Singapore Property Market Index Q1 2021About This Report Buying a home is one of the most difficult decisions of our lives. It is also likely to be the most expensive decision. When committing to a home purchase, it is important to be equipped with relevant and sufficient information so that the decision can be made confidently. PropertyGuru wants to simplify this process for property seekers, including first- time homebuyers and existing homeowners who might be looking into buying their second or third properties. In that vein, we created this report to help Singaporeans understand the movement of the property market better, so that property buyers can gain greater insight on current price trends that are in line with market sentiments, and to try to time their property purchases better. As a leader in the real estate market in Singapore, PropertyGuru processes a vast amount of real estate data daily, providing us with the necessary data to crunch, and deliver in-depth insights to all Singaporean home seekers. In this report, we look at pricing and supply indices of private residential properties in Singapore, in various locations, and across different property types, to provide a comprehensive overview of property market dynamics across the city-state. Methodology Using a range of statistical techniques, the data from over 200,000 private home listings on PropertyGuru Singapore are aggregated and indexed, demonstrating the movement of supply-side pricing. The PropertyGuru Singapore Property Market Index shows seller optimism and indicates the price level that developers and homeowners feel that they can fetch for their respective properties. An increase in the Property Market Index (PMI) may demonstrate buoyancy of sentiment while a decrease may indicate a moderation of expectations. The SPPI is indexed using Q4 2016 as the Base Quarter. The index was previously (2019) computed using Q1 2015 as the Base Quarter. We complement the price levels with a view on supply volumes in the market through the number of property listings on PropertyGuru Singapore. Our supply volumes not only take into account residential resale supply, but also new launch supply in Singapore.
About PropertyGuru Singapore
   PropertyGuru.com.sg was launched in 2007 and
   revolutionised the Singapore property market by taking
   it online and making property search transparent for
   the property seeker. For the last 13 years,
   PropertyGuru.com.sg has been helping people in
   Singapore make confident property decisions. With over
   8 million monthly visits* and 75%** consumer market
   share, PropertyGuru is the No.1 destination for Singapore
   home seekers to find, finance, and own their dream
   home. The company is part of PropertyGuru Group, Asia’s
   leading property technology company.

   For more information about PropertyGuru
   Singapore, please visit PropertyGuru.com.sg.

   About PropertyGuru Group
   PropertyGuru Group is Southeast Asia’s leading property
   technology company and the preferred destination for
   35 million property seekers to find their dream home,
   every month. PropertyGuru and its group companies
   empower property seekers with the widest option of
   more than 2.8 million homes, in-depth insights, and
   solutions that enable them to make confident property
   decisions across Singapore, Malaysia, Thailand,
   Indonesia, and Vietnam.

   Over the decade, the Group has grown from a
   regional property   media   powerhouse      to   a
   high-growth technology company with a robust
   portfolio of No.1 property portals across its core
   markets; award-winning mobile apps; best-in-class
   developer sales enablement platform, FastKey;
   mortgage marketplace PropertyGuru Finance; and
   a host of industry-leading property offerings
   including Awards, events and publications across
   Asia.

   For more information, please visit
   PropertyGuruGroup.com;
   linkedin.com/company/propertyguru
   *Source – Google Analytics data, Jul-Dec 2020
   **Source - SimilarWeb - Relative Engagement Market Share,
   average of Jul-Dec 2020

PropertyGuru Singapore Property Market Index Q4 2020
PropertyGuru Group
REG PropertyGuruGroup.com | Asia.PropertyAwards.com
    AsiaRealEstateSummit.com
SG PropertyGuru.com.sg | CommercialGuru.com.sg
MY PropertyGuru.com.my
ID  Rumah.com | RumahDijual.com
TH DDproperty.com
VN Batdongsan.com.vn

Contact
For media or press enquiries, or to understand more about the
PropertyGuru’s Singapore Property Market Index Q1 2021, please email
mediaenquiry@propertyguru.com.sg.

With Thanks
Special thanks to Dr. Tan Tee Khoon and real estate agent leaders Grace
Cheong, Jason Tan and Justin Kwek for their contributions to the
PropertyGuru Singapore Property Market Index Q1 2021.

Disclaimer
This publication has been prepared for general guidance on matters of
interest only, and does not constitute professional advice. You should not act
upon the information contained in this publication without obtaining specific
professional advice. No representation or warranty (express or implied) is
given as to the accuracy or completeness of the information contained in this
publication, and, to the extent permitted by law, PropertyGuru Group does
not accept or assume any liability, responsibility or duty of care for any
consequences of you or anyone else acting, or refraining to act, in reliance on
the information contained in this publication or for any decision based on it.
You can also read