INVESTMENTNEWSLETTER MARKET REVIEW 2020: LOOKING BACK ON AN UNPRECEDENTED YEAR - FirstCapital Bank ...
←
→
Page content transcription
If your browser does not render page correctly, please read the page content below
OB S F I NANCIAL | F E BR U AR Y 2021

INVESTMENTNEWSLETTER
                                                                          The fluctuating markets in the spring and summer
                                                                          were also a lesson in how markets incorporate new
                                                                          information and changes in expectations.

MARKET REVIEW 2020: LOOKING BACK
ON AN UNPRECEDENTED YEAR
                                    JANUARY 06, 2021 | Dimensional Fund Advisors

    The year 2020 proved to be one of the most tumultuous in modern history, marked by a number of
    developments that were historically unprecedented. But the year also demonstrated the resilience of people,
    institutions, and financial markets.

    The novel coronavirus was already in the news early in the year, and concerns grew as more countries began
    reporting their first cases of COVID-19. Infections multiplied around the world through February, and by early
    March, when the outbreak was labeled a pandemic, it was clear that the crisis would afect nearly every area
    of our lives. The spring would see a spike in cases and a global economic contraction as people stayed closer
    to home, and another surge of infections would come during the summer. Governments and central banks
    worked to cushion the blow, providing financial support for individuals and businesses and adjusting lending
    rates.

                                                                                      One major theme of the year was
    On top of the health crisis, there was widespread civil unrest over               the perceived disconnect between
    the summer in the US tied to policing and racial justice. In August,              markets and the economy.
    Americans increasingly focused on the US presidential race in this
    unusual year. Politicians, supporters, and voting oficials wrestled with the challenges of a campaign that at
    times was conducted virtually and with an election in the fall that would include a heightened level of mail-
    in and early voting. In the end, the results of the election would be disputed well into December. As autumn
    turned to winter, 2020 would end with both troubling and hopeful news: yet another spike in COVID-19 cases,
    along with the first deliveries of vaccines in the US and elsewhere.

    For investors, the year was characterized by sharp swings for stocks. March saw the S&P 500 Index’s1 decline
    reach 33.79% from the previous high as the pandemic worsened. This was followed by a rally in April, and
    stocks reached their previous highs by August. Ultimately, despite a sequence of epic events and continued
    concerns over the pandemic, global stock market returns in 2020 were above their historical norm. The US
    market finished the year in record territory and with an 18.40% annual return for the S&P 500 Index. Non-
    US developed markets, as measured by the MSCI World ex USA Index,2 returned 7.59%. Emerging markets,
    as measured by the MSCI Emerging Markets Index,
    returned 18.31% for the year.

1    Investment Newsletter | February 2021                                                          For general public use.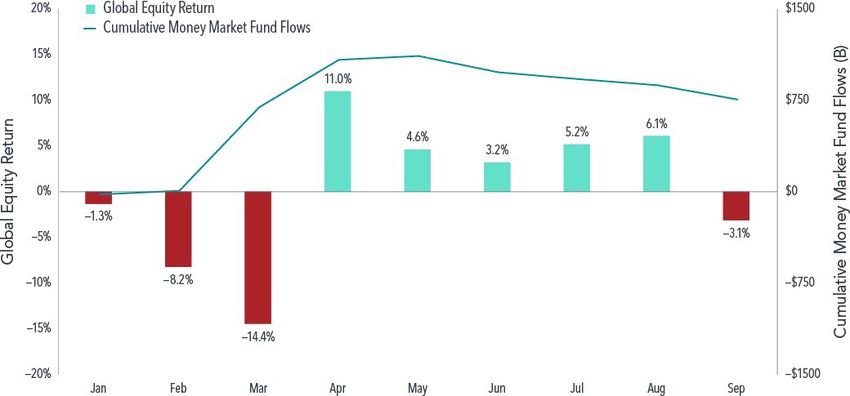
Exhibit 1
Highs and Lows
MSCI All Country World
Index with selected
headlines from 2020
Past performance is no
guarantee of future results.
In US dollars, net dividends.
MSCI data © MSCI 2021,
all rights reserved. Indices
are not available for direct
investment. Index returns
are not representative of
actual portfolios and do
not reflect costs and fees
associated with an actual
investment.
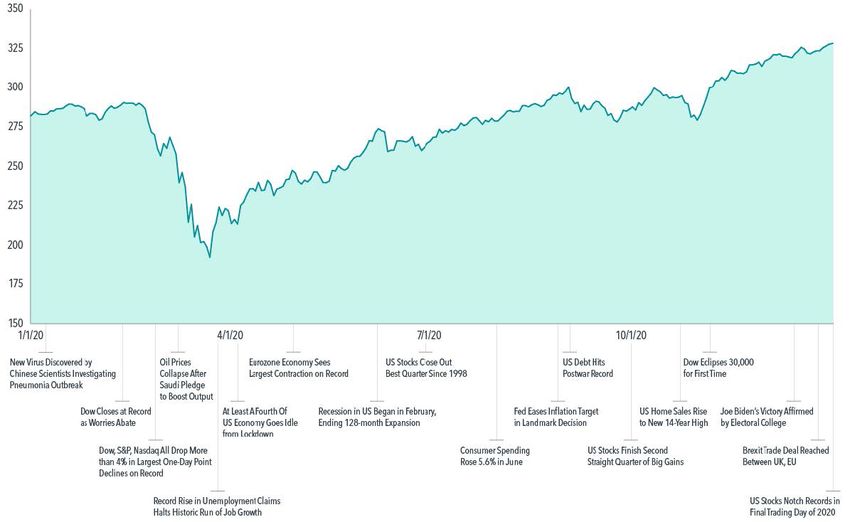
Fixed income markets mirrored the extremity of equity behavior, with nearly unprecedented dispersion in
returns during the first half of 2020. For example, in the first quarter, US corporate bonds underperformed US
Treasuries by more than 11%, the most negative quarterly return diference in data going back a half century.
But they soon swapped places: the second quarter was the second-most positive one on record for corporates
over Treasuries, with a 7.74% advantage.3 Large return deviations were also observed between US and non-US
fixed income as well as between inflation-protected and nominal bonds.
Global yield curves finished the year generally lower than at the start. US Treasury yields, for example, fell
across the board, with drops of more than 1% on the short and intermediate portions of the curve.4 The US
Treasury curve ended relatively flat in the short-term segment but upwardly sloped from the intermediate- to
long-term segment. For 2020, the Bloomberg Barclays Global Aggregate Bond Index5 returned 5.58%.
Exhibit 2
Sharp Shifts
US Credit minus US
Treasury: Quarterly
Returns, March 1973–
December 2020
Past performance is no guarantee of future results. In US dollars. US credit represented by the Bloomberg
Barclays US Credit Bond Index. US Treasuries represented by the Bloomberg Barclays US Treasury Bond
Index. Bloomberg Barclays data provided by Bloomberg. Indices are not available for direct investment.
Index returns are not representative of actual portfolios and do not reflect costs and fees associated with
an actual investment.
2 Investment Newsletter | February 2021 For general public use.
Uncertainty remains about the pandemic and the broad impact of the new vaccines, continued lockdowns,
    and social distancing. But the events of 2020 provided investors with many lessons, afirming that following a
    disciplined and broadly diversified investment approach is a reliable way to pursue long-term investment goals.

    MARKET PRICES QUICKLY REFLECT NEW INFORMATION ABOUT THE FUTURE
    The fluctuating markets in the spring and summer were also a lesson in how markets incorporate new
    information and changes in expectations. From its peak on February 19, 2020, the S&P 500 Index fell 33.79%
    in less than five weeks as the news headlines suggested more extreme outcomes from the pandemic. But the
    recovery would be swif as well. Market participants were watching for news that would provide insights into
    the pandemic and the economy, such as daily infection and mortality rates, efective therapeutic treatments,
    and the potential for vaccine development. As more information became available, the S&P 500 Index jumped
    17.57% from its March 23 low in just three trading sessions, one of the fastest snapbacks on record. This period
    highlighted the vital role of data in setting market expectations and underscored how quickly prices adjust to
    new information.

    One major theme of the year was the perceived disconnect between markets and the economy. How could
    the equity markets recover and reach new highs when the economic news remained so bleak? The market’s
    behavior suggests investors were looking past the short-term impact of the pandemic to assess the expected
    rebound of business activity and an eventual return to more-normal conditions. Seen through that lens, the
    rebound in share prices reflected a market that is always looking ahead, incorporating both current news and
    expectations of the future into stock prices.

    OWNING THE WINNERS AND LOSERS
    The 2020 economy and market also underscored the importance of staying broadly diversified across
    companies and industries. The downturn in stocks impacted some segments of the market more than others
    in ways that were consistent with the impact of the COVID-19 pandemic on certain types of businesses or
    industries. For example, airline, hospitality, and retail industries tended to sufer disproportionately with people
    around the world staying at home, whereas companies in communications, online shopping, and technology
    emerged as relative winners during the crisis. However, predicting at the beginning of 2020 exactly how this
    might play out would likely have proved challenging.

    In the end, the economic turmoil inflicted great hardship on some firms while creating economic and social
    conditions that provided growth opportunities for other companies. In any market, there will be winners and
    losers—and investors have historically been well served by owning a broad range of companies rather than
    trying to pick winners and losers.

    STICKING WITH YOUR PLAN
    Many news reports rightly emphasized the unprecedented nature of the health crisis, the emergency financial
    actions, and other extraordinary events during 2020. The year saw many “firsts”—and subsequent years will
    doubtless usher in many more. Yet 2020’s outcomes remind us that a consistent investment approach is a
    reliable path regardless of the market events we encounter. Investors who made moves by reacting to the

3    Investment Newsletter | February 2021                                                      For general public use.
moment may have missed opportunities. In March, spooked investors fled the stock and bond markets, as
money-market funds experienced net flows for the month totaling $684 billion. Then, over the six-month period
from April 1 to September 30, global equities and fixed income returned 29.54% and 3.16%, respectively. A
move to cash in March may have been a costly decision for anxious investors.
Exhibit 3
Cash Concerns in
2020
MSCI All Country World
Index with selected
headlines from 2020
Past performance is no guarantee of future results. In US dollars. Global equity returns is the MSCI
All Country World IMI Index (net div.). MSCI data © MSCI 2021, all rights reserved. Money market fund
flows provided by Morningstar. Indices are not available for direct investment. Index returns are not
representative of actual portfolios and do not reflect costs and fees associated with an actual investment
It was important for investors to avoid reacting to the dispersion in performance between asset classes, too,
lest they miss out on turnarounds from early in the year to later. For example, small cap stocks on the whole
fared better in the second half of the year than the first. The stark diference in performance between the first
and second quarters across bond classes also drives home this point.
A WELCOME TURN OF THE CALENDAR
Moving into 2021, many questions remain about the pandemic, new vaccines, business activity, changes in
how people work and socialize, and the direction of global markets. Yet 2020’s economic and market tumult
demonstrated that markets continue to function and that people can adapt to dificult circumstances.
The year’s positive equity and fixed income returns remind that, with a solid investment approach and a
commitment to staying the course, investors can focus on building long-term wealth, even in challenging
times.
1. S&P data © 2021 S&P Dow Jones Indices LLC, a division of S&P Global. All rights reserved. Indices are not available for direct investment.
2. MSCI data © MSCI 2021, all rights reserved. Indices are not available for direct investment.
3. US corporate bonds represented by the Bloomberg Barclays US Credit Bond Index. US Treasuries represented by the Bloomberg Barclays
US Treasury Bond Index. Bloomberg Barclays data provided by Bloomberg. Indices are not available for direct investment.
4. ICE BofA government yield. ICE BofA index data © 2021 ICE Data Indices, LLC.
5. Bloomberg Barclays data provided by Bloomberg. All rights reserved. Indices are not available for direct investment
4 Investment Newsletter | February 2021 For general public use.TESLA’S CHARGE REVEALS WEAK POINTS
OF INDEXING
JANUARY 15, 2021 | Morningstar
Index additions and deletions are typically a routine afair, but the recent announcement by S&P that Tesla
would be added to the widely tracked S&P 500 Index stirred up quite a lot of attention. No surprise, given that
Tesla is the largest company to ever join the index and, at the time of its
addition on December 18, 2020, became the sixth-largest company in the Who receives care, who provides
it, the economic cost, and the
S&P 500. On news of the announcement on November 16, Tesla’s stock price devastating efects of COVID-19.
jumped 8.2% from $408.09 to $441.61. As shown in Exhibit 1, Tesla then
continued to post strong returns, closing December 18 up 70.3% since the announcement. That made the 2.3%
return to the S&P 500 Index1 over that period look meager by comparison.
Exhibit 1
Joy Ride
Past performance is no
guarantee of future results.
Notes: Stock price data
from Bloomberg L.P. Time
indicated is US Eastern
time. Intraday price equal
to (bid price plus ask
price)/2, calculated by
Dimensional using data
from Refinitiv Tick History
(TRTH).
While Tesla’s stock price wowed investors ahead of the company’s addition to the S&P 500, the pattern quickly
reversed: the stock climbed 13.9% over the five days ending with its index addition on December 18 yet
slumped 4.8% over the subsequent week.2
What does this mean for investors? The answer, unsurprisingly, is that it depends.
5 Investment Newsletter | February 2021 For general public use.Indices generally undergo regular reconstitution events during which securities are added or deleted. Index
funds, constrained by the objective of maintaining low tracking error versus the index, generally have to mirror
these changes by purchasing and selling securities based on the revised index weights. With over $4.6 trillion in
assets tracking the S&P 500 as of year-end 2019, that implies many index funds sought to buy Tesla stock on the
day it was oficially added to the index.3
For passively managed index funds, this lack of flexibility can come at a cost. One way to assess this potential
cost is to examine the extent to which index reconstitution events are associated with unusually high trading
volume. Abnormally high trading volume is a potential indication that demanding immediacy to trade in such
stocks in the same direction may be costly. We illustrate such abnormal trading volume in Exhibit 2, which
compares trading volume in stocks added to or deleted from the S&P 500 on reconstitution day with trading
volume in the same stock on days before and afer the reconstitution day across reconstitution events over
the 2015–2019 period. For the 40 days before and afer reconstitution day, we present the average volume
for rebalanced stocks as a multiple of the stocks’ volume on the day 40 days prior to reconstitution. If trading
volume on reconstitution day is abnormally high for a rebalanced stock, it would lead to an increase in its
multiple of volume traded on reconstitution day relative to non- reconstitution days. Indeed, averaging the
volume ratios across all events over the five- year period, we find that trading volume for rebalanced stocks
spikes more than 25 times relative to volume over the prior 40 days.4
Exhibit 2
Order of the Day
Abnormal Trading Vol-
ume in S&P 500 Index,
2015–2019
Notes: Equal-weighted average daily trading volume multiples for S&P 500 Index additions and deletions
over the most recent five-year period, from 2015 through 2019. The security level trade volume multiple
is based on the ratio of observed daily volume levels over the event horizon relative to the observed daily
volume 40 days prior to the reconstitution date.
Demanding such unusually large trade volume can result in price pressure. But this price pressure does not
have to manifest itself all on the day of reconstitution. At Dimensional, we believe market prices are forward-
looking. Thus, because index rebalances are announced before the reconstitution date and ofen anticipated
before the announcement date, an approach that is constrained to rebalance on the same day as an index
may sufer from price pressure well ahead of the reconstitution date. Indeed, our research shows that stocks
added to an index tend to outperform their respective indices prior to rebalancing, while stocks deleted from
an index tend to underperform.
The remarkable upward march of Tesla’s stock price ahead of its addition to the S&P 500 is consistent with that
pattern.
6 Investment Newsletter | February 2021 For general public use.More broadly, we see in Exhibit 3 that the prices of additions (deletions) start to move higher (lower) than
those of their index peers one month before the reconstitution day for the S&P 500.5 This behavior suggests
pricing adjustments may be occurring well before the reconstitution day for those indices.
Exhibit 3
Running Start
Start Average
Cumulative Excess
Return of S&P 500
Additions and Deletions,
2015–2019
Notes: Daily excess returns are calculated as the equal-weighted average of individual security returns
minus the respective index returns. The cumulative excess return for day t+i is calculated as the sum of the
daily equal-weighted average excess return from t–22 for S&P, where t+0 is the reconstitution date.
The reconstitution efect is one example showing the lack of flexibility of an index approach, which can leave
returns on the table. While some of these costs can be mitigated by trading on a diferent date or spreading
trading over a few days, we believe an even better approach would be a daily process that maintains a
consistent focus on stocks with higher expected returns and spreads turnover across the entire year, with
flexibility at the point of trade execution across stocks and quantity. Such an approach allows investors to
incorporate information about liquidity and trading costs and avoid the cost of demanding immediacy from the
market. A daily investment process also allows for the incorporation of short-term information about expected
returns that is relevant over days or months, such as momentum and information from securities lending fees.
Such short-term information cannot be incorporated eficiently if rebalancing happens only once or twice per
year. In addition, daily portfolio management can further enhance investment outcomes by maintaining a
consistent and accurate focus on the desired long-term drivers of expected returns and continuously balancing
tradeofs between premiums, costs, and diversification.
1. S&P data © 2021 S&P Dow Jones Indices LLC, a division of S&P Global. All rights reserved.
2. Stock return over the week prior to index addition is from Friday, December 14, 2020, to Friday, December 18, 2020. Stock return over the
following week is from Friday, December 18, to Thursday, December 24. Data are from Bloomberg LP, compiled by Dimensional.
3. Total assets indexed to S&P indices is from Annual Survey of Assets published by S&P Dow Jones Indices, as of December 31, 2019.
4. Reconstitution events for S&P indices sometimes fall on triple-witching dates, or days on which stock index futures, stock index options,
and stock options all expire simultaneously. We examine reconstitution events outside of normal rebalancing dates, and therefore on
days that do not overlap with triple-witching dates, and find that stocks added to or deleted from the S&P 500 Index still experience, on
average, trading volume 26 times greater on the date of rebalancing relative to the trading volume 40 days earlier.
5. The initial increase in the gray deletion line is primarily driven by ENSCO PLC, which was dropped from the S&P 500 Index on March 29,
2016, due to an international merger. See “Ensco plc and Rowan Companies plc Merge to Form Ensco Rowan plc, Industry- Leading
Ofshore Driller,” Business Wire, April 11, 2019.
7 Investment Newsletter | February 2021 For general public use.Source: Dimensional Fund Advisors LP
The information in this document is provided in good faith without any warranty and is intended for the recipient’s background
information only. It does not constitute investment advice, recommendation, or an ofer of any services or products for sale and is not
intended to provide a suficient basis on which to make an investment decision. It is the responsibility of any persons wishing to make a
purchase to inform themselves of and observe all applicable laws and regulations. Unauthorized copying, reproducing, duplicating, or
transmitting of this document are strictly prohibited. Dimensional accepts no responsibility for loss arising from the use of the information
contained herein.
“Dimensional” refers to the Dimensional separate but afiliated entities generally, rather than to one particular entity. These entities are
Dimensional Fund Advisors LP, Dimensional Fund Advisors Ltd., Dimensional Ireland Limited, DFA Australia Limited, Dimensional Fund
Advisors Canada ULC, Dimensional Fund Advisors Pte. Ltd, Dimensional Japan Ltd., and Dimensional Hong Kong Limited. Dimensional
Hong Kong Limited is licensed by the Securities and Futures Commission to conduct Type 1 (dealing in securities) regulated activities only
and does not provide asset management services.
Dimensional Fund Advisors LP is an investment advisor registered with the Securities and Exchange Commission.
RISKS
Investments involve risks. The investment return and principal value of an investment may fluctuate so that an investor’s shares, when
redeemed, may be worth more or less than their original value. Past performance is not a guarantee of future results. There is no guarantee
strategies will be successful.
8 Investment Newsletter | February 2021 For general public use.Investment Update is published monthly by OBS Financial. All articles provided by
Dimensional Fund Advisors, Morningstar, or OBS Financial. Information has been
obtained from sources believed to be reliable, but its accuracy and completeness,
and the opinions based thereon, are not guaranteed and no responsibility is
assumed for errors and omissions. Nothing in this publication should be deemed
as individual investment advice. Consult your personal financial adviser and
investment prospectus before making an investment decision. Any performance
data published herein are not predictive of future performance. Investors should
always be aware that past performance has not been shown to predict the future.
If in doubt about the tax or legal consequences of an investment decision it is
best to consult a qualified expert. OBS Financial Services, Inc. is an investment
adviser registered with the Securities and Exchange Commission and is an
affiliate of AssetMark, Inc.
101828 | C21-17200 | 01/2021 | EXP 01/30/2022
CONTACT US 419 482 4500 | Marketing@obsmail.com | www.obsfs.com
9 Investment Newsletter | February 2021 For general public use.You can also read