RESOURCE-ADAPTIVE 3D MAPS FOR LOCATION BASED SERVICES
←
→
Page content transcription
If your browser does not render page correctly, please read the page content below
Session I                                                                         The Third Dimension

RESOURCE-ADAPTIVE 3D MAPS FOR LOCATION BASED SERVICES

Volker Coors

Fraunhofer Institut for Computer Graphics
Germany

ABSTRACT
       In this paper, we present a database driven approach for managing and visualizing 3D
       urban city models and related multimedia content. Such a 3D database is a core
       component of a 3D Cadastre system (Coors 2002a). In the TellMaris project (IST 2000-
       28249, www.tellmaris.com), we will make use of the 3D database to generate 3D maps.

       The objective of TellMaris is the development of a generic 3D-map interface to tourist
       information on mobile computers. The interface provides a new concept for creating value
       added information services on mobile computers for the European citizens related to
       geographical information. The interface is in the project used for accessing tourist
       information relevant for boat tourism in the Baltic Sea and Aegean Sea area in the
       Mediterranean.

       In this paper we focus on the online generation and compression of 3D-maps in order to
       make use of these maps in a mobile enviroment.

INTRODUCTION

Location Based Services (LBS) provide services which assist the user in finding his way in an
unfamiliar environment. Typical applications of such LBS are:
    • City guides showing sights and events
    • „Find my nearest“: search of hotels, restaureants, service stations
    • “Friend Finder”: friends or like-minded people nearby?
    • Road description / routing
Many of these services are already realized and made available by internet-based geo-
information services. The identification of the user’s position via cell phone or PDA,
however, brings about new requirements on information processing. Investigations of Chewar
und McCrickard (2002) prove, e.g., that conventional 2-dimensional maps are rather
unsuitable for dynamic road descriptions taking into account the actual position of the user.
Another essential criterion is given – in spite of an increasing bandwidth in the mobile
Internet – by suited strategies for data transfer, especially the reduction of the data amount to
be transmitted.
In the following, a project for the development of LBS for Darmstadt based upon the product
‚Location Server‘ of the IntelliWhere company is presented showing the state of the art in the
field of Location Based Services. On this basis, methods for the generation of 3-dimensional

© UDMS 2002                                                                                       I.29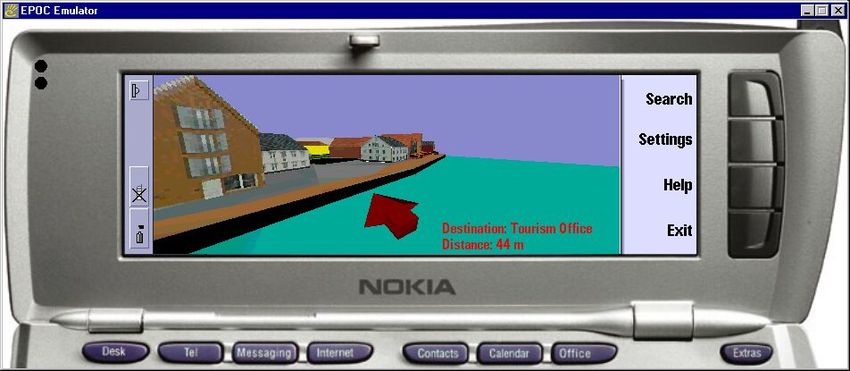
Session I                                                                     The Third Dimension

maps for LBS are commented. A special compression system has been developed for the
transfer of these 3D maps reducing the data volume by 95 per cent.

STATE OF THE ART

Numerous providers are presently developing so-called Location Services offering a great
number of basic services for LBS applications. These solutions often base upon existing GIS
tools and complement missing functionality. In order to grant the interoperability of the
different solutions the Open GIS Consortium started the OpenLSTM initiative. In the
following we specify both the basic services for LBS and the XML-based interfaces.
Three main areas are identified:
    • Mobile client services as an interface to the functionality of the location services, for
        the map design, and as localization service
    • Location services representing the proper basic functionality of the LBS applications,
        typically routing and geo-coding
    • Warehouse services as database of the location services
A model routing plan is used to illustrate the main components. By means of an XML request
a user calls for a road description from A to B. The route server calculates the desired route in
a road network including intermediate stations, if needed. Different optimization criteria like
shortest way, low-traffic roads, etc. can be applied. Depending on the respective provider
different optimization parameters are supported.
After specifying the starting point and the destination by address, a decoder is needed to
transform the addresses into coordinates, so-called locations. Especially for LBS not only
addresses can be decoded but also phone numbers so that you can find, e.g., a restaurant of
which you only have the phone number.
As a result, the route server presents a textual and graphic road description. Using a map
server, a map can be generated now containing this road description (see example in fig. 1).
The application has been developed within the „Darmstadt Mobil“ project (http://www.da-
mobil.de) using the Location Server of IntelliWhere (http://www.intelliWhere.com).
The map server is GeoMediaWebProfessional developed by Intergraph
(http://www.intergraph.com/gis/geomedia/).

              Figure 1: Routing example: textual and graphic road description.

© UDMS 2002                                                                                  I.30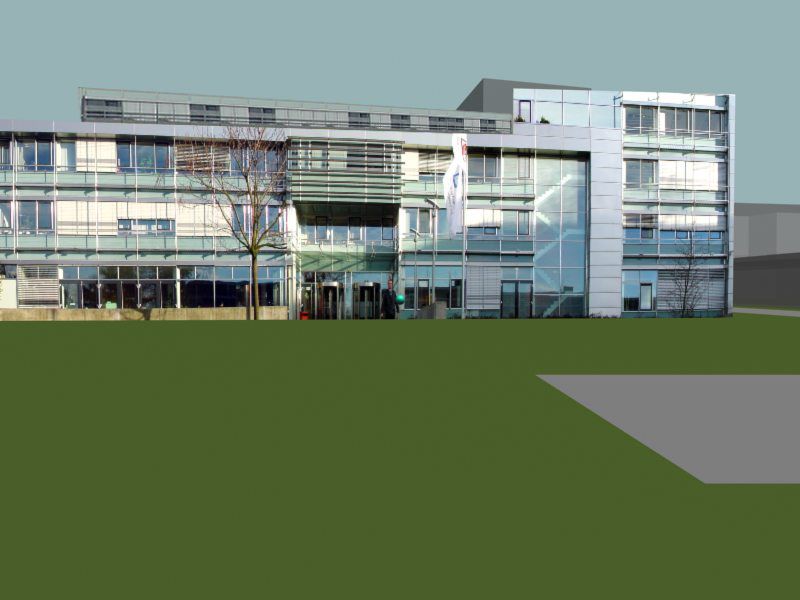
Session I The Third Dimension
The conventional two-dimensional map, however, is not optimal for road description in a
mobile application (Chewar und McCrickard 2002). Therefore, an approach for the generation
of three-dimensional road descriptions is presented in the following. The step into the third
dimension is of additional value especially in a mobile application, enabling a realistic
representation on the spot and, thereby, a much better visual search for navigation landmarks.
GENERATION OF THREE-DIMENSIONAL MAPS
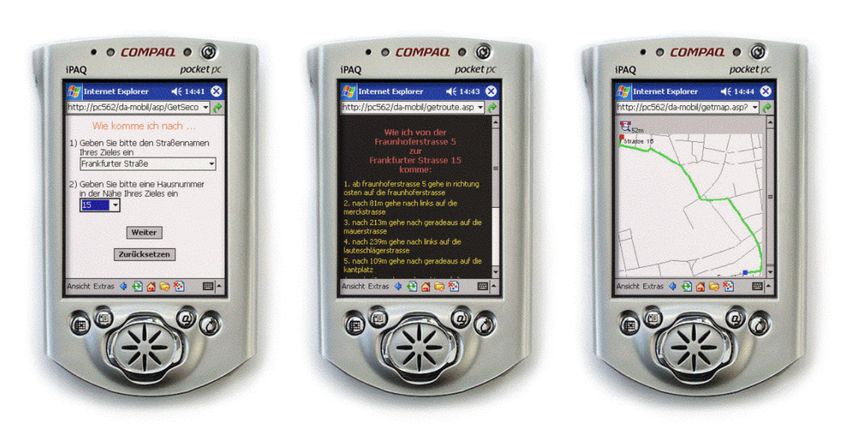
As a result of the the progressing technological development the use of three-dimensional city
models on mobile terminals will be possible in the near future. Viewers for three-dimensional
data already exist, e.g. PocketCortona of ParallelGraphics (http://www.parallelgraphics.com)
and 3D Viewer of IBM) (http://www.research.ibm.com/vgc/pdaviewer/pdaviewer.html). A
Java based 3D graphics API for mobiel devices is under development
(http://www.jcp.org/jsr/detail/184.jsp).The presently low visualization performance will be
significantly improved following the rapid development in the range of graphic processors,
exceeding even the Moore principle (see http://www.gup.uni-linz.ac.at/skps/slides/moore/).
Figure 2: 3D models with Nokia GL on the Communicator 9210. Picture kindly provided by
Nokia Research Center, Finland.
The data basis neccessary for three-dimensional city information systems is delivered by the
construction and the continuation of 3D city models presently performed by different cities
(e.g. Stuttgart, Hamburg, and Berlin).
To make these three-dimensional city models available in the location-based services context
the location and warehouse services must be able to process three-dimensional data and make
them accessible from a mobile terminal. In the following the concept for the generation of
three-dimensional data for LBS applications is presented. Then, in the next chapter, a
compression method is drafted which efficiently compresses the 3D maps generated by the
map server and, thereby, also makes available in mobile communication networks.
Graphic abstraction
For the preparation of three-dimensional maps similar principles are true as for the design of
conventional maps. The three-diemensional visualization has a model character, i.e. the shown
objects of the real world shall be represented in a geometrically correct way and in the right
© UDMS 2002 I.31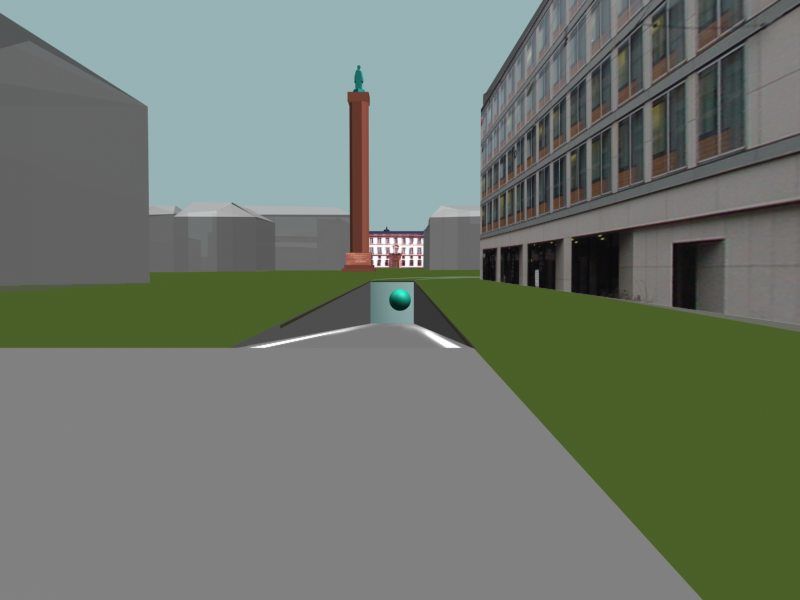
Session I                                                                     The Third Dimension

position. Furthermore, the visualization as a means of communication demands an adequate
degree of readability. This results in the following basic demands (similar to those applicable
in cartography):
    • Geometrically exact design
    • Keep the important, leave the unimportant.
    • Emphasize the characteristic, exclude the fortuitous.
    • Objects must have a minimum size to be visually perceptible.
    • The graphic refinement must come up to the needs.
    • The graphic density must not be too high.
These principles are partly contradictory. E.g., a geometrically exact representation of all
geographic objects of a city model on a standard display automatically leads to a high graphic
density. The graphic differenciation of single objects is then nearly impossible.
This problem with three-dimensional maps shall be solved by using a graphic abstraction.
Unlike the carthographic generalization, an interactive three-dimensional visualization allows
a directed refinement of the model. Thus the graphic abstraction in an interactive system has
no absolute scale. In this connection we must also take into account that a model refinement
resp. a scale modification is possibly done via network. In this case, adequate techniques are
necessary to avoid long waiting times. On the other hand, the destination of the user can be
identified, because the visualization always follows a concrete request, e.g. a routing from A
to B. This user destination should be allowed for in the graphic abstraction. Similar
requirements can also be found in other applications of graphic abstraction like the technical
documentation (Krüger 2000).

Concept for an automated graphic abstraction

A three-dimensional map aims at giving information to the user, i.e. the map content shall be
visualized according to a thematic focus. This thematic focus must be derivable from the
preceding dialog with the user
To prepare a graphic abstraction according to the given thematic focus the contribution of the
different features within this focus must be specified. It must be decided for each feature how
important it is for achieving the conrete information goal. If you want to visualize a route
starting point and destination are of special importance. But also eyecatching buildings are
very helpful as visual landmarks, especially when the direction is changed, and should be
accentuated in the representation. Additional buildings can sometimes deliver a helpful
context, but they can also confuse and distract from the original aim of the navigation support.
One approach for assessment is a classification of the respective objects into foreground
objects, which are in the thematic focus and therefore of special importance for the graphic
representation, and background objects, which are not within the thematic focus. This
approach has been used, among others, by Andre for the generation of multimedia
presentations (Andre 1995).

To specify the abstraction level we relate in our work to each feature a dominance value,
similar to the approach of Hartmann et al. (1999), reflecting the ranking of this feature in the
communication of the request result. For a better handling, these dominance values can be
classified into the four representation classes identifiable, classifiable , discriminable und
visible according to Krüger (Krüger 2000). A dominance function relates to each feature a
dominance value depending on the particular request:

© UDMS 2002                                                                                  I.32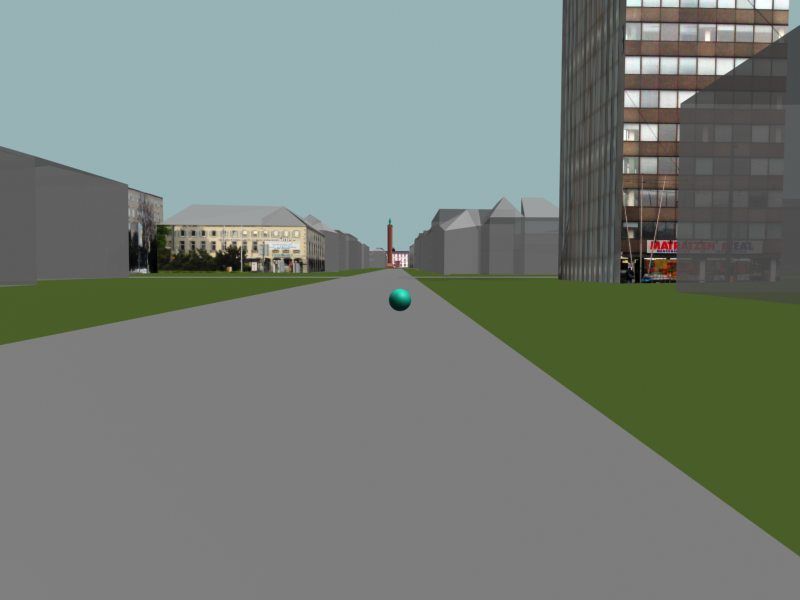
Session I                                                                       The Third Dimension

Calculating the dominance value

One influence factor of the dominance value is the relevance of a feature concerning a user
specific query. This relevance factor is calculated based on the approach of Keim and Kriegel,
(1994). First, the distance between an attribute and the corresponding query values is
calculated for each feature. The distance functions used in this step are data-type and
application dependent. For number types such as integer or real and other metric types such as
date, we can determine the distance of two values easily by their numerical difference. For
nonmetric types such as enumeration with a noninterpretable distance between values (ordinal
types such as grades) or with noncomparable values (nominal types such as profession), there
is no obvious way to determine the distance. For ordinal types, the distance might be defined
by some domain-specific distance function or by a distance matrix containing the distances of
all pairs of values. A distance matrix can also be useful for nominal types, but even a constant
value can be an adequate distance in some cases. Spatial data has a metrical distance.
However, in most queries just a topological distance like adjancy or inclusion is of interest.
More formal, the distance d between an attribute pm of a feature m and the corresponding
query value pq is given by an attribute specific distance function dist(pq,pm). The distance of a
query q and a feature m is than given by a distance vector d=(d0, d 1, ..., dn)T where d i =
dist(pqi,pmi) denotes the distance of the i-th feature attribute and the corresponding query
value.

The next step combines the independently calculated distances to the relative importance rf of
the feature f. This is highly user dependent. Only user interaction can solve this because only
the user can determine the priority of the selection. Therefore, the user must provide
weighting factors w j, representing the user specific importance of the different query
parameters:

However, not only the query dependend relevance factor influences the dominance domf of a
feature. Other factors are the use of f as a reference object in the specific query and the general
function as a landmark in the environment. The dominance of a feature is composed by three
components, the relevance factor R(Query, User), the use of a feature as a reference object
O(Query) while posing a query, and the general use of this feature as a landmark L(User) .
Again these three influence factors can be weighted using the parameters a0, a1, and a2.

COMPRESSION OF 3D MAPS

Third generation mobile communication networks (UMTS) will have a bandwidth of 384
Kbit/s in urban areas (Quadt 2002). However, the high data volume of a 3D-Map will be
critical even in high bandwidth wireless networks. A three-dimensional model with 100.000
triangles will lead to a 3 MB VRML file. Transmitting this data via UMTS will last about 60
seconds. A standard compression algorithm like gzip reduces the data volume to 1 MB and
transmission time to 20s. Still, 20s is a long time to wait for a normal user. Algorithms that
are specialized on 3D meshes achieve a compression rate about 95%. A 100.000 triangle

© UDMS 2002                                                                                    I.33
Session I                                                                                The Third Dimension

model can be compressed down to 180 KB. Transmission of this compressed file will take
less than 4 seconds.

Triangle meshes

Triangle meshes are the de facto standard for exchanging and viewing 3D data sets. This trend
is reinforced by the wide spread of 3D graphic libraries (OpenGL, VRML) and other 3D data
exchange file formats, and of 3D adapters for personal computers that have been optimized
for triangles. A triangle mesh is usually stored as a list of coordinates (vertex list) and a list of
triangles that reference to these coordinates (connectivity). Figure 3 shows a VRML
representation of a triangle mesh. A complex three-dimensional model wit n vertices has
about 2n triangles. 18 Byte per triangle are needed to store vertex list and geometry plus
additional cost for texture mapping and color information.

                                                            In VRML 97:

                                                            IndexedFaceSet {
                                                            # Geometry (Verices)
                                                              coord Coordinate {
                                                                point [ x1 y1 z1
                                                                         x2 y2 z2
                                                                         x3 y3 z3
                                                                         x4 y4 z4
                                                                         x5 y5 z5
                                                                         x6 y6 z6 ]
                                                                ]
                                                              }
                                                              # Connectivity
                                                              CoordIndex [0 1 5 -1
                                                                              0 5 4 -1
                                                                           1 2 6 -1
                                                                           1 6 5 -1
                                                                ]
                                                            }

                       Figure 3: VRML representation of a triangle mesh.

Delphi compression of triangular meshes

The triangle mesh compression technique Delphi developed by Coors and Rossignac (2002)
is based on the Edgebreaker algorithm (Rossignac 1999 und Rossignac et al. 2001).
Edgebreaker uses a state machine to traverse the mesh and compress it’s connectivity. The
succession of case types produced by this traversal are encoded as a succession of symbols
from the set {C,L,E,R,S}, called the clers string or clers-sequence. For zero-genus meshes,
the clers string is sufficient to represent the complete connectivity. These situations and the
associated clers symbols are shown in
Figure 4. The arrow indicates the direction to the next triangle. Previously visited triangles are
not shown. At each state the state machine moves from a triangle Y to an adjacent triangle X.
It marks all visited triangles and their bounding vertices. Let Left and Right denote the other
two triangles that are incident upon X. Let v be the vertex common to X, Left, and Right. If v

© UDMS 2002                                                                                             I.34
Session I The Third Dimension
has not yet been visited, then neither have Left and Right. This is case C. If v has been visited,
we distinguish four other cases, which corresponds to four situations where one, both, or
neither of the Left and Right triangles have been visited. Note that in the S case, Edgebreaker
moves to the right, using a recursive call, and then to the left.
v v v R
T T T R R
X
L
X
C X
R E
L C L
v v R
S
T T
E
R
X X
E
C
S
Figure 4: Mesh traversal in Edgebreaker creates a CLERS-sequence.
The popularity of Edgebreaker lies in the fact that all descriptors are symbols from the set
{C,L,E,R,S}. No other parameter is needed. Because half of the descriptors are Cs, a trivial
code (C=0, L=110, E=111, R=101, S=100) guarantees 2 bits per triangle.
In Delphi, both compression and decompression perform the same geometric prediction of the
location of the tip-vertex of the next triangle. They estimate the triangle connectivity by
snapping the tip-vertex to the nearest boundary vertex, if one lies sufficiently close. If the
guess is correct, only a confirmation bit needs to be transmitted. Because up to 97% of
Dephi's guesses are correct, connectivity information is often compressed to a fraction of a bit
per triangle. Experiemental results lead to a compression rate up to 0.2 Bit per triangle for
regular meshes. A detailed explanation of Delphi compression is given in Coors and
Rossignac (2002).
RESULTS
The use of dominance values will be illustrated by a three-dimensional map of a route. The
route itself, for example the way from the railwaystation to the Fraunhofer Institute of
Computer Graphics in Darmstadt, will be calculated by a routing server component. All
buildings along that route will be derived from the database by a query and will get a
relevance rf =0. All other features do not match that query and get a relevance rf =1 (not
relevant). Start and endpoint of the route are reference objects O in that example. All
prominent features like the castle of Darmstadt and conspicuous building along the route are
landmarks L. In route visualization landmarks are very important for visual navigation. The
parameters ai can be used to model this situation by choosing a0Session I The Third Dimension
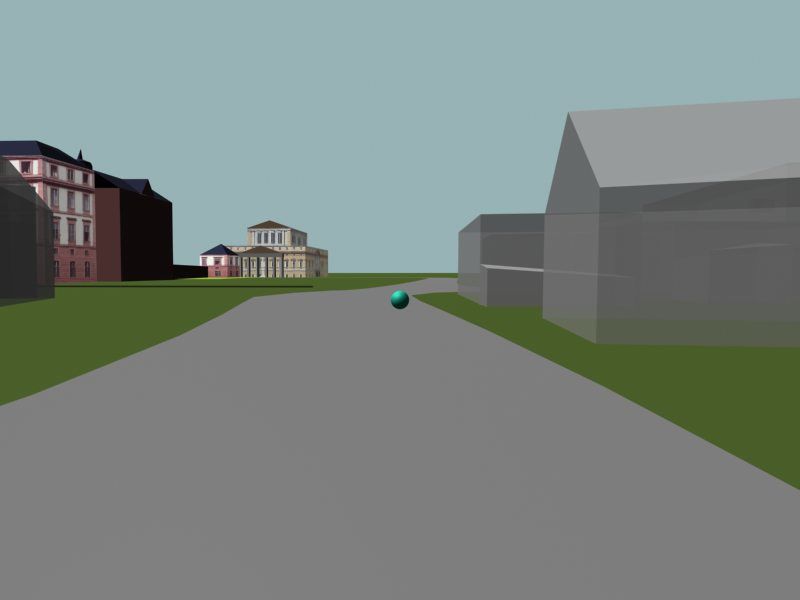
Figure 5: Some sequences of a 3D-route map to Fraunhofer Institute of Computer Graphics.
Navigational landmarks are visualized in detail with textured models to attract the
user’s focus while buildings with less dominance are shows in grey-scale and semi-
transparent rendering style.
A typical building with a saddleroof and rectangular floorplan in our 3D city database (Coors
2002a) has about 10 vertices and 16 triangles. Experimental results with this database show
that a typical building needs about 20 Bit to store connectivity using Delphi compression.
Vertices are stored with 12 Bit per coordinate using quantization. Summing up about 50 Byte
are needed to store a typical building. The complete model of a city has about 20.000
individual buildings. This model can be compressed up to 1 MB data volume. For route
visualization in general there is only a need for a small part of the city model. A typical route
visualization nedds less than 1.000 buildings. As a result, necessary data for route
visualization can be compressed down to 50 KB for building geometry and can be transferred
in 1-2 seconds in third generation mobile networks.
ACKNOWLEDGEMENTS
The work was funded by the Klaus-Tschira Stiftung (KTS) as part of the VisualMap project, and the
EU-Project TellMaris (IST-2000-28249). Special thanks to Prof. Jarek Rossignac, Georgia Insitute of
Technologie, Atlanta, USA for a deep insight to 3D mesh compression.
© UDMS 2002 I.36Session I The Third Dimension
REFERENCES
André, E. (1995): Ein planbasierter Ansatz zur Generierung multimedialer Präsentationen, DISKI 108,
infix, 1995 (in german).
Chewar, C.M. und McCrickard, D.S. (2002): Dynamic Route Descriptions: Tradeoffs by Usage Goals
and User Characteristics, 2nd International Symposium on Smart Graphics, Hawthorne, New
York, USA, ACM Press, 2002
Coors, V. (2002a): 3D-GIS in Networking Environments, Special Issue of CEUS on 3D Cadastre
(accepted for publication), 2002
Coors, V. (2002b): Resource-adaptive interactive 3D maps, 2nd International Symposium on Smart
Graphics, Hawthorne, New York, USA, ACM Press, 2002
Coors, V. und Rossignac, J. (2002): Guess Connectivity: Delphi Encoding in Edgebreaker, GATech
Techincal Report, 2002
Hartmann et al (1999): Interaction and Focus: Towards a Coherent Degree of Detail in Graphics,
Captions and Text. In: Lorenz, P. and Deussen, O. (Eds), Simulation and Visualization ‘99,
SCS-Society for Computer Simulation Int., Erlangen, 1999.
Keim, D.A. und Kriegel, H.P. (1994): VisDB: Database Exploration Using Multidimensional
Visualization, Computer Graphics & Applications Journal 1994.
Krüger, A. (2000): Automatische Abstraktion in 3D-Graphiken, Dissertationen zur Künstlichen
Intelligenz, Bd 232, Akad. Verl.-Ge. Aka 2000 (in german)
Quadt, H.P. (2002): UMTS Neue Dienste der III. Mobilfunkgeneration, UMTS Workshop, Fraunhofer
Institut für Graphische Datenverarbeitung, Darmstadt, Mai 2002
Rossignac, J. (1999): Edgebreaker: Connectivity compression for triangle meshes, IEEE Transactions
on Visualization and Computer Graphics, 5(1), 47-61, Jan-Mar 1999. (Sigma Xi award: Best
Paper from Georgia Tech.)
Rossignac, J. et al (2001): 3D Compression Made Simple: Edgebreaker on a Corner-Table, Invited
lecture at the Shape Modeling International Conference, Gemoa, Italy, May 2001.
CV OF THE AUTHOR
Volker Coors graduted from TU Darmstadt with a diploma in Computer Science. Since 1997 he is
working as a researcher at Fraunhofer Insitute for Computer Graphics. From December 2000 until
May 2001 he hold a DAAD scholarship at Georgia Institute of Technology, Atlanta, USA, where he
has been working on 3D compression with Prof. Jarek Rossignac.
CO-ORDINATES
Volker Coors
Fraunhofer Institute for Computer Graphics
Rundeturmstr. 6
D-64283 Darmstadt
Germany
Tel. +49 (0)6151 155406
Fax: +49 (0)6151 155444
E-mail Volker.Coors@igd.fhg.de
Website www.tellmaris.com
© UDMS 2002 I.37Session I The Third Dimension © UDMS 2002 I.38
You can also read