Assimilation of IASI at the Met Office and assessment of its impact through observing system experiments
←
→
Page content transcription
If your browser does not render page correctly, please read the page content below
Assimilation of IASI at the Met Office and assessment of its
       impact through observing system experiments

                             F. Hilton and N.C. Atkinson

                  Met Office, FitzRoy Road, Exeter EX1 3PB, UK

Data from the Infrared Atmospheric Sounding Interferometer (IASI) onboard MetOp has been
assimilated at the Met Office in both Global and North Atlantic and European (NAE) model
configurations since November 2007. It has been a considerable challenge to reduce data
volumes to a manageable level within the constraints of the forecast system and this paper
will summarise the processing methodology employed.

Pre-operational trials of IASI assimilation in the Global model delivered a positive impact on
forecasts approximately twice as large as that shown by AIRS. A series of observing system
experiments confirms the relative performance of IASI and AIRS, and shows that impact
from IASI is equivalent to a single AMSU-A+MHS.

Analysis of a second season Global model IASI assimilation trial indicates that the
measurement of impact is strongly affected by variations in performance of the control
forecast. Furthermore, the impact of IASI is strongly dependent on the variables and methods
chosen for verification: although improvements to the large scale fields (e.g. mean sea-level
pressure and geopotential height) were also seen in the NAE configuration, no forecast impact
was seen for variables such as visibility and rain-rate.

1. Selection, preprocessing and assimilation of IASI data

Data selection

For a six-hour assimilation cycle, 324,000 IASI spectra each consisting of 8461 channels are
processed. This equates to 2.7x10⁹ channel observations per cycle, in comparison with
approximately 0.04x10⁹ channel observations for ATOVS data from five satellites. One of the
greatest difficulties in the use of IASI data is therefore to extract detailed atmospheric
information as efficiently as possible to enable assimilation within the current computing
constraints of our operational numerical weather prediction (NWP) system.

The approach taken to enable fast delivery of benefit from IASI was to perform spatial and
spectral reduction at the earliest possible opportunity in the data processing chain. The 8461
channels are reduced to 314 using the 300-channel selection proposed by Collard (2007) –
which selects the channels with the greatest information content for a variety of
meteorological situations – and adding in 14 extra monitoring channels chosen by the Centre
National d’Etudes Spatiales (CNES; Blumstein, pers. comm.). The observations are thinned
spatially to 1 pixel from 4 in each field of view using the IASI L1c AVHRR cluster
information to select the most homogeneous field of view. This is carried out in AAPP
(Atkinson et al., 2006) before data storage.
This spatial and spectral data reduction approach is a rather blunt instrument, but it is anticipated that in future we may be able to dispense with the spatial thinning and use principal component scores to compress information from the whole spectrum into a relatively few pieces of information which can be assimilated efficiently. Following data reduction, for the Global model, we process a maximum of 81,000 observations (0.025x10⁹ channel observations) for each six-hour assimilation cycle. These are further reduced to around 3,000 observations for assimilation through rejection of observations during preprocessing, details of which follow in the next section. For the NAE model, the data coverage is highly variable, but between 200 and 800 observations are typically assimilated in each six-hour 4D-Var cycle. Preprocessing Before assimilation, the IASI data are passed through a 1D-Var and quality control stage known as the Observation Processing System (OPS) where the observations are compared with forward-modelled atmospheric columns constructed from model fields. The process consists of several steps including bias correction, surface type assignment, cloud detection, channel selection and 1D-Var. At the Met Office a static bias correction scheme is used rather than variational bias correction. This correction consists of a different constant offset for each channel and each scan angle plus a linear function of the 850-300 hPa thickness and 200-50 hPa thickness, with different coefficients for each channel. The Met Office model has a land/sea mask and also a sea ice fraction which are used to assign a surface type to the observation. The model surface type is used in conjunction with a surface type determined from AMSU observations which are mapped to the IASI footprints in AAPP (English et al., 1997). The AMSU data is tested for consistency with eight different surface types and an optimal estimation method is used to match each observation to the best-fitting surface type. Four cloud detection tests are employed. The first two which are taken from Cheng et al. (2006) and are carried out in AAPP. The standard deviation of the four IASI pixels in one field of view at 2390 cm-1 is compared with NEΔT for the channel: if it is greater than 3x NEΔT the pixel is cloudy. The second test predicts IASI BT at 2390 cm-1 from AMSU 4, 5 and 6. If (AMSU – IASI) > 2K the pixel is cloudy. The third test also runs in AAPP and is a by-product of the AMSU surface type test mentioned above: if the fit to all possible surface types is poor, the pixel is declared “microwave cloudy”. The final infrared cloud test follows the Bayesian methodology of English et al. (1999): a cloud cost is computed taking into account information from the observation and the model profile and this cost function is tested in conjunction with a window channel observation-background (O-B) check at 810.25cm-1. No IASI data are assimilated where an infrared cloud test is failed. Not all of the 314 channels are used during preprocessing and assimilation. In OPS, channels in the 8μm ozone band, all channels in Band 3, and several other channels which seem to cause problems in the 1D-Var minimisation (for example, the very highest peaking channels)
are rejected. Only water vapour channels peaking below 520hPa (from their temperature
Jacobians for the US standard atmosphere) are used – this leaves 31 water vapour channels in
the minimisation. For observations over land or where the microwave cloud test is failed,
channels peaking below 400hPa (for the US standard atmosphere) which may be sensitive to
the surface emission are rejected. No water vapour channels are used over land. Figure 1
shows a typical IASI spectrum with the channels from the 314 set marked according to their
usage. 183 channels are used in 1D-Var. No IASI data are assimilated over sea ice.

Figure 1: 314 channel set marked on a typical IASI spectrum. Red lines mark the channels
used in all conditions; yellow lines mark channels used only in clear conditions over the sea.
Blue lines mark channels used in all conditions in OPS, but rejected in 4D-Var. Cyan, lime
and green channels are not used at all.

The radiative transfer model used to forward-model the atmospheric columns is RTTOV7
(Saunders et al., 2002) with coefficients based on kCARTA (Strow et al., 1998). In OPS, the
standard deviation of the observation errors are set to the instrument noise measured during
thermal vacuum testing (Phulpin, pers. comm.) plus 0.2K assumed forward model error.

Assimilation

Channels peaking above 50hPa are used in OPS but are not assimilated via 4D-Var because
the increments they generate exhibit stratospheric ringing. In total, 138 channels can be
assimilated depending on the cloud conditions and surface type (see Figure 1). The
observations are thinned to one in every 154km box to ensure that there are no correlations
between observations.
For 4D-Var, the errors are inflated in line with those for other radiance data to compensate for
lack of off-diagonal elements in the covariance matrix: the standard deviations of error are
inflated to 0.5K for the 15μm CO2 band, 1K for window channels and 4K for water vapour
channels. These values were chosen to maximise the weight given to IASI without allowing
the fit to other satellite sounders to deteriorate significantly. In particular, the large errors
assumed in the water vapour band help to compensate for lack of inclusion of any correlated
error.

2. Global Model Assimilation Trials

June 2007

A series of assimilation trials where IASI was included on top of the current operational
satellite data usage were run for the period 24th May – 24th June 2007. The trials tested
assimilation under a range of conditions: with and without water vapour channels; with 0.5K
and 1K observation errors for the temperature sounding channels; at different horizontal
resolutions; and with different model physics configurations.

Forecast impact at the Met Office is measured by use of a score called the NWP Index (see
Annex A for detail) which combines improvements in forecast skill in a number of
atmospheric parameters. Assuming one knows the persistence error perfectly (a reasonable
assumption in comparison with the forecast error), over a one-month trial where the impact is
reasonably consistent in time and across the components of the Index (also reasonable in this
case), using the standard error as a measure of forecast error, an improvement in the Index of
0.5 points is considered to be significant.

The results of all trials run were very consistently positive, and the inclusion of water vapour
channels and use of 0.5K observation errors for the temperature sounding channels produced
the largest positive impact of 1.2 points verified against observations and 0.8 points against
analyses – 1.0 points overall.

The largest impacts seen were in the tropical and northern hemisphere geopotential height
forecasts against analyses; and against observations in the wind fields and 500hPa height in
the tropics and southern hemisphere, and 500hPa height and PMSL in the northern
hemisphere. Figure 2 shows the improvement to the bias in the T+24 height forecast in the
southern hemisphere.

The NWP Index was improved for most days of the forecast trial period against both
observations and analyses except for a few days towards the end (Figure 3). Interestingly, the
impact of AIRS for this trial period was significantly less than IASI, 0.6 against observations
and 0.1 against analyses. Previous AIRS assimilation trials have shown overall impact of
about 0.5 Index points (Cameron et al., 2005; Hilton et al., 2006). It is likely that the larger
number of IASI channels employed and the greater weight given to the temperature sounding
channels of IASI contributed to this difference (AIRS is assimilated with a 1K error in the
15μm CO2 band).
The strong performance of IASI leading to marked improvements in forecast skill are
particularly impressive considering that IASI has been added to a system already assimilating
sounding data from ATOVS on three NOAA satellites and on MetOp (whose observations are
coincident with IASI), AIRS on EOS Aqua, and SSMIS on DMSP F16. This result suggests
that new information is being added by the assimilation of IASI. Bell et al. (2008) compare
humidity increments for IASI and SSMIS and show that using the 31 water vapour channels
that were tested in the trial, 1D-Var specific humidity increments from IASI span the
troposphere where SSMIS increments are concentrated in the lower troposphere.

Figure 2: Mean forecast error in geopotential height at T+24 for the southern hemisphere
verified against radiosondes. The red line is the control and the blue line is the IASI
assimilation trial.

Figure 3: Daily change in NWP Index for the June 2007 IASI assimilation trial. The black line
shows the running mean of the Index, which at the end of the period is the value of the Index
for the experiment. The left panel is verified against observations, the right against analyses.
December 2007 – January 2008

A second season of assimilation experiments was run for the period 12th December 2007 to
12th January 2008 after IASI assimilation became operational. The first of these removed
IASI data from the assimilation system. Removing IASI had negative impact, but not as
significant as over the summer period: a degradation of 0.4 verified against observations and
0.6 against analyses (0.5 overall).

A time series of the trial period (Figure 4) shows that whilst for the majority of days the
removal of IASI data degraded the forecast, forecasts verifying against observations on
December 29th showed an improvement from the removal of IASI data. The period from 30th
December to 8th January showed almost no impact from IASI. No investigation has been done
into why the forecasts for December 29th were degraded by assimilation of IASI, but further
observing system experiments indicate that the impact of other satellite radiance data types
was also reduced during the end of December and the beginning of January relative to the
first two weeks of the trial period.

Figure 4: Daily change in NWP Index for the December 2007 IASI assimilation trial. The
black line shows the running mean of the Index, which at the end of the period is the value of
the Index for the experiment. The left panel is verified against observations, the right against
analyses.

Although the positive impact seen from IASI assimilation was smaller for the winter period,
the verification of particular forecast parameters was broadly consistent between the two
periods (Figure 5) with the exception of the southern hemisphere 500hPa geopotential height
and short range PMSL, and tropical 850hPa winds at short forecast range.

The difference in NWP Index scores can be attributed to the way the forecasts are verified
and the change in performance of the control between the two periods. The skill scores used
to calculate the NWP Index compare the performance of the trial relative to persistence with
the performance of the control relative to persistence. In the northern hemisphere, persistence
is much poorer as a forecast during winter than summer, and the control therefore exhibits
much greater skill during the winter 2007 trial period (Figure 6). Although the reduction in
RMS error in the northern hemisphere from the assimilation of IASI is quite constant between
summer and winter trial periods, the reduction in RMS error of the control is an order of
magnitude larger.

Figure 5: Comparison of percentage change in forecast RMS error verified against
observations for June 2007 and December 2007 trial periods.

Figure 5 also indicates that during the summer trial IASI performed strongly for the 850hPa
wind forecasts in the tropics, variables to which the NWP index calculation is particularly
sensitive. Figure 6 shows that the skill of the control forecast was increased by 20-35% during
the winter trial period for the 850hPa wind forecasts (in this case the increased skill could not
be attributed to persistence being a poorer forecast in the winter period).

3. Global Model Observing System Experiments

A series of observing system experiments were run for a slightly shortened winter trial period
of 12th December 2007 to 4th January 2008 where individual satellite sounding instruments
were tested on top of a no-satellite-sounding baseline. Five experiments were run:

    •   No satellite sounding – AMSU, MHS, HIRS, AIRS, IASI and SSMIS excluded
    •   IASI only
    •   AIRS only
    •   MetOp AMSU-A+MHS only
    •   MetOp HIRS only

The verification of these trials was performed against observations only. Verifying against
radiosondes obviously has drawbacks, not least from the point of view of the spatial
variability of the network – in particular the sparseness of the verifying observations in the
southern hemisphere is of concern given that satellite data have traditionally shown greater
impact here but at least the verification is consistent across the experiments. Verifying against analyses would probably favour either the control or the experiment for such a data-poor experimental set up. Figure 6: Percentage change in weighted skill relative to persistence of the control runs used for IASI assimilation experiments in December and June: a positive value indicates that the December control showed more skill relative to persistence than the June control. Figure 7 shows the NWP index scores for this series of experiments. The no-satellite- sounding trial demonstrated a 4-point degradation. IASI provides about as much forecast impact as MetOp AMSU-A+MHS, restoring about half the skill of the whole system. AIRS and HIRS provide a smaller positive impact on the forecasts. Although each IASI observation has many more assimilated channels than each AMSU-A+MHS observation, the impact of the latter is enhanced by its ability to be used in cloudy areas, providing better global coverage and data in meteorologically active areas. The relative performance of AIRS and IASI has not been investigated but it is possible that the difference in impact results from the fact that around twice as many IASI channels are assimilated as AIRS channels, and the 15μm CO2 band channels on IASI are given twice as much weight. A time series of the daily Index change shows that in general the satellite sounding observations are all showing similar patterns of impact in terms of day-to-day variability (Figure 8). There is a reduction in the impact of the satellite data during the last few days in December and the first few days in January, as also seen in the experiment removing IASI from the full assimilation system.
Figure 7: Change in NWP Index verified against observations for addition of individual
satellite data sources over a no-satellite-sounding baseline. AMSU/MHS and HIRS are from
MetOp only.

Figure 8: Daily change in NWP Index verified against observations for addition of individual
satellite data sources over a no-satellite-sounding baseline. Red=IASI, Blue=AIRS,
Green=AMSU/MHS, Yellow=HIRS. AMSU/MHS and HIRS are from MetOp only.

It is extremely encouraging that assimilation of IASI in clear areas only is providing similar
forecast benefit to the assimilation of ATOVS data in both clear and cloudy conditions. The
relative performance of IASI and AIRS in the assimilation system demonstrates that more
information can be extracted from hyperspectral infrared sounders when data with low
radiometric noise are given appropriate weight in the assimilation system.
4. North Atlantic and European Model Assimilation Trial
An IASI assimilation trial for the period 24th May to 24th June was also run for the NAE
model configuration. Despite extremely positive results in the global model, IASI showed
neutral impact in the NAE, in common with previous satellite data assimilation trials for
AIRS (Hilton et al., 2006) and AMSU (Candy et al., 2003).
Verification for the NAE is very different from the global model. A UK NWP Index is
calculated from six weighted forecast variables: surface visibility, six hour precipitation
accumulations, total cloud amount, cloud base height, surface temperature and surface wind
verified against observations. Annex B describes the calculation of the UK Index.
Satellite radiances typically show little impact on these “weather” variables, despite providing
benefit in the upper air fields for the NAE model. Table 1 shows the change in scores for the
IASI trial for the largest and smallest verification domains, which showed respectively the
best and worst Index changes.
Full NAE Area UK Index List Area
Weighted ETS difference
Surface Visibility -0.016 0.032
6hr Precip Accum 0.032 0.035
Total Cloud Amount 0.000 -0.034
Cloud Base Height -0.011 -0.017
Weighted Skill difference
Surface Temp 0.013 -0.080
Surface Wind 0.022 0.031
Overall Change in Index 0.12% -0.08%
Table 1: Change in UK Index score components for the NAE model configuration IASI
assimilation trial. A change of about 0.3% overall would have been significant.
The highest impact (for the full NAE domain) was +0.12%. No objective significance testing
has been applied to this result. However, the operational change procedure at the Met Office
considers a change of 0.3% to be a small but significant impact, particularly if this impact was
shown to be consistent in time and across different verification areas. Therefore, whilst this is
a subjective significance test, 0.12% is unlikely to be a significant change.
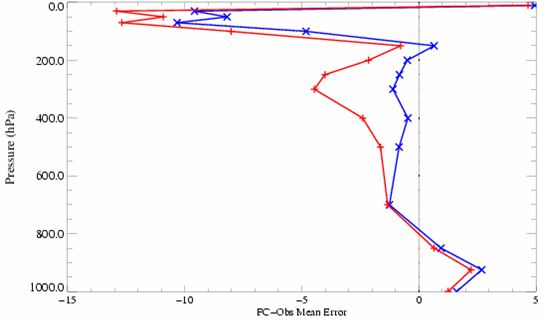
In contrast, Figure 9 shows the benefit of assimilation of IASI on the 1000hPa geopotential
height forecast: there are reductions in the forecast bias and RMS error at longer forecast
ranges. Other fields showing benefit from assimilation of IASI were relative humidity and
temperature below 500hPa; pressure at mean sea level and winds at 250hPa.
The verification results for the upper air and large-scale fields are in keeping with the results
from the global model trials. This suggests that the negligible impact seen when adding
satellite data into Met Office limited area models may be partly due to the way in which the
model is verified, but also that the improvements seen in the large-scale model fields are
disconnected from changes in the surface weather variables which make up the UK Index.Figure 9: Change in mean and RMS forecast error for 1000hPa geopotential height against forecast range verified over the old mesoscale model area. The red line is the control and the blue line is for the IASI assimilation trial. Other verification areas show similar benefit from IASI assimilation. 5. Conclusion Experiments have shown that assimilation of IASI in the Met Office Global model provides significant forecast benefit on top of a system which already makes use of ATOVS, AIRS and SSMIS data. Observing system experiments testing individual satellite instruments on top of a no-satellite-sounding baseline suggest that IASI provides a similar level of improvement in forecast skill to AMSU-A+MHS, and significantly more than current implementations of AIRS and HIRS. The benefit seen in the North Atlantic and European model is negligible for the forecast variables which are used for the verification of Met Office limited area models, suggesting that benefits in large-scale fields such as geopotential height and PMSL do not feed into surface weather variables. The considerable improvement in the global forecast was achieved with a simple assimilation scheme treating IASI in the same way as the previous generation of sounding instruments. There is much more information to be extracted from IASI, and future work will focus on using the spectral information more effectively to allow us to increase the amount of data assimilated and thus improve forecasts further. This could be through spectral compression, or using more channels over land and over cloud (Pavelin, 2006).
Acknowledgements

The authors are extremely grateful for the assistance of Andrew Collard (ECMWF), Steve
English, John Eyre, Roger Saunders, James Cameron and Brett Candy, for reviewing the
assimilation scheme and providing advice; Mike Thurlow, Mark Naylor and Adam Maycock
for assistance with testing and trialling of IASI assimilation and Pascal Brunel (Météo-
France) for provision of RTTOV-7 coefficient files.

References

Atkinson, N.C., P. Brunel, P. Marguinaud and T. Labrot, 2006: AAPP status report and
       preparations for processing MetOp data. Proceedings of ITSC-XV, Maratea, Italy, 4th-
       10th October 2006
Bell, W., F. Hilton, S.J. English, B. Candy, S. Swadley, 2008: A Comparison of IASI water
       vapour and SSMIS window channel impacts on NWP analyses and forecasts.
       Proceedings of ITSC-XVI, Angra dos Reis, Brazil, 7th-13th May 2008
Cameron, J., A. Collard, S. English, 2005: Operational Use of AIRS Observations at the Met
      Office. Proceedings of ITSC-XIV, Beijing, China, 25th-31st May 2005
Candy, B., S. English, R. Renshaw, B. MacPherson, 2003: Use of AMSU data in the UK Met
       Office Mesoscale Model. Proceedings of ITSC-XIII, Sainte Adele, Canada, 29th
       October-4th November 2003
Cheng, Z., L. Zhou, W. Wolf, T. King, H. Sun, C. Barnet, and M. Goldberg, 2006: The use of
       principal component analysis in processing simulated IASI data. Proceedings of
       ITSC-XV, Maratea, Italy, 4th-10th October 2006
Collard, A.D., 2007: Selection of IASI channels for use in Numerical Weather Prediction.
        Q.J.R. Meteorol. Soc., 133, 1977-1991
English, S.J., R.J. Renshaw, P.C. Dibben, and J.R. Eyre, 1997: The AAPP module for
        identifying precipitation, ice cloud, liquid water and surface type on the AMSU-A
        GRID. Proceedings of ITSC-IX, Igls, Austria, 20-26th February 1997
English, S.J., J.R. Eyre and J.A. Smith, 1999: A cloud-detection scheme for use with satellite
        sounding radiances in the context of data assimilation for numerical weather
        prediction. Q.J.R. Meteorol. Soc., 125, 2359-2387
Hilton, F., J. Cameron, S. English, E. Pavelin, S. Havemann, J. Taylor, W. Bell and T.R.
        Sreerekha, 2006: Current status and future plans for the use of AIRS and IASI data at
        the Met Office. Proceedings of ITSC-XV, Maratea, Italy, 4th-10th October 2006
Pavelin, E. and S. English, 2006: Plans for the assimilation of cloud- affected infrared
        soundings at the Met Office, Proceedings of ITSC-XV, Maratea, Italy, 4th-10th
        October 2006
Saunders, R.W., M. Matricardi, P. Brunel, S.J. English, and G. Deblonde, 2002. RTTOV-7: a
       satellite radiance simulator for the new millennium. Proceedings of the ITSC-XII,
       Lorne, Australia, 28th February – 5th March 2002
Strow, L.L, H.E. Motteler, R.G. Benson, S.E. Hannon, S. De Souza-Machado, 1998: Fast
computation of monochromatic infrared atmospheric transmittances using
compressed look-up tables. J. Quant. Spectrosc. Radiat. Transfer, 59, 481-493
Annex A: The Met Office Global NWP Index
In order to provide an objective global assessment of data assimilation or model changes the
Met Office uses a basket of forecast verification scores. Each score is weighted against its
perceived importance to create a global index. Whilst this index is not sufficient to judge any
change it can be a useful objective way to compare a number of changes without subjectively
selecting a particular verification score which favours one change above another. The index
has risen by 25% over 10 years so the importance of new changes can be judged against past
performance.
The Index is compiled from mean sea-level pressure (PMSL), 500 hPa height (H500), 850
hPa wind (W850) and 250 hPa wind (W250). It is verified over the following areas: Northern
Hemisphere 20N-90N (NH), Tropics 20N-20S (TR) and Southern Hemisphere 20S-90S (SH)
and at forecast ranges from T+24 to T+120. The weight given to each verification field is
shown in Table A.1. The change in weighted skill scores is measured using both conventional
observations and analyses as verification and the two results are averaged to give the NWP
Index.
The skill score is calculated from the forecast and persistence root mean square errors for
each combination of parameter, area and forecast range. This is defined in terms of reduction
of variance, i.e.
S = 1 – rf2/rp2
where rf is the RMS forecast error and rp is the RMS persistence error.
Forecast period
T+24 T+48 T+72 T+96 T+120
PMSL 10 8 6 4 4
NH H500 6 4 2
W250 12
W850 5 3 2
TR
W250 6
PMSL 5 4 3 2 2
SH H500 3 2 1
W250 6
Table A.1: Weights given to each forecast parameter in Met Office global NWP index.Annex B: The Met Office U.K. NWP Index
The UK index is based on forecasts of selected parameters currently out to 48 hours ahead for
a selected set of positions verified by comparison with station observations and is based on 36
months of data. A score is calculated for each parameter included in the Index. The individual
scores are then combined in a weighted average to form a single value.
The Index is compiled from the following parameters:
• Near-surface (1.5m) temperature
• Near-surface (10m) wind speed & direction
• Precipitation yes/no (equal to or greater than 0.2, 1.0 and 4.0 mm over the preceding
6 hours)
• Total cloud amount yes/no (equal to or greater than 2.5, 4.5 and 6.5 oktas)
• Cloud base height given at least 2.5 oktas yes/no (equal to or less than 100, 500 and
1000 m above ground)
• Near-surface visibility yes/no (equal to or less than 200, 1000 and 4000 m)
verified at quality controlled station positions across the UK and at the following forecast
ranges: T+6, T+12, T+18, T+24, T+30, T+36, T+42 and T+48
The UK Index is calculated verifying forecasts against observations from all the WMO Block
03 stations across the UK including the Channel Islands and the Isle of Man. This includes
Northern Ireland, but excludes the Republic of Ireland.
However, for experimental analysis, the index can be calculated over different domains,
typically: the full NAE model area, the old mesoscale model area (UK and Ireland), the
WMO Block 03 stations and the “UK Index List” – quality controlled radiosonde stations in
the UK. These domains are successively smaller in size and therefore each contains fewer
verification points, but also become successively more trustworthy in the quality of the data
used for verification.
Verification of temperature and wind
Temperature and wind forecast accuracy at each forecast range is measured using a skill score,
defined in terms of Reduction of Variance, i.e.
S = 1 – rf2/rp2
where rf is the RMS forecast error and rp is the RMS persistence error.
The smaller the ratio between forecast and persistence errors, the closer the skill score will be
to 1 (perfection). If the forecast error is greater (worse) than the persistence error, then the
skill score will be negative and is in fact unbounded.Verification of precipitation, total cloud amount, cloud base height and
visibility
The Equitable Threat Score is used as the basis for the precipitation, total cloud amount, cloud
base height and visibility components of the Index, the definition being:
ETS = (R – “chance”)/(T-“chance”)
Where R is the number of observed events which were correctly forecast and T is the total
number of events which were either observed or forecast. Subtraction of "chance" from the
numerator and denominator removes those observed events which are expected to be
correctly forecast by chance. It is given by:
“chance” = F * O / N
Where F is the number of events forecast, O is the number of events observed, N is the total
number of events plus non-events.
This score has properties similar to the rms-based score, i.e. it takes the value of 1 for a
perfect forecast, and is negative if the forecast is worse than chance, although in this case
there is a lower limit of -1/3.
Compilation of the Index
A simple weighted average, S, of all the individual scores (eight forecast ranges and six
variables (four of which have three thresholds) is calculated. The weighting factors are chosen
to give equal overall weighting to each of the 5 components (wind, temperature, precipitation,
cloud and visibility), so total cloud amount and cloud base height get lower individual
weighting than precipitation and visibility (Table B.1).
Threshold
None 1st 2nd 3rd
Temperature 6
Wind 6
Precipitation 2 2 2
Total Cloud Amount 1 1 1
Cloud Base Height 1 1 1
Visibility 2 2 2
Table B.1: Weights given to each forecast parameter in Met Office UK NWP index.You can also read