TWITTER BASED SENTIMENT ANALYSIS OF IMPACT OF COVID-19 ON EDUCATION GLOBALY
←
→
Page content transcription
If your browser does not render page correctly, please read the page content below
International Journal of Artificial Intelligence and Applications (IJAIA), Vol.12, No.3, May 2021

      TWITTER BASED SENTIMENT ANALYSIS OF
    IMPACT OF COVID-19 ON EDUCATION GLOBALY
                   Swetha Sree Cheeti, Yanyan Li and Ahmad Hadaegh

           California State University-San Marcos, San Marcos, California, USA

ABSTRACT
Education system has been gravely affected due to widespread of Covid-19 across the globe. In this paper
we present a thorough sentiment analysis of tweets related to education available on twitter platform and
deduce conclusions about its impact on people’s emotions as the pandemic advanced over the months.
Through twitter over ninety thousand tweets have been gathered related to the circumstances involving the
change in education system over the world. Using Natural language tool kit (NLTK) functionalities and
Naive Bayes Classifier a sentiment analysis has been performed on the gathered dataset. Based on the
results of this analysis we infer to exhibit the impact of covid-19 on education and how people’s sentiment
altered due to the changes with regard to the education system. Thus, we would like to present a better
understanding of people’s sentiment on education while trying to cope with the pandemic in such
unprecedented times.

KEYWORDS
Sentiment Analysis, Education, Covid-19, Tweets, Naïve Bayes Classifier.

1. INTRODUCTION
SARS-CoV-2 virus commonly known as Covid-19 has hit the entire world like never known
before and became a global threat. Education is the most basic and an important tool to improve
one’s life. As the world health organization (WHO) has declared Covid-19 as a pandemic, it
resulted in near total closure of schools, universities and colleges worldwide. These closures have
affected not only students, instructors, staff and, their families but also have a far reaching
economic and social consequences [1]. In such a distinctive time, as the world tries to heal and
cope, almost every educational organization has moved the education process to remote
functioning and virtual learning. Through online classes, using technology students and teachers
have been trying to continue the education through various practices as zoom meetings, sharing
online materials, recording lectures, power point tutorials and so on. Recent study says that about
1.52 billion learners are affected due to closure of schools, colleges and universities which has
shed light on many broader socio-economic issues like student debt, food insecurity, academic
integrity, homelessness, childcare, healthcare, housing, internet, digital learning and disability
services [1].

In this paper, we attempt to shed light on people’s sentiment about education during the global
rise of Covid-19. To do this, we use the data from the most extensively used social media
platform twitter. Data from social media has been used even in the past to monitor public
sentiments and communication during health emergencies [2]. Tweets related to education are
collected from twitter and then analyzed using a custom framework to predict the sentiment of
each tweet which would give insight about the tweeter sentiment. Based on these results we
determine to present a better supportive of people’s sentiment on education during the pandemic and
through this analysis we could observe and differentiate the level of positive and negative
DOI: 10.5121/ijaia.2021.12302                                                                            15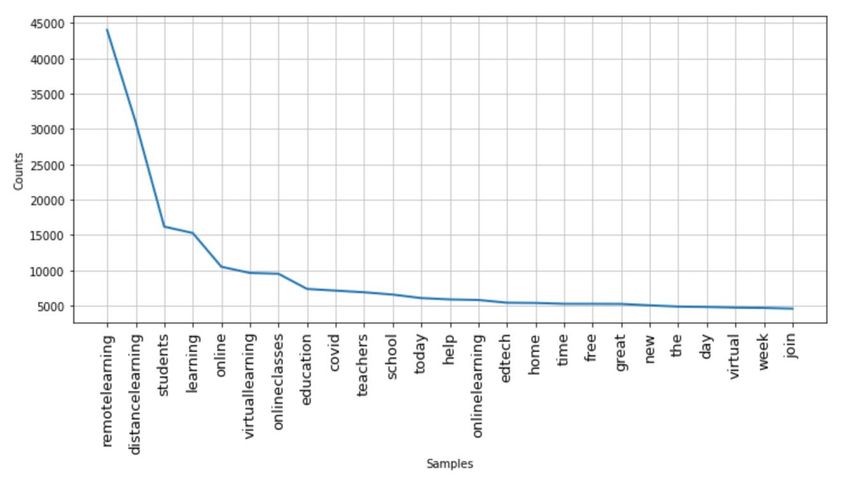
International Journal of Artificial Intelligence and Applications (IJAIA), Vol.12, No.3, May 2021
implications due to the shift in the education system. Observing which educators and institutions
can come up with better efficient ways which might be helpful to smoothen the process of
learning. We prospect that with the continuing growth of virtual education monitoring people’s
sentiment using our enhanced model could make a difference as there is always a scope for betterment
to provide the best quality of education in such overwhelming times.

2. BACKGROUND
Remote learning has become the new education lifeline and this primary change has an impact on
everyone but has more severe consequences for students and their families. To have a successful
virtual learning experience, a student should be able to access to a computer and reliable internet
which is not the case for every student as some are at a disadvantage of having none. Working
parents are at greater disadvantage of missing work hours in order to take care of children at
home which indirectly would result in wage loss. Many children across the world rely on schools
for free and discounted meals for such children nutrition is especially compromised [1]. Through
all these changes students are expected to pay full tuition fee to institutions which is unfair.
Learning outcomes cannot be the same with virtual learning as many organizations have to
postpone or cancel exams as going ahead with it would lead to violation of social distancing [3].
With many such drawbacks and disadvantages student learning, development and growth are at
stake.

Social media is an imperative part of almost every individual’s life and is widely used tool for
interactions among individuals in which they create, share, and exchange information, ideas and
views on topics. Among the social media platforms used today, Twitter is the broadly utilized
social media platform and recent study suggests that over 500 million tweets are tweeted each
day on twitter. We base our research on tweets collected through such extensively used platform
and hope to acquire an insight of people’s emotions on changes in education as most people do
express their opinions and discuss ongoing issues using social media these days. The data
collected through this platform would be useful to analyze, experiment and deduce results to
support our research.

3. RELATED WORK
Many studies have been conducted earlier using twitter data to predict the sentiment of people in
different expanses but to the best of our knowledge there hasn’t been a study on people
sentiment on education during the pandemic. There are distinctive ways proposed by several
researchers to evaluate the sentiments of people using social media. Many of those ways include
machine learning algorithms like Naïve Bayes, Max Entropy, Support Vector Machine and so on.

Using multinomial Naïve Bayes method with a training set of tweets that contains only
emoticons, Pak and Paroubek [4] presented a model that classifies tweets as positive or negative.
But since the training set knowledge is only based on tweets with emoticons, this approach was
less effective. Go and L. Huang [5] used both Naïve Bayes and SVM models to analyze twitter
data using distant supervision with emoticons in their training data to predict sentiment and
determined that SVM performed better. In Agarwal et al. [6] using a tree kernel model tweets are
represented as trees and are classified into positive, negative and neutral based on polarity of
words with their Part of Speech (POS) tags. A study on sentiment analysis of tweets during covid
in Nepal [7] has used python TextBlob library and classified tweets as positive or negative.

There are many different studies conducted to determine the sentiment of tweets, but we propose
an enhanced approach which doesn’t only rely on emoticons or POS of the tweets to classify a

                                                                                                        16
International Journal of Artificial Intelligence and Applications (IJAIA), Vol.12, No.3, May 2021
tweet as positive or negative sentiment which is explained in detail in the next section. Further
the accuracy attained through our framework also defines the effective performance of our model.
4. METHODOLOGY
The process to study the impact of covid-19 on education through sentiment analysis of twitter
data involves fetching tweets related to education from twitter and then applying Natural
language tool kit (NLTK) functionalities to clean the data and split the data into tokens for
accurate assessment. Later this modified data is passed through a designed framework for
analysis and is trained using Naive Bayes classifier to study each tweet and predict the sentiment
of the tweeter. A detailed explanation of steps involved in this research is given in the following
sections.
Fetching Pre- Training Testing
Twitter Data Processing
Data
• Collecting • Data Cleaning • Using Naïve • Using 80%
Tweets using NLTK Bayes data as
related to library Classifier training set
education functionalities data is and 20% data
from Twitter • Data Filtering trained to do as testing set
platform and sentiment accuracy of
during Covid- Tokenization analysis on the model is
19 pandemic gathered predicted
dataset
Figure 1. Shows the steps involved in the methodology
4.1. Fetching Twitter Data
The primary step is to gather the required data through extensively used social media platform
Twitter. From mid-March almost every educational organization moved to remote functioning.
So, based on that change, we gathered tweets from the months of March to July of the year 2020
for this study. To gather the data of this timeline, we used a customized get old tweets (GOT3)
API from GitHub repository which uses URLlib to retrieve tweets from the twitter search engine
as twitter API doesn’t give free access to its data which is older than a week. We used certain
specific keywords to query the twitter dataset which are observed as being generally used by
people in their tweets to express their views about education. The keywords used are Online-
Classes, Virtual-Learning, Remote-Learning, Zoom-Classes and Distance-Learning. To avoid
fetching tweets with text, which is not in English language, we have used Google’s language
detection library in Python named as langdetect and specified the preferred language as English
[8]. Through the months of March to July, we have collected tweets from non-consecutive
randomly chosen six dates of each month so that we could certainly identify the difference in
public sentiments through each month from time to time. For every six days of a month, we have
collected about minimum of 15 thousand tweets. Thus, we have a dataset of 91 thousand tweets
from the months of March 2020 to July 2020. Having such a large dataset would help us gain
better analysis.
4.2. Pre-Processing the Data
The data gathered in the above step contains raw tweets from twitter in which tweeters use
different symbols, images, emoticons and links attached to their text message to express and
support their context. Normally these raw tweets would have user handles, URL links, image
17International Journal of Artificial Intelligence and Applications (IJAIA), Vol.12, No.3, May 2021
links, punctuation marks, alpha numerals, numbers, emojis and other unnecessary symbols
included with the text message [9]. Since tweets with such unnecessary links and symbols could
bother the analysis procedure and affect the accuracy of the model, the data should be thoroughly
cleaned. Using the “re” library of python we have performed data cleaning. After cleaning the
data utilizing the functionalities of NLTK library data filtering and tokenization is done. Data
filtering process involves removal of stop words such as prepositions and conjunctions from a
tweet and tokenization is a process of splitting a tweet into tokens i.e., individual words [10].
Hence, raw tweets gathered are refined and each tweet is transformed into tokens which could be
further passed for training procedure.
Table 1: Shows pre-processing of data with sample tweets
Raw tweets Clean tweets Tokenized tweets
Yes indeed. A4: Moreover, Yes indeed Moreover we should be in 'indeed', 'Moreover',
we should be in contact with contact with our students parents to supply 'contact', 'students',
our students' parents to them with the necessary tools for remote 'parents', 'supply',
supply them with the learning like comfortable atmosphere 'necessary', 'tools',
necessary tools for remote powerful access to the internet sufficient 'remote', 'learning',
learning like comfortable devices 'like', 'comfortable',
atmosphere, powerful access RemoteLearningMSFTEduChatMicrosoftED 'atmosphere',
to the internet, sufficient UTweetMeetEN 'powerful', 'access',
devices. #RemoteLearning 'internet', 'sufficient',
#MSFTEduChat 'devices',
#MicrosoftEDU 'RemoteLearning',
#TweetMeetEN https:// 'MSFTEduChat',
twitter.com/AbhilashaTochi 'MicrosoftEDU',
/status/125265743464199782 'TweetMeetEN'
6 \xe2\x80\xa6"""
So important to accept that So important to accept that this is a difficult 'important', 'accept',
this is a difficult time for all time for all and very difficult for some As 'difficult', 'time',
and very difficult for some. such keep things simple and make sure 'difficult', 'keep',
As such keep things simple expectations are reasonable This requires 'things', 'simple',
and make sure expectations discussing with students MicrosoftEdu 'make', 'sure',
are reasonable; This requires MIEExpert 'expectations',
discussing with students. RemoteLearning 'reasonable',
#MicrosoftEdu #MIEExpert TweetMeetEn 'requires',
#RemoteLearning 'discussing',
#TweetMeetEn https:// 'students',
twitter.com/robdunlopEDU/s 'MicrosoftEdu',
tatus/1252656849377046528 'MIEExpert',
\xe2\x80\xa6' 'RemoteLearning',
'TweetMeetEn'
To me this is what To me this is what remotelearning has felt like ‘remotelearning',
#remotelearning has felt like! Students plug in and out where needed and 'felt', 'like', 'Students',
Students plug in and out suited their needs Redefining to me what 'plug', 'needed',
where needed and suited their engagement looks feels and sounds like 'suited', 'needs',
needs. Redefining to me what Essentially this is what my practice should 'Redefining',
engagement looks, feels and have looked like prior COVIDnz I guess 'engagement', 'looks',
sounds like. Essentially this is nzhpe 'feels', 'sounds', 'like',
what my practice should have 'Essentially',
looked like prior to 'practice', 'looked',
#COVID19nz I guess #nzhpe 'like', 'prior',
pic.twitter.com/R81RTkTUoz 'COVIDnz', 'guess',
'" 'nzhpe'
18International Journal of Artificial Intelligence and Applications (IJAIA), Vol.12, No.3, May 2021
4.3. Training
In our model to classify a tweet as positive or negative or as neutral we use a training dataset. A
huge set of generic positive words and negative words files have been created. Using a bag of
words function [11] we convert both the positive and negative word files into word dictionary
and label each word of a positive word dictionary as positive and each word of a negative word
dictionary as negative. Both the labelled positive and negative word dictionaries combined would
serve as training data for our model.
Next, we use the generated training data with the Naïve Bayes classifier [12] in our model to
generate a classifier. The tokenized tweets would be passed through this classifier and each token
of tweet would be compared with training data and each token of tweet would be identified as
positive or negative token. Then based on the possibility of positive or negative tokens in a tweet
each tweet would have a positive probability and negative probability. Hence, a tweet with higher
positive probability would be labelled as a positive tweet and a tweet with higher negative
probability would be labelled as a negative tweet. For a tweet to be labelled as neutral tweet we
have specified a neutral range of probability i.e. from 0.4 to 0.6. When a tweet that has positive
and negative probability of that specified range (0.4 – 0.6) is found then the classifier would label
that tweet as neutral.
Through this combination of word based training and Naïve Bayes classifier, we acquire the
sentiment of each tweet amongst the gathered data. Thus, all the tweets are now labelled as either
positive, negative or neutral.
4.4. Testing
The accuracy of this model depends on the positive and negative word files used as they are used
to train the classifier and predict the tweet sentiment. Thus, the higher the number of words in the
positive and negative word files, the better the training data and it would result in accurate
labelling of tweets. To test the accuracy of the model described above to predict the sentiment of
tweets, we split the labelled tweets into two data sets. 80% of the labelled tweets are used as
training data and 20% of the labelled tweets are used as testing data. Applying the training and
testing data sets to the multinomial Naïve Bayes classifier, we have an accuracy of 83.5% for our
model.
5. RESULTS AND ANALYSIS
The research of performing sentiment analysis on twitter dataset of a total 91,701 tweets related
to education during the Covid-19 phase from the months of March to July of the year 2020 has
given an analysis result as follows
Table2: Shows percentage of the positive, negative and neutral tweets after
performing sentiment analysis on the gathered dataset.
Sentiment of tweet Number of tweets Percentage
Positive tweets 42,161 45.97
Negative tweets 49,507 53.98
Neutral tweets 33 0.03
19International Journal of Artificial Intelligence and Applications (IJAIA), Vol.12, No.3, May 2021
Figure 2: Bar graph representation of the classified tweets
Thus, the above analysis of dataset clearly indicates that the tweets collected include a very
minimal number of neutral range tweets and the percentage of negative tweets is clearly higher
than the positive tweets collected. To analyze the variation of tweets sentiments through each
month, we have used matplotlib library of python to show a graphical visualization of positive,
negative and neutral tweets collected per each of the six days from the months of March to July
of the year 2020 as shown below
Figure 3: March 2020 tweets analysis
Figure 4: April 2020 tweets analysis
20International Journal of Artificial Intelligence and Applications (IJAIA), Vol.12, No.3, May 2021
Figure 5: May 2020 tweets analysis
Figure 6: June 2020 tweets analysis
Figure 7: July 2020 tweets analysis
21International Journal of Artificial Intelligence and Applications (IJAIA), Vol.12, No.3, May 2021
From the graphs shown above, (Figures 3 – 7), x-axis shows the dates on which tweets were
collected and y-axis shows the number of tweets. Green bar in the picture indicates positive
tweets and red bar indicates negative tweets collected on that day of each month. As the analysis
of tweets progressed from the months of March to July, we could clearly see that there is a visible
growth in negative tweets bar per day in comparison to the positive tweets bar. Neutral tweets bar
isn’t visible as they are very minimal but the space between bars representing positive and
negative tweets indicate that each day there has been at least few neutral tweets tweeted.
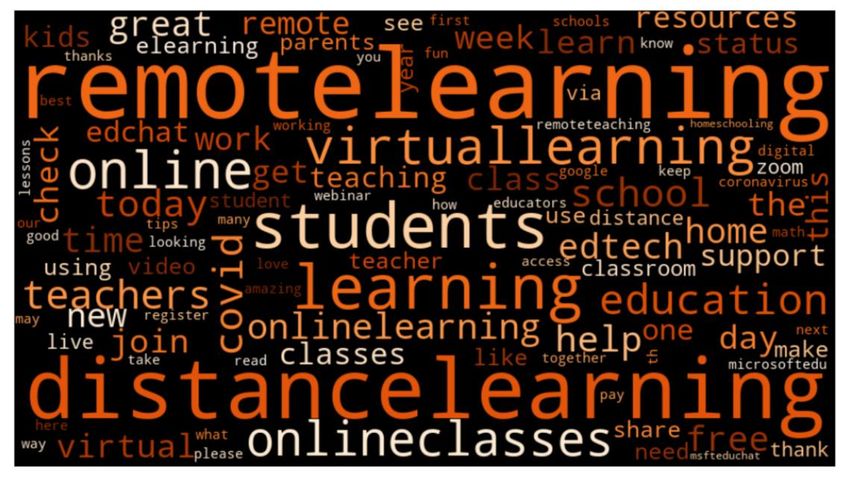
Figure 8: Shows the frequency distribution graph of top 25 most commonly used words in the dataset
Figure 9: Shows Wordcloud of most commonly used words in the dataset
22International Journal of Artificial Intelligence and Applications (IJAIA), Vol.12, No.3, May 2021
Using features of word cloud library in python [13], we have plotted the frequency of the
occurrence of most commonly used words in the gathered tweet dataset (Figure 8) and using
word cloud picturization, the words that occurred most commonly in the tweets, are shown in
Figure 9.
6. CONCLUSION
In this paper we have given an overview of the educational situation globally and effect of its
shift to virtual learning and remote functioning during the Covid-19 pandemic. To study the
effect of these dire changes in the education system and people’s sentiment towards it, we have
gathered related tweets and used a combination of word-based training and Naïve Bayes model
on these tweets, we performed a sentiment analysis. Through this model, we have acquired
sentiment of each tweet which reflects tweeter sentiment.
From the study results, we have seen that the number of tweets with negative sentiment is higher
than the tweets with positive sentiment. Even though it seems safe to stay home and continue the
education, there are clearly several other concerns being battled on daily basis to keep up with
these changes in education system. There are many inconveniencies such as internet and tech
issues, financial situation, and quality of education which have steered people to have negative
sentiment towards the remote learning education being practiced now.
Further, we could implement this model and study people’s sentiment across different countries
independently and compare the difference in sentiments of the people about education. This
could provide a perspective on this issue based on the geographical dimension. Also, we could try
and include tweets in other languages as well for training and improve our model as a
multilingual sentiment classifier.
REFERENCES
[1] “Impact of Covid-19 pandemic on education”, from Wikipedia, the free encyclopedia. 2021.
[2] L. MO, L. J, Sheldenkar, S. PJ, S. W, Gupta R, and Y. Yang. Global Sentiments Surrounding the
COVID-19 Pandemic on Twitter: Analysis of Twitter Trends. JMIR Public Health Surveillance.
2020.
[3] S. Burges and H. Henrik Sievertsen, “Schools, skills, and learning: The impact of COVID-19 on
education”VoxEU & CEPR. 2020.
[4] A. Pak and P. Paroubek. “Twitter as a Corpus for Sentiment Analysis and Opinion Mining". In
Proceedings of the Seventh Conference on International Language Resources and Evaluation,
pp.1320-1326. 2020.
[5] R. Go, B. Huang. “Twitter Sentiment Classification Using Distant Supervision" Stanford University,
Technical Paper. 2009.
[6] A. Xie, I. Vovsha, O. Rambow, and R. Passonneau, “Sentiment Analysis of Twitter Data", In
Proceedings of the ACL 2011Workshop on Languages in social media, pp. 30-38. 2011
[7] B. Pokharel, “Twitter Sentiment analysis during COVID-19 Outbreak in Nepal”,SSRN Electronic
Journal. January 2020.
[8] Jenny Lee, “Benchmarking Language Detection for NLP” Towards Data Science, 2020.
[9] A. Brahmananda Reddy, D.N. Vasundhara, P. Subhash, “Sentiment Research on Twitter Data”
International Journal of recent Technology and Engineering (IJRTE). September 2019.
[10] Martin Pellarolo, “Naïve Bayes for Sentiment Analysis” Medium 2018.
[11] Yin Zhang, Rong Jin and Zhou, “Understanding bag-of-words model: a stastical framework”
International Journal of Machine Learning and Cybernetics volume 1, 2010.
[12] Phyu Thwee, Yi Yi Aung, Cho Cho Lwin, “Naïve Bayes Classifier for sentiment analysis”
International Journal of Creative and Innovative Research in All studies. January 2021.
[13] Florian Heimerl, Steffen Lohmann, Thomas Ertl “Word Cloud explorer: Text analytics based on word
cloud” IEEE, 2014.
23International Journal of Artificial Intelligence and Applications (IJAIA), Vol.12, No.3, May 2021
APPENDIX
In this appendix we provide the links of libraries that we used.
A1. https://docs.python.org/3/library/
A2. https://github.com/Jefferson-Henrique/GetOldTweets-python
ACKNOWLEDGEMENTS
I would like to thank my advisors Dr. Ahmad Hadaegh and Dr. Yanyan Li who advised me and
provided valuable comments in this work. I also like to thank my friends and my family for their
support and encouragement during this time.
AUTHORS
Swetha Sree Cheeti was born in September 1994 in India. She completed her bachelor’s in
Computer Science from Jawaharlal Nehru Technological University (JNTU), Hyderabad,
INDIA in 2016. She then moved to US in 2019 to pursue her Master of Science in
computer science at California State University at San Marcos, California. She recently
earned her graduation in Spring 2021 from CSUSM.
Yanyan Li received his Ph.D. degree from the University of Arkansas, Little Rock, in
2018. He is currently an Assistant Professor in the Department of Computer Science and
Information Systems at California State University San Marcos. His research interests are
in the areas of cybersecurity, machine learning, and mobile computing.
Dr. Hadaegh was born in Shiraz Iran. He moved to Canada in July 1983 and did his
undergraduate work in computer science at University of Lethbridge in Alberta Canada. He
moved to Winnipeg, Canada in 1988 to do his master and PhD at University of Manitoba in
Computer Science. Dr. Hadaegh was hired by California State University San Marcos
(CSUSM) in Fall 2002 and he has been working at CSUSM since then. His expertise is in
Databases and Data Mining.
24You can also read