WASP Datalogger User Guide - Updated: October 2013
←
→
Page content transcription
If your browser does not render page correctly, please read the page content below
WASP Datalogger
User Guide

Updated: October 2013

                        1030 Pleasantview Terrace   t: +1 (609) 339-7227   e: info-usa@itmsoil.com
                        Ridgefield, NJ 07657        f: +1 (646) 478-9462   w: www.itmsoilusa.com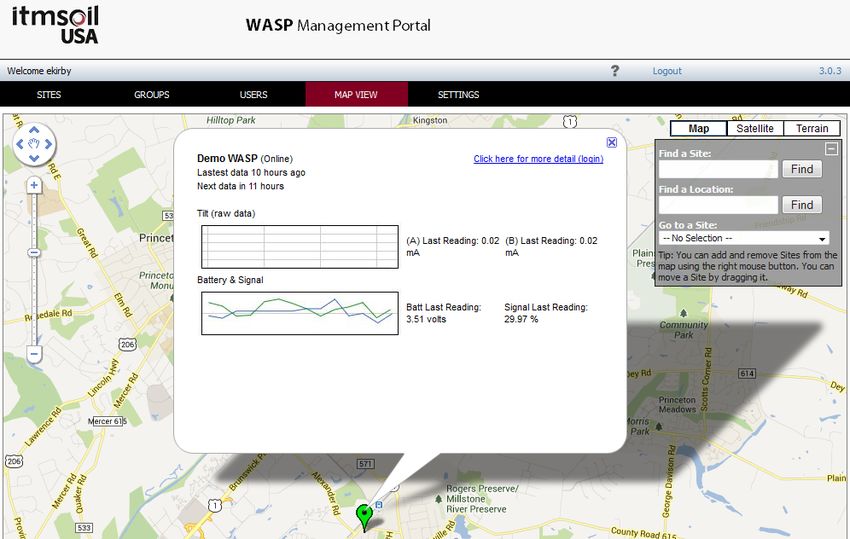
Contents
1     Introduction .......................................................................................................................................... 3
2     Overview of Operation.......................................................................................................................... 4
3     WASP Datalogger .................................................................................................................................. 5
4     Compatible Sensors .............................................................................................................................. 6
5     Sensor and WASP Connection .............................................................................................................. 7
    5.1      itmsoil's Solid State Piezometer .................................................................................................... 7
    5.2      Sisgeo's Electrical Piezometer ....................................................................................................... 7
    5.3      Sisgeo's MEMS Tiltmeter .............................................................................................................. 7
    5.4      Sisgeo Crackmeter......................................................................................................................... 8
    5.5      Celesco String Potentiometer ....................................................................................................... 8
    5.6      General Notes on Sensor Connection ........................................................................................... 8
6     Installing the WASP ............................................................................................................................... 9
    6.1      Mounting the WASP...................................................................................................................... 9
    6.2      WASP Positioning General Guidelines .......................................................................................... 9
7     Confirming GPRS/GSM Signal Strength .............................................................................................. 10
    7.1      Using the WASP Swipe Activation System .................................................................................. 10
    7.2      Using a Smartphone to Check Installation .................................................................................. 12
8     WASP Management Portal Website ................................................................................................... 13
    8.1      Configuration Site ....................................................................................................................... 14
      8.1.1          “SITES” Tab .......................................................................................................................... 14
      8.1.2          “GROUPS” Tab..................................................................................................................... 19
      8.1.3          “USERS” Tab ........................................................................................................................ 19
      8.1.4          “MAP VIEW” Tab ................................................................................................................. 20
      8.1.5          “SETTINGS” Tab ................................................................................................................... 22
    8.2      Data Display Site ......................................................................................................................... 23
      8.2.1          “GRAPHS” Tab .................................................................................................................... 24
      8.2.2          “REPORTS” Tab ................................................................................................................... 25
9     Battery Life .......................................................................................................................................... 25

2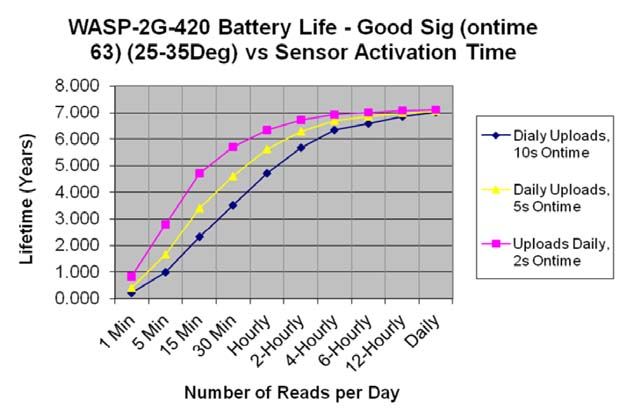
1   Introduction
The WASP datalogger is a compact rugged waterproof data logger, containing an internal battery
pack, SIM card and antenna. It is available in several variants for attachments to different types of
meters and sensors. Below are some of the features of this powerful yet simple datalogger:

3
2 Overview of Operation
The WASP is designed for quick deployment in the field with minimum requirement on times, tools and
skill as illustrated by the work flow below:
Before you go to site:
a. Take note of the WASP's serial number ‐ Each WASP is assigned with an unique serial number,
such as OP8783.
b. Take note of the sensor's type and serial number.
When you in the field:
a. Install sensor
b. Install WASP ‐ see section 6
c. Connect sensor to WASP ‐ see section 5
d. Activate WASP and check and confirm GPRS/GSM signal strength ‐ see section 7
After returning from site:
a. Log on to WASP's web portal to configure logging frequency, uploading frequency and charts
and alarms as necessary ‐ see section 8
b. Start monitoring
4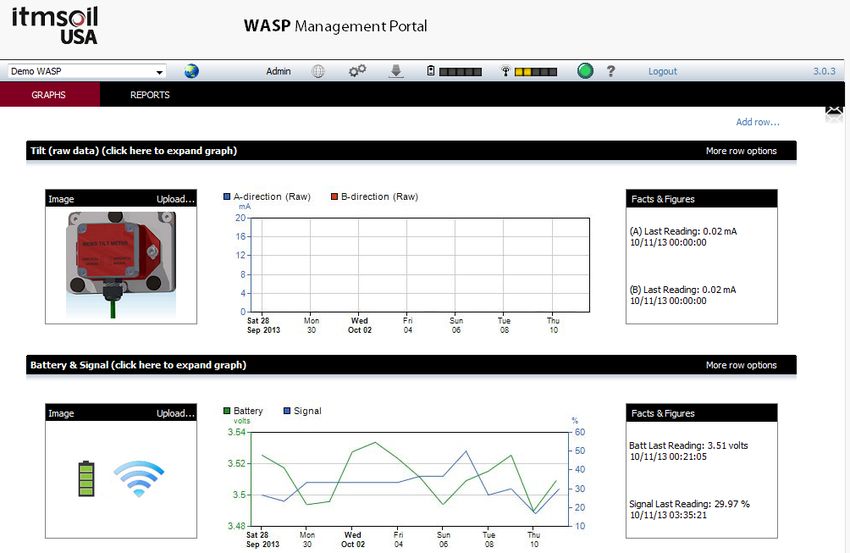
3    WA
      ASP Dataloggger
This user guide covers the two dataalogger modeels as follows:

     Product Code                           Descrription                      Im
                                                                               mage
    WASP‐‐2GA‐1ML         1‐channel logger for mA A sensors witth built‐in:
                          • 2G (GP  PRS) cellular modem
                                                  m       with SIM card
                          • lithiumm‐ion battery
                          • antenn  na
                          • 1 x "flyying lead" of 3‐conductor cable
    WASP‐‐2GA‐2ML         2‐channel logger for mA A sensors witth built‐in:
                          • 2G (GP  PRS) cellular modem
                                                  m       with SIM card
                          • lithiumm‐ion battery
                          • antenn  na
                          • 2 x "flyying leads" eaach with a 3‐cconductor
                              cable

The wiringg details of th
                        he WASP logggers are as folllows:

                                             WASP P Wiring Colors
                                      Red ‐ powerr (18VDC ‐ switched)
                                      Blue ‐ return
                                                  n
                                      Green ‐ grouund (not used
                                                              d)

5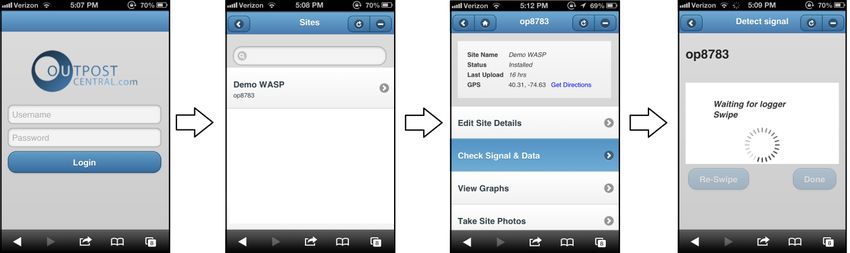
4      Compatible Sensors
The WASP works with 4‐20mA current loop sensors. The 4‐20mA current loop has been widely used in
the industrial and process sectors as well as in the geotechnical field. Its popularity comes from its ease
of use and its performance. A big benefit of the current loop is its simple wiring (only two wires
required). The supply voltage and measuring current are supplied over the same two wires. Zero offset
of the base current (ie. 4mA) makes cable break detection simple. In addition, the current signal is
immune to any stray electrical interference, and a current signal can be transmitted over long distances.

This user guide covers the 4‐20mA sensors shown below.

                    Sensor
    Sensor Type                               Description                             Image
                  Manufacturer

                                   Solid State Piezometer
Piezometer           itmsoil
                                   4‐20mA output

                                   Electrical Piezometer
Piezometer           Sisgeo
                                   4‐20mA output

                                   MEMS Tilt Meter
Tiltmeter            Sisgeo        4‐20mA output
                                   (uniaxial/biaxial with thermistor)

                                   Crackmeter
Crackmeter           Sisgeo        4‐20mA output
                                   (with thermistor)

                                   String Potentiometer
Crackmeter           Celesco
                                   4‐20mA output

6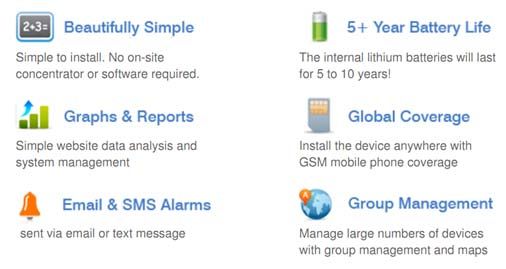
5   Sensor and WASP Connection

5.1 itmsoil's Solid State Piezometer
                                                  Color of Wire
                Terminal Name                              Solid State 4‐20mA
                                       WASP
                                                               Piezometer
                     Power              Red                        Red
                    Return              Blue                      Black
                 Shield/Screen         Green                      Green

5.2 Sisgeo's Electrical Piezometer

                                                  Color of Wire
                Terminal Name
                                       WASP                Electrical Piezometer
                    Power               Red                          Red
                    Return              Blue                        Black
                    Shield             Green                          ‐

5.3 Sisgeo's MEMS Tiltmeter
      o   Uniaxial Tiltmeter
                                                  Color of Wire
                Terminal Name
                                       WASP                 MEMS Tilt Meter
                    Power               Red                      Red
                    Return              Blue                    Black
                    Shield             Green                      ‐
                  Thermistor              ‐                     White
                  Thermistor              ‐                     Green

      o   Biaxial Tiltmeter
                                                  Color of Wire
                Terminal Name
                                        WASP                MEMS Tilt Meter
                  Power (A)            Red (1)                    Red
                  Return (A)           Blue (1)                  Black
                   Power (B)           Red (2)                  White
                  Return (B)           Blue (2)                 Green
                  Thermistor              ‐                     Yellow
                  Thermistor              ‐                      Blue

7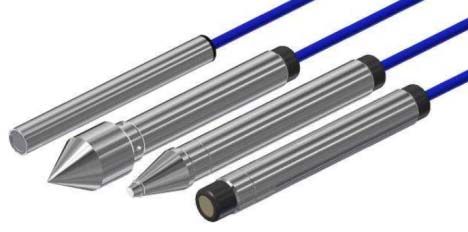
5.4 Sisgeo Crackmeter
                                                          Color of Wire
                  Terminal Name                                  Potentiometer with mA
                                                WASP
                                                                         output
                       Power                     Red                       Red
                       Return                    Blue                     Black
                       Shield                   Green                       ‐

5.5 Celesco String Potentiometer
                                                          Color of Wire
                  Terminal Name                                    SP3 ‐ String Pot. with
                                                WASP
                                                                        mA output
                       Power                     Red                         Red
                       Return                    Blue                       Black
                       Shield                   Green                         ‐

5.6 General Notes on Sensor Connection
    1. It is extremely important to ensure that no moisture can get into the cable join between the
       WASP cable and sensor cable. If moisture enters the cable join, the join will rust over time and
       will cause the mA signal from the sensor to stop being registered. Water can in some cases
       travel up the cable core into the logger or the sensor and damage the internal circuitry.

    2. The "3M ScotchLok UY2 Insulation Displacement Wire Connectors" and crimper are
       recommended for splicing the signal cables together.

As an alternative to splicing cable, water resistant connectors may be provided upon request.

8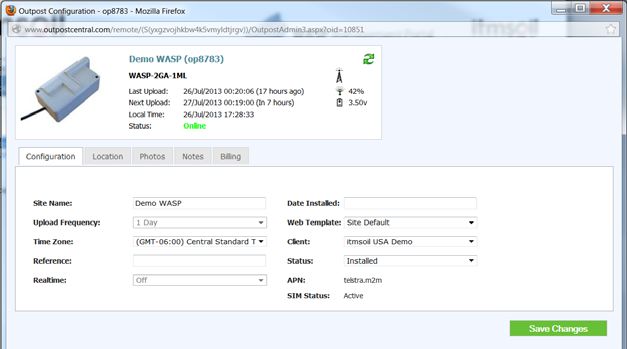
6    Installing the WASP
Placement of the WASP is important to ensure adequate GSM signal strength is available. Poor GSM
signal strength may cause the WASP to make more attempts than normally required to contact the
website and therefore exhaust the internal batteries more quickly. It can also cause a delay in sensor
readings being transferred to the website.

Poor signal starts to affect battery life at around 30% GSM signal strength, and generally will be too low
for normal operation at less than 20% signal strength.

If an WASP is left installed in poor signal strength expect to see the unit appearing “offline” from time to
time, and the website battery gauge to show a higher than normal battery drain rate.

Very poor GPRS/GSM signal strength can result in the WASP device lasting less time than the rated
battery life, or not connecting at all.

6.1 Mounting the WASP
The WASP can be mounted to the wall using two 5mm diameter screws through the two mounting holes
on the two corners of the main body.

Alternately, the WASP can be strapped to a pole using a hose clamp across the center of the body.

6.2 WASP Positioning General Guidelines
    •   Do not install inside a metal cabinet
    •   Avoid installing inside metal room, basement or room with concrete walls
    •   If possible elevate as much as possible, installation in pits or underground not recommended.
        (While this is not strictly recommended, if signal strength in the area is strong, it is possible that
        data may be transmitted to the web, through the manhole or roadbox lid. Testing on site will
        confirm if this is possible)

If sufficient signal can’t be obtained at or near the desired site consider using a WASP variant with
external antenna connection & an external antenna to improve signal performance.

9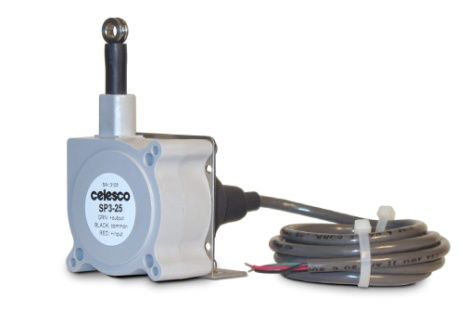
7    Confirming GPRS/GSM Signal Strength
Once a suitable installation position has been identified there are several tools available for the installer
to confirm the GSM signal strength is sufficient and also that attached meters & sensors are functioning
normally:

     •   Magnet swipe with sound feedback ‐ covered in section 7.1
     •   Smartphone mobile web app ‐ covered in section 7.2
     •   Normal PC based web‐browser ‐ covered in section 8

7.1 Using the WASP Swipe Activation System
Using a small magnet, the WASP can be forced to attempt an immediate connection to the website. A
successful connection will validate the GPRS/GSM coverage at the chosen installation location and also
upload details of signal strength and recorded sensor data to the website. The installer may view the
results of the signal strength by using the smartphone app (see next section).

In order to activate the GPRS connection with the magnet, complete the following steps:

             Hold the magnet over the magnet icon as seen in
             figure below.
         a
             A single tone will sound when the magnet is in the
             correct position.

             Hold the magnet in this position until the blue
             light appears and the tone stops.

         b

             Remove the magnet and wait for the WASP to
             make a successful connection to the website
             (indicated by an ascending tone and a green light).

         c

10
After the activation tone, the WASP will attempt to connect to the website in the following
sequence:
a. A series of short “beeps” will sound approximately every 2 seconds. During this period the WASP
is attempting to connect to the local GPRS cell‐phone tower and then transfer data to the
website. This process typically takes 30‐60 seconds, but it can take up to several minutes. The
process may take longer if:
i. The unit has recently been transported from a different country or region. In this
case it may be attempting to find the correct GSM operator
ii. The unit has a lot of data to upload from the internal memory
c. During this process the blue light will flash a code indicating the current GSM signal
strength. 3 flashes indicate full signal strength.
d. Upon a successful connection to the website, the light will turn green and a positive “ascending”
tone will sound.
e. Upon a failed connection to the website, the light will turn red and a negative “descending” tone
will sound. Failure to connect could be the result of the following problems:
i. Unit has not yet identified a cell‐tower to connect to – this can occur the first time a unit
is activated.
ii. Insufficient Signal strength ‐ there may not be enough signal for a full GPRS
connection. Try to move unit to a higher or more open location.
iii. Temporary GPRS network problem. Test the 2G network with your smart phone (AT&T
& T‐Mobile only), if it’s OK then retry with the WASP.
iv. Damaged WASP unit. The unit has been damaged since last used. Check connections to
meters/sensors have not mistakenly fed high voltages into WASP device.
PLEASE NOTE:
If connection is unsuccessful, you may need to retry the magnet swipe several times the first time you
activate the WASP.
117.2 Using a Smartphone to Check Installation Use a smartphone to get immediate feedback on the status of the WASP installation by navigating to www.itmsoilusa.com/WASP and clicking on the “Go To Mobile Version” button. You will then be directed to the Outpost Central mobile login screen. Login and select the WASP you would like to check the signal of as shown below: 1. Login 2. Select WASP 3. Check Signal 4. Swipe WASP Once you get to Step #4, swipe the WASP with the magnet to force a connection to the web. Once the WASP connects to the website, the signal strength is shown in the mobile app. The latest sensor readings are available to view from the full website. The full WASP website portal may also be accessed on smartphones by logging into www.itmsoilusa.com/WASP in the normal way (without selecting the Mobile Version option). 12
8    WASP Management Portal Website
All the WASP’s settings and controls are accessible through wireless communication over the Internet
from the WASP Management Portal. The web address of the Management Portal is:

www.itmsoilusa.com/WASP

The website is used to program the WASP’s reading schedule and method. It may also be used to display
data graphically, generate reports and send automated alert emails in case of a sensor exceeding a
predetermined threshold. Data may also be pushed to an external ftp site for import into the user’s
choice of display software (e.g. ARGUS).

When you open the above web address with an Internet browser, you will see the screen below:

Please log into the WASP Management Portal using the username and password provided to you by
itmsoil USA.

The web portal comprises of two different sections:

     •   Configuration site
     •   Data Display site

Further details are provided in the following pages.

13
8.1 Configuration Site
You may access the various features of the Configuration Site by clicking on the menu items across the
top (Sites, Groups, Users, Map View, Settings). See example screen shot below.
8.1.1 “SITES” Tab
After logging into the WASP management portal (as a Site Administrator or Client), a screen similar to
the one shown below will appear:
The term “Site” refers to a WASP datalogger. All WASPs associated with a user’s account are listed on
under this tab. By default, only active WASPs appear in the Site Name column. You may view Not
Installed or Deactivated WASPs associated with your account by clicking the “Click here to show all” link
(shown above in the red circle).
"Site Name" & "Logger ID" columns
Clicking on either field will bring up a window (shown below) where you may view/edit various
features.
14• Status Screen ‐ View the status of WASP, such as signal strength and battery voltage when it
was last connected.
• Configuration ‐ Edit the Site Name, Time Zone, Project Reference, Installation Date, Web
Template (“OP Site Default” should be used) & Status.
• Location ‐ Enter location information.
• Photos ‐ Photos may only be uploaded using the mobile web‐app.
• Notes ‐ Add or edit a note.
• Billing ‐ Change the current billing status ‐ deactivate or active (please advise itmsoil USA before
doing this to ensure that correct changes are applied to your account).
Each time a change is made to the configuration, you must click the green “Save Changes” button
for changes to take effect.
"Groups" & "Users" columns
Clicking on either field will allow a user to either view or edit the respective settings.
"Signal" & "Battery" columns
Clicking on either field will bring up a graph that displays the respective data of the WASP. If the
latest data is not immediately visible, simply change the range below the graph to be to an earlier
time.
"Log" & "Upload" columns
The Log column shows how often the WASP is collecting readings from sensors. Details on how to
edit this schedule is given in the following section.
Upload Frequency is set to 1 day by default. Data upload will happen at around midnight every day.
If you would like to have the daily data uploaded at a different time of the day (“Roster” option),
please contact itmsoil USA.
15Multiple uploads per day may be available; however, the battery life will be affected. Please contact
itmsoil USA if you would like to change the upload frequency.
“Tools” column
• View Events ‐ click on the blue flag to view a log of events from the WASP, including sensor
readings and communication attempts.
• Config Sensors ‐ click on the grey wrench to change the configuration of the sensors being
read by the WASP. Each Analogue (4‐20mA) sensor has unique configuration settings, these may
be edited by clicking on the Sensor name.
Editable fields include the sensor name, stabilization time, logging frequency, alarms and scripts
to calculate engineering units (more detailed information is given in the following section).
Each time a change is made, you must click to confirm changes.
• Login ‐ click on the golden key to login to the “Data Display” area of the website. This allows
you to view and edit any plots, images and tables associated with the WASP. See section 8.2 for
details.
Config Sensors ‐ DETAILED INSTRUCTIONS
Native Inputs (Analogue, 4‐20mA)
Input Settings – the name of the input (or channel) may be edited here. The “SCADA Tag ID” field may
be ignored.
Calibration – the only things that may require changing are the Stabilization Time and Unit Label.
Generally 1‐second is an acceptable stabilization time but this may vary depending on the type of sensor
used. The below table may be used as a reference.
Stabilization Time
Sensor Type Sensor Manufacturer
(seconds)
Piezometer itmsoil 1
Piezometer Sisgeo 1
Tiltmeter Sisgeo 1
Crackmeter Sisgeo 1
Crackmeter Celesco 1
We suggest that you set the Unit Label as “Other” and type in “mA” as any calibration to engineering
units of the data will occur in the Calculated Input window (more information given in following section).
A screen shot of an example Calibration configuration is shown below:
16Logging Frequency – the WASP can log data as fast as every second, and as slow as once per day. The
WASP has a “ring” type memory that can store approximately 1350 readings (2‐weeks of 15‐minute
readings for a single channel) before the oldest readings are overwritten.
Please note that changing the reading frequency will affect battery life accordingly.
Alarms – alert messages may be sent via SMS or email if a reading satisfies a given condition. To add an
alarm, click the “Add” button, from the Alarm Type drop down list, select an option (“High/Low” is the
most common for geotechnical and structural applications since you may be notified if readings are
either above or below a predetermined value). Click “Next”.
The following section may be configured as desired.
Reset Type – used to prevent alarm from being sent repeatedly. There are two types of reset, time
based and value based. Time based reset prevents the alarm from being send again until after a
specific amount of time. e.g. 2 hours after the first alarm.
Value based reset prevents the alarm from being send again until the value has risen above or fallen
below certain threshold depending on whether the alarm is a high alarm or a low alarm
Do not send again for – this feature may be used to limit the number of alarms sent.
Recipient List – a recipient can only be added from the “GROUP” tab, within the “Alarm Roster” tab.
SMS Recipients ‐ If SMS delivery is used ensure the number includes the country code, i.e. in the
USA, a “1” must be present in front of any US phone number. e.g. 16467707601
A screen shot of an example Alarm configuration is shown below:
17Once all fields are completed as desired, click the “Finish” (or “Update” if making changes to an existing alarm) button. Data – may be imported, exported, deleted or edited. Data values shown in the columns on the left correspond to the values shown in the graph to the right. If no data is visible (or you would like to configure which data is shown), you will need to change the From/To time period below the graph by either using the calendar after clicking on the date or by using the arrows below the dates. To edit data values, click on the value to be edited and type in the new value. Be aware that this is a permanent change of data and is not recommended unless you are sure the changes is required. Only clients with administrator access may delete or edit data. Calculated Inputs (virtual sensors) Input Settings – as for Native Inputs (above). Calibration – this feature allows you to use a VB.NET script to calculate and define engineering units. A standard template of the VB.NET script relating to the sensor you are using will be provided upon request. To define the engineering unit label, click the blue link below the script box (click to change unit) and enter the desired unit, i.e. mm/m, kPa, inches, etc. Logging Frequency – not applicable. Alarms – as for Native Inputs (above). Data – as for Native Inputs (above). 18
8.1.2 “GROUPS” Tab

Groups may be created to manage access to more than one user for the data presentation area of the
website. The following screen shot shows the view after clicking the “GROUPS” tab.

Once a group is added by entering a “New Group Name”, users may select which WASPs (Sites) will be
visible to the group.

8.1.3 “USERS” Tab

Users may be created to allow others access to WASP data and settings. The following screen shot
shows the view after clicking the “USERS” tab.

Users may be one of 4 types (Site, Group, Client or Custom).
   • Site – a user may access a single WASP (site).
   • Group – a user may view data for a predefined group of WASPs (sites).
   • Client – a user may access all WASPs (sites) assigned to your account.

19
Users may be one of two Roles (User or Admin).
   • User – may view but not edit features, depending on the Type.
   • Admin – may edit configuration features, depending on the Type.

You may also view login statistics of each user to see each user’s activity on the website.

The below table shows access levels for each account type and role.

                        Configuration Page         Graph Page
                         View        Edit        View       Edit
            User                                   ●
     Site
            Admin          ●           ●           ●         ●
            User                                   ●
  Group
            Admin                                  ●         ●
            User           ●                       ●
  Client
            Admin          ●           ●           ●           ●

8.1.4 “MAP VIEW” Tab

The following screen shot shows the view after clicking the “MAP VIEW” tab.

20
Right click on the map to add a WASP (site). To move a WASP (site) that is already on the map, simply drag and drop it to a new location using your left mouse button. You may go directly to a particular WASP (site) by selecting it from the drop down list, in the top right corner. 21
8.1.5 “SETTINGS” Tab

General account settings may be adjusted here, including location, time zone and date/time format. A
list of email addresses may be entered to alert users when WASPs are offline.

The following screen shot shows the view after clicking the “SETTINGS” tab.

22
8.2 Data Display Site
You may access the various functions of the Data Display site by clicking on the menu items across the
top of the page. Details of each link are given below:
A drop down list shows all WASPs available to a user. Selecting a WASP will bring up the pre‐defined
plots for that logger.
Clicking the Map icon opens a new window with a Google Map, where the user may select a WASP
to view data.
Clicking the Site Configuration icon opens a new window that allows a user to view/change the
general WASP settings.
Clicking the Sensor Configuration icon opens a new window that allows a user to view/change the
sensor settings for the WASP.
Clicking the Download Data icon opens a new window that allows a user to download data from
any of the WASP input in .csv or text format.
Clicking the Battery Bar icon opens a new window that allows a user to view the WASP
battery levels for the past week (please note, the icon bars do not change color according to battery
level).
Clicking the Signal Bar icon opens a new window that allows a user to view the WASP signal
levels for the past week.
Clicking the WASP Status icon opens a new window that shows a log of recent functions performed
by the WASP.
Clicking the question mark icon opens a new tab containing an interactive Help menu.
Details of each Tab are given below:
– The Graphs tab shows the predefined plots and data statistics for the WASP you are
viewing.
‐ The Reports tab shows the predefined reports for the WASP.
See example screen shot of a Data Display Site below.
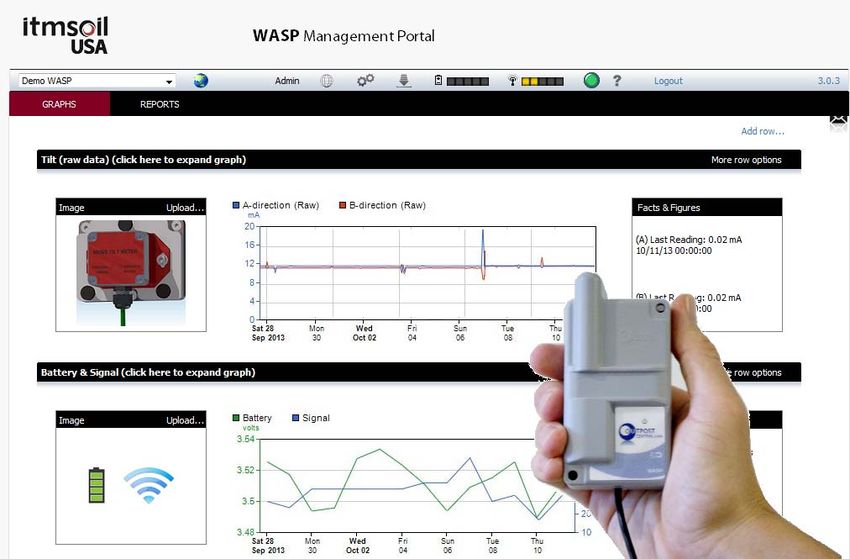
238.2.1 “GRAPHS” Tab Customized graphs showing sensor data may be viewed and configured here (depending on the user’s access level). Clicking on the Image icon allows users to set an image to be associated with a graph. Clicking on the graph allows users to configure graphs by adding data series, customizing the Facts & Figures, etc. any change made to a graph must be saved by clicking the disk icon below the graph. Once the disk icon is clicked, you may determine the duration of data that is shown. New graphs may be added by clicking the “Add row…” link. Page and graph layout may be edited by clicking on the cog icon ( ). Utilizing the Help feature of the website will assist with further details. 24
8.2.2 “REPORTS” Tab
Customized reports showing sensor data may be viewed and configured here (depending on the user’s
access level).
A new report may be created by clicking the “Add Report” link, in the top right corner of the page. To
edit an existing report, click on the report and configure the desired details shown in the window that
subsequently opens. Reports may be automatically generated and emailed to a predetermined list of
recipients, as desired.
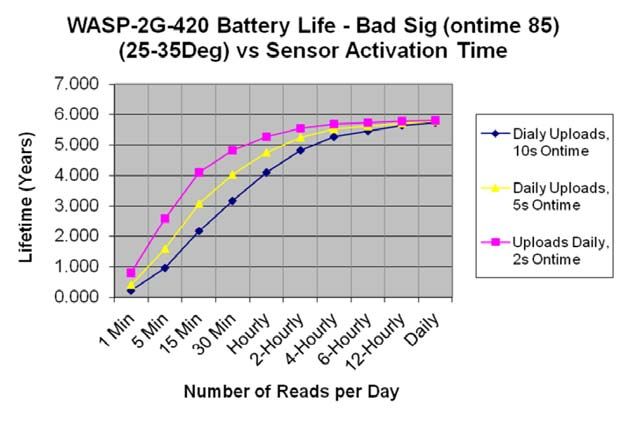
9 Battery Life
The battery life of the WASP is dependent on the following factors:
• Strength of cellular signal
• Ambient temperature
• Sensor stabilization time ‐ how long the sensor must be powered up before taking a reading
• Frequency of reading
• Frequency of data upload
Below are 2 charts illustrating the effect of wireless signal quality, sensor activation time, reading
schedule and data upload on battery life.
2526
You can also read