PDF Solutions, Inc. Investor Presentation - May 29, 2019
←
→
Page content transcription
If your browser does not render page correctly, please read the page content below
PDF Solutions, Inc.
Investor Presentation

May 29, 2019

Disclaimer
     This presentation may contain forward-looking statements regarding projected business
     performance, operating results, financial condition and other aspects of the Company,
     expressed by such language as “expected,” “anticipated,” “projected” and
     “forecasted.” Please be advised that such statements are estimates only and there is no
     assurance that the results stated or implied by forward-looking statements will actually
     be realized by the Company. Forward-looking statements may be based on management
     assumptions that prove to be wrong. The Company and its business are subject to
     substantial risks and potential events beyond its control that could cause material
     differences between predicted results and actual results, including the Company
     incurring operating losses and experiencing unexpected material adverse events.
     Forward-looking statements are based on current expectations and assumptions, which
     are subject to risks and uncertainties that may cause results to differ materially from
     those expressed or implied in the forward-looking statements. We undertake no
     obligation to update or revise publicly any forward-looking statements, whether because
     of new information, future events or otherwise. For additional information concerning
     factors that could cause actual results and events to differ materially from those
     projected herein, please refer to our most recent 10-K, 10-Q and 8-K reports.

2 / PDF Solutions EXTERNAL USE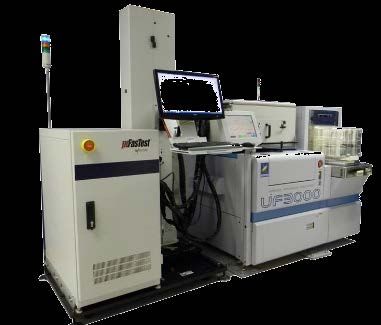
Snapshot of PDF Solutions

                            Founded                                                                                   1991

                            Exchange/Ticker                                                            Nasdaq: PDFS
                            Headquarters                                                              Santa Clara, CA
                            Employees                                                              360+ (100+ PhDs)
                            Patents                                                                                   100+

                            Market Cap                                                                     $397 million
                            Cash and Equivalents                                                            $90 million
                            Debt                                                                                        $0

                            Insider Ownership                                                                        14.7%
                            Shares Sold By Founder-Executives in Last 5
                                                                                                                         0
                            Years

                                                             Market Cap May 21, 2019; Cash and Debt March 31, 2019

3 / PDF Solutions EXTERNAL USE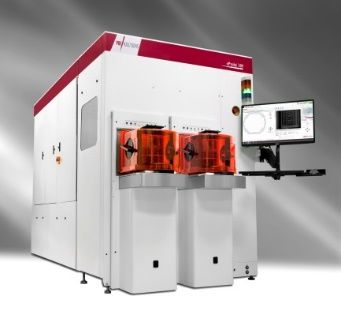
Company Highlights
Company Background
HQ in Santa Clara, CA with operations in the U.S., Europe and Asia and more than 360 employees.
Extraordinary data and analytics solutions to improve semiconductor process efficiency and product reliability
Extraordinary data from proprietary electrical measurement hardware, design, and analysis hardware
More than 140 patents issued in the U.S.
Broad Customer Base
PDF Headquarters
PDF Support/Development Centers
Representative industry participants; not indicative of actual customers.
Logos are the property of the respective trademark owners.
4 / PDF Solutions EXTERNAL USE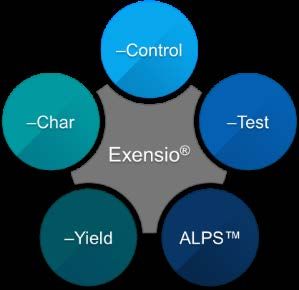
PDF Is A Data Analytics Company

                                          Fab                          Sort             Assembly              Final Test
                                 • Short Flow test wafers     • Sort Ops Control    • Process Control –   • FT Ops Control
                                   to lower Do                • Outlier Detection     FDC for Assembly    • Outlier Detection –
                                 • Scribe CV                    (PAT)               • Wafer Skeleton        Real Time (DPAT)
                                 • DFI                        • Quality Index       • Die Traceability    • Quality Index –
                                 • FDC                        • Map Warehouse       • Map Warehouse         Grading
                                 • Metrology                  • OEE                 •…                    • Map Warehouse
                                 • Defect                     •…                                          • OEE
                                 •…                                                                       •…

                                          Exensio analytics                          Exensio global
                                                                                     data exchange
                                                                                     network (DEX)

                PDF is increasing its focus on analytics spanning the Si supply
                chain that leverages our proprietary and extraordinary data
5 / PDF Solutions EXTERNAL USE
Advanced Technology Requirements Drive Demand

          3D Processes           2.5D-3D Packaging    Electrical Scaling       System
          Invisible defects         Analytics and     on Mature Nodes        Performance
                                    traceability in     More electrical      Optimization
                                      assembly         characterization     Alignment of data
                                                        requirements       across supply chain

6 / PDF Solutions EXTERNAL USE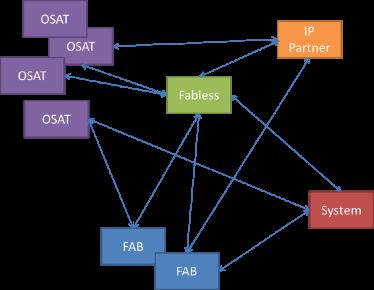
Meeting Demand by Integrating Analytics And Proprietary Data

                                 Extraordinary Data

                                                                                                                       Exensio®
            Focused R&D                                                                                                Platform

                                      Insights
7 / PDF Solutions EXTERNAL USE                   (1) www.technologyreview.com/s/612394/ai-is-not-magic-dust-for-your-company-says-googles-cloud-ai-boss
Meeting Demand – Bridging the Gap with Extraordinary Data
Inline: Inline & End of line:
Design-for-Inspection™ CV® Infrastructure
eProbe® pdFasTest®
E-beam E-Test HW
HW
Scribeline
MPW and short
flow CV test
chips
On-chip
DFI™
instruments
PDF generates unique and novel electrical characterization data
(ECD) for power/performance, yield and reliability applications
8 / PDF Solutions EXTERNAL USEWhat Is “Design-for-Inspection™ (DFI™)?”
DFI™ exploits the unused space inherent in any
System-on-Chip (SoC) logic design
• Non-functional “Filler cells” commonly occupy 5-30% of logic blocks
simply to ensure all transistors can be wired together
E-beam enabled DFI™ Filler Cells are designed to fit
seamlessly with fabless logic IP and used in place of
ordinary filler cells
• DFI has no area or performance penalty
• Fabless company prioritizes content most important to control their
products
Fabless design groups use standard design flows to
insert the filler cells
• PDF Solutions-provided software uses proprietary algorithms to distribute
DFI filler cells across the die, for maximum issue coverage with fast
readout
DFI Filler cell designs are targeted at key process fail
mechanisms and measured with PDF Solutions’
eProbe® system
• DFI translates standard “passive voltage contrast” measurement into
“Electrical Response Index (ERI).” DFI Cells and eProbe® co-optimized
for best results.
9 / PDF Solutions EXTERNAL USEWhat Problems DFI Solves
TD Health Reliability/Performance
Open/short, Margin Margin, Latent Fails
HVM Control Fabless
Margin, Variability More than WAT, Die-scoring
Misalignment
Monitors inside
product die
Process Window
DFI instruments products and enables new
opportunities for inline process control
10 / PDF Solutions EXTERNAL USEDFI Is A Complete System For Yield Metrology
Process Tool
DFI™ Design Framework FDC and Inspection
R2R Control Metrology & Review
DFI Scribe, DFI Filler
Test Chips Cells
Billions of
DFI™ Cells
Product Chip or
per wafer
MPW Block
eProbe® Measurement
FIRE™ Layout Analysis Tool
Fabless embed DFI™ cells directly Custom Measurement System, Big Data Analysis Software
into the SoC co-optimized with test structures
and analysis system Analytics for critical failures
Foundry embeds DFI in scribe and process margin
Rapid, non-contact electrical
20+years test structure design response from eProbe™ tool Billions of measurements
experience, extensive patents per wafer
Mass production e-beam
No area or performance impact solution
11 / PDF Solutions EXTERNAL USEMeeting Demand – Exensio® Analytics Platform
IC Design Fab Sort Assembly Test System
Enterprise High-value
framework solutions
Exensio® AIM Solutions: Advanced insights into manufacturing with machine learning
Exensio® Core Platform: Scalable big data & processing,
common UI and semi-semantic model
DEX™: Global data exchange ecosystem
Fire™
layout Exensio® Yield: Yield diagnostic analytics across all data
“Point” tools
analytics
Exensio ® Control: Process diagnostics and control
Exensio ® Test: Test optimization
Exensio ® Char: CV and DFI
for yield and reliability
analytics
Exensio ® ALPS: Supply chain traceability
12 / PDF Solutions EXTERNAL USEExensio® is The Enterprise-Wide Solution
Built upon industry-leading Big
Data technologies
• Cassandra, Spark, Spotfire, machine learning –Control
Data integration from all stages of
the supply chain –Char –Test
• Fab, wafer test, assembly, final test Exensio
®
• DEX secure global data exchange network
Key acquisitions and R&D expands
capability –Yield ALPS™
• StreamMosaic assets acquisition adds
production-proven machine learning in use at top
10 fabless company
13 / PDF Solutions EXTERNAL USEPDF Solutions - Investment Summary
Advanced Data Analytics Solutions for Leading Edge IC Fabs
1 Large and Growing Opportunities in Big Data Analytics
2 Uniquely Positioned in Semiconductor Eco-system
3 World-class Fabless, Foundry and Memory Customers
4 Significant Competitive Advantages
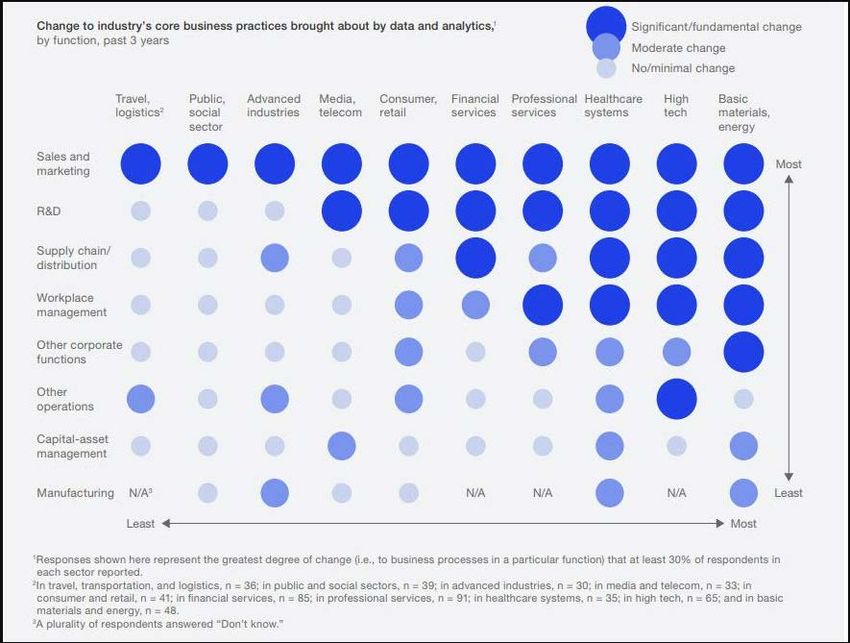
14 / PDF Solutions EXTERNAL USE1 Large and Growing Opportunities in Big Data Analytics
Big data is a large and growing market
• Big data software is a $31 billion market with 14% CAGR
Big data will be a significant
change agent for semiconductor
84% of enterprises have
launched advanced analytics
and big data initiatives to
accelerate decision making
and data accuracy*
* Source: NewVantage Venture Partners Survey and Statista Source: Forbes
15 / PDF Solutions EXTERNAL USETransition to New Business Opportunities
PAST FUTURE
Before 2014 2019 and Beyond
Providing data-analytics solutions across the semiconductor
Business Description Helping bring up leading-edge silicon for foundries
supply chain
Predominant Percent completion deployment and performance Recurring revenue from software as a service (SaaS) and data
Business Model incentive (Gainshare) analytics (in the Exensio® and DFI™ businesses)
Introduction of new process nodes by second-tier Need for data analytics and visibility throughout the
Business Drivers
foundries semiconductor supply chain
Exensio® Platform
Solutions Offered Integrated Yield Ramp Design-for-Inspection™
CV® Infrastructure
More than 130 customers in 20 countries
Customer Set Foundries and some fabless
Fabless, fab, OSAT and system companies
In 2018 through Q3, approximately 52% of revenue from top 3
Customer Concentration In 2014, 79% of revenue derived from top 3 customers
customers
China Less than 2% of revenue More than 30% of revenue
Revenue Contribution from
Less than 20% of total revenue (2013) More than 60% of Design-to-Silicon revenue (Q1 2019)
Analytics
Independent Directors Venture capital, large semiconductor Tech transition, China semiconductor industry,
Expertise fab operations, financial reporting and management large-scale software, financial reporting and management
Leveraging market position, IP, R&D capabilities, and cash
to pivot to a more predictable and diverse revenue base
16 / PDF Solutions EXTERNAL USEAnalytics + Extraordinary Data Maximizes Value of Company
6 of top 10 Exensio® customers
also use PDF’s unique and novel
data sources Exensio® based Revenue Growth
• Mixture of CVi and DFI™ electrical
characterization
• Applications include process variability control
and reliability, yield and performance
monitoring
Recurring revenue growth driven by
Exensio® and enhanced with 2015 2016 2017
CVi/DFI capability Rev
• 80% recurring revenue growth (2015 to 2017)
• 40% revenue/customer growth (2015 to 2017)
17 / PDF Solutions EXTERNAL USE *based on 3Q18 reported revenue2 Uniquely Positioned in Semiconductor Eco-system
Provide unique design IP that is integrated into a semiconductor
device and provides extraordinary data during manufacturing and in
field-use
Offer an end-to-end big data analytics solution designed to meet the
needs of the semiconductor value chain
Have the largest technical team in the industry dedicated to helping
customers improve product performance, yield and reliability
3 Pillars to PDF’s Solutions
18 / PDF Solutions EXTERNAL USE3 World-class Fabless, Foundry and Memory Customers
6 of Top-7 foundries and 5 of Top-6 fabless companies Data Exchange Network (DEX™)
running PDF technology Exensio® Control #1 share in foundry
> 130 customers in 20 countries Exensio® Yield #1 share in foundry
> 2PBs under management with > 500TBs comprised Exensio® Test #2 share in fabless/IDM
of CV, hosted and OSAT data Largest hosted market share in yield management
> 100 Billion CV tests annually software
PDF Headquarters
PDF Support/Development Centers
Representative industry participants; not indicative of actual customers.
Logos are the property of the respective trademark owners.
19 / PDF Solutions EXTERNAL USE4 Significant Competitive Advantages
Holistic Nature of Our Approach
• PDF is the only company that collects data from both manufacturing and test
operations and can feed data forward and backward through both domains
• Breaks down the data “silos”, which in turn accelerates learning and root cause
analysis
• Shortens overall “time-to-market” for semiconductor products
Investment in Extraordinary Data
• PDF is the only company that has invested in how to create and extract unique
and novel data from the manufacturing process.
• Our unique and novel data provides “foresight” into semiconductor manufacturing
process, identifying issues that can not be seen by other methods until much later
in the manufacturing process.
20 / PDF Solutions EXTERNAL USEFinancials
Income Statement (Non-GAAP) – Annual Trend
    in thousands (except share amounts, percent of revenue, and EPS)

                             P&L                                       2015        2016        2017        2018
                             Solutions Revenue                            63,839      77,162      74,436      60,081
                             Gain Share - Performance Incentive           34,138      30,299      27,435      25,713
                             Total Revenue                                97,977     107,461     101,871      85,794
                             Cost of Sales                                36,825      39,647      42,293      38,418
                             GROSS MARGIN                                 61,151      67,814      59,578      47,376

                             GROSS MARGIN %                                 62%         63%         58%         55%

                             OPERATING EXPENSES
                             Research & Development                      16,716      24,472      26,394      24,347

                             Selling, General, & Administrative          15,624      18,568      19,915      20,453

                             TOTAL OPERATING EXPENSES                    32,340      43,040      46,309      44,800
                             OPERATING INCOME (LOSS)                     28,811      24,773      13,269       2,576

                             NET INCOME                                  24,702      21,468      12,973       2,821

                             EPS                                            0.77        0.66        0.39        0.09

                                              Accelerated R&D investments began in 2015
22 / PDF Solutions EXTERNAL USE
Income Statement (Non-GAAP) – Quarterly Trend Through Q1 2019
in thousands (except share amounts, percent of revenue, and EPS)
P&L Q3-17 Q4-17 Q1-18 Q2-18 Q3-18 Q4-18 Q1-19
Design to Silicon Yield Solutions 19,228 19,010 18,190 15,265 13,976 12,649 16,661
Gain Share - Performance Incentive 7,288 7,766 6,547 5,853 6,237 7,076 3,880
Total Revenue 26,517 26,776 24,737 21,119 20,213 19,725 20,541
Cost of Sales 10,961 10,975 10,115 9,805 9,704 8,792 6,864
GROSS MARGIN 15,556 15,801 14,622 11,314 10,509 10,933 13,677
GROSS MARGIN % 59% 59% 59% 54% 52% 55% 67%
OPERATING EXPENSES
Research & Development 6,848 6,670 6,292 6,255 6,030 5,770 6,528
Selling, General, & Administrative 4,722 4,944 5,412 5,030 4,751 5,260 6,112
TOTAL OPERATING EXPENSES 11,570 11,613 11,704 11,286 10,781 11,030 12,640
OPERATING INCOME (LOSS) 3,986 4,187 2,918 28 (273) (97) 1,037
NET INCOME (LOSS) 3,562 4,164 2,220 760 205 (366) 842
EPS 0.11 0.13 0.07 0.02 0.01 (0.01) 0.03
Gross margin upward pressure as software becomes a larger component of our revenue
23 / PDF Solutions EXTERNAL USEBalance Sheet
Actual Actual
($ '000) Q4 '18 Q1 ‘19
We have made R&D a priority and invested in
Cash and short-term investments $96,089 $90,415 strategic acquisitions as our markets have
Accounts receivable, net 29,332 33,778 changed
Unbilled accounts receivable 22,238 19,433 • R&D spending includes accelerated development on DFI™ and
Exensio® products
Prepaids and other current 9,562 9,862 • We have made three small technology acquisitions in the last
Goodwill and intangibles 6,987 6,735 four years (approx. $12 million)
Property, plant and equipment, net 35,681 35,936 Our customers value that we maintain a prudent
Deferred tax and other assets 26,016 28,187 cash balance for risk mitigation
Operating Lease right-of-use - 8,339 • As a critical supplier to large organizations, our business
stability and cash resources are an important element of our
TOTAL ASSETS $225,905 $232,685 marketing
Accounts payable $2,454 $2,522 We have repurchased over $40 million of our
stock in the last four years
Accrued liabilities 7,962 7,057 • We have used buybacks to return excess cash to shareholders
Deferred revenue and billing in excess of and manage dilution from our compensation programs
revenue 9,112 10,749
Tax and other long-term liabilities 6,582 4,632 We continue to prioritize disciplined capital
Operating Lease liability - 10,378 allocation
Total stockholders' equity 199,795 197,347
TOTAL LIABILITIES & EQUITY $225,905 $232,685
24 / PDF Solutions EXTERNAL USELeadership – Mix of Veterans & Newcomers/Software & SC Experience
Executive Management
John Kibarian, Ph.D Christine Russell
CEO & President, Co-Founder, CFO
and Board Member
Andrzej Strojwas, Ph.D Kimon Michaels, Ph.D
Chief Technologist VP, Products & Solutions, Co-Founder,
and Board Member
Independent Directors
Joe Bronson (2014) Marco Iansiti (2016)
Applied Materials, FormFactor, Sanmina, Harvard Business School, Keystone Strategy
Maxim
Gerald Yin (2018) Mike (Gus) Gustafson (2018)
AMEC, 20 years in Silicon Valley Druva, Everspin Technologies, Reltio
25 / PDF Solutions EXTERNAL USESummary – Positioned for Growth
Best-in-class solutions with applications across the semiconductor
value chain
Only data analytics solution for critical performance measurement
applications
Business model with recurring, predictable revenue in two new lines of
business
26 / PDF Solutions EXTERNAL USEThank You!
Appendix – GAAP to Non-GAAP reconciliation
Non-GAAP Presentation
               In addition to providing results that are determined in accordance with Generally Accepted
               Accounting Principles in the United States of America (GAAP), the Company also provides certain
               non-GAAP financial measures. Non-GAAP net income excludes the effects of non-recurring items
               (including severance payments), stock-based compensation expenses, amortization of acquired
               technology and other acquired intangible assets, and their related income tax effects, as applicable,
               as well as adjusts for the non-cash portion of income taxes. These non-GAAP financial measures
               are used by management internally to measure the Company’s profitability and performance. PDF
               Solutions’ management believes that these non-GAAP measures provide useful supplemental
               measures to investors regarding the Company’s ongoing operations in light of the fact that none of
               these categories of expense has a current effect on the future uses of cash (with the exception of
               certain non-recurring items) nor do they impact the generation of current or future revenues. These
               non-GAAP results should not be considered an alternative to, or a substitute for, GAAP financial
               information, and may be different from similarly titled non-GAAP measures used by other
               companies. In particular, these non-GAAP financial measures are not a substitute for GAAP
               measures of income or loss as a measure of performance, or to cash flows from operating,
               investing and financing activities as a measure of liquidity. Management uses these non-GAAP
               financial measures internally to measure profitability and performance; these non-GAAP measures
               are presented here to give investors an opportunity to see the Company’s financial results as
               viewed by management. A detailed reconciliation of the adjustments made to comparable GAAP
               measures is included herein.

29 / PDF Solutions EXTERNAL USE
Q1’19 Reconciliation of GAAP to Non-GAAP
($ '000) Revenues Gross Profit Op Income Net Income
Q1 '19 GAAP Income Statement $20,541 $12,673 ($2,783) ($2,691)
Stock-based compensation - 860 3,476 3,476
Amortization of intangible assets - 144 252 252
Restructuring charges/severances - - 92 92
Income tax expense - - - (287)
Q1 '19 Non-GAAP Income Statement $20,541 $13,677 $1,037 $842
30 / PDF Solutions EXTERNAL USEAppendix – GAAP to Non-GAAP Income Reconciliation (Annual)
in thousands (except share amounts, percent of revenue, and EPS)
2016 2017 2018
GAAP net income (loss) $ 9,103 $ (1,337) $ (7,716)
Adjustments to reconcile GAAP net income (loss) to non-GAAP
net income (loss):
Stock-based compensation expense 11,002 11,810 10,295
Amortization of acquired technology 374 471 575
Amortization of other acquired intangible assets 432 398 435
Restructuring charges and severance payment - 400 907
Write-down in value of property and equipment - - 227
Adjustment to contingent consideration related to acquisition - - 90
Tax Impact of Adjustments 557 1,231 (1,992)
Non-GAAP net income (loss) $ 21,468 $ 12,973 $ 2,821
GAAP net income (loss) per diluted share $ 0.28 $ (0.04) $ (0.24)
Non-GAAP net income (loss) per diluted share $ 0.66 $ 0.39 $ 0.09
Shares used in diluted shares calculation (in millions) 32.4 33.2 32.5
31 / PDF Solutions EXTERNAL USEAppendix – GAAP to Non-GAAP Income Reconciliation (Quarterly)
in thousands (except share amounts, percent of revenue, and EPS)
Q4-17 Q1-18 Q2-18 Q3-18 Q4-18
GAAP net income (loss) $ (2,634) $ (424) $ (2,096) $ (2,082) $ (3,114)
Adjustments to reconcile GAAP net income (loss) to non-GAAP
net income (loss):
Stock-based compensation expense 3,073 2,856 2,701 2,268 2,470
Amortization of acquired technology 144 144 143 144 144
Amortization of other acquired intangible assets 107 109 108 108 109
Restructuring charges and severance payment 30 283 - 48 576
Write-down in value of property and equipment - - - - 227
Adjustment to contingent consideration related to acquisition - - - - 90
Tax Impact of Adjustments 3,444 (748) (96) (281) (868)
Non-GAAP net income (loss) $ 4,164 $ 2,220 $ 760 $ 205 $ (366)
GAAP net income (loss) per diluted share $ (0.08) $ (0.01) $ (0.07) $ (0.06) $ (0.10)
Non-GAAP net income (loss) per diluted share $ 0.13 $ 0.07 $ 0.02 $ 0.01 $ (0.01)
Shares used in diluted shares calculation (in millions) 32.9 32.6 32.4 32.4 32.5
32 / PDF Solutions EXTERNAL USEYou can also read


