Investor Presentation - John Kibarian, President & CEO, Co-Founder Kimon Michaels, Executive VP, Products and Solutions, Co-Founder Adnan Raza ...

Page created by Lawrence Nunez
 
CONTINUE READING
Investor Presentation - John Kibarian, President & CEO, Co-Founder Kimon Michaels, Executive VP, Products and Solutions, Co-Founder Adnan Raza ...
Investor Presentation                            November 2020
John Kibarian, President & CEO, Co-Founder
Kimon Michaels, Executive VP, Products and Solutions, Co-Founder
Adnan Raza, Executive VP, Finance & CFO
                                       © 2020 PDF Solutions, All Rights Reserved   1
Investor Presentation - John Kibarian, President & CEO, Co-Founder Kimon Michaels, Executive VP, Products and Solutions, Co-Founder Adnan Raza ...
Certain statements in this presentation, and statements that may be made when discussing it,
regarding the Company’s future expected business performance and financial results are forward
looking and are subject to future events and circumstances. Actual results could differ materially from
those expressed in these forward-looking statements. Risks and uncertainties that could cause results
to differ materially include risks associated with: customers’ production volumes under contracts that
provide Gainshare royalties, cost and schedule of new product development; continued adoption of
the Company’s solutions and acquired products by new and existing customers; project milestones or
delays and performance criteria achieved; the provision of technology and services prior to the
execution of a final contract; the potential impact of the coronavirus (COVID-19) on the semiconductor
industry and on the Company’s operations or demand for the Company’s products; successful
integration of acquired companies, technologies, and/or products; the time required of the Company’s
executive management for, and the expenses related to, as well as the success of the Company’s
strategic growth opportunities and partnerships, including its partnership with Advantest Corporation;
and other risks set forth in PDF Solutions’ periodic public filings with the Securities and Exchange
Commission, including, without limitation, its Annual Reports on Form 10-K, most recently filed for the
year ended December 31, 2019, Quarterly Reports on Form 10-Q, and Current Reports on Form 8-K and
amendments to such reports. The forward-looking statements made herein or about this presentation
are made as of the date hereof, and PDF Solutions does not assume any obligation to update such
statements nor the reasons why actual results could differ materially from those projected in such
statements.

                      © 2020 PDF Solutions, Inc. All rights reserved.
                                      © 2020 PDF Solutions, All Rights Reserved                           2
Investor Presentation - John Kibarian, President & CEO, Co-Founder Kimon Michaels, Executive VP, Products and Solutions, Co-Founder Adnan Raza ...
PDF Solutions Overview
◼   PDF is an analytics company that provides products, services, and systems designed to
    improve process efficiency and product reliability for the semiconductor supply chain
◼   PDF uniquely provides:
    – Products and services for the end-to-end data analytics needs of the semiconductor value chain
    – Differentiated data obtained during manufacturing, test, and in-field use from IP integrated into semiconductor
      devices

                                            © 2020 PDF Solutions, All Rights Reserved                                   3
Investor Presentation - John Kibarian, President & CEO, Co-Founder Kimon Michaels, Executive VP, Products and Solutions, Co-Founder Adnan Raza ...
Building a Platform for Success
                     - Analytics revenue CAGR of 24% from 2018 through TTM Q3 2020
      GROWTH
                     - Analytics are 64% of total revenues in TTM Q3 2020 vs 58% in CY 2019, 45% in CY 2018

                     - 59% GAAP and 63% non-GAAP gross margins for Q3 2020
    PROFITABILITY
                     - Total company non-GAAP gross margins continue to move towards 70%+ target model

                     - 95% analytics customer retention rate TTM Q3 2020 vs TTM Q3 2019, based on number of customers
      VISIBILITY
                     - Average Analytics revenue per customer has grown 28% from $353K in CY 2018 to $450K in TTM Q3 2020

                     - Reduced customer concentration; largest customer 25% of revenue in TTM Q3 2020 vs 37% in CY 2018
   DIVERSIFICATION   - No foreign country accounts for more than 20% of revenue in TTM Q3 2020

                     - $168.4M in Cash and short term investment as of Q3’20; No debt
     STRENGTH        - Non-GAAP gross margin improvement by ~9% since 2018

                     - Ongoing commitment to invest in Engineering Technology and Sales & Marketing
    INVESTMENT       - Strategic acquisitions to expand products and market portfolio
                     - Opportunistic share buybacks; $14.9 million since 2018

                                     © 2020 PDF Solutions, All Rights Reserved                                              4
Investor Presentation - John Kibarian, President & CEO, Co-Founder Kimon Michaels, Executive VP, Products and Solutions, Co-Founder Adnan Raza ...
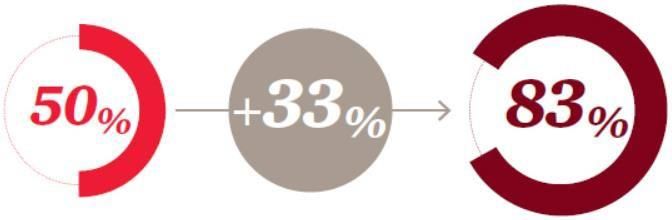
Overview                                                      ◼   Exensio® Software
                                                                  – End to End Analytics
                                                                    platform for electronics
                                                                    supply chain
                Software
                                                              ◼   Differentiated Data
                                                                  – DFI™ system
           IP                                                       (including eProbe®
                                                                    hardware)
                                                                  – CV® infrastructure
                                                                    (including pdFasTest®)
                Hardware
                                                                  – Intellectual Property
                                                                    (proprietary test structure)

                                                              ◼   Professional Services
                                                                  – Engineering, consulting,
                                                                    and hosted data
                                                                    management
                  © 2020 PDF Solutions, All Rights Reserved                                    5
Investor Presentation - John Kibarian, President & CEO, Co-Founder Kimon Michaels, Executive VP, Products and Solutions, Co-Founder Adnan Raza ...
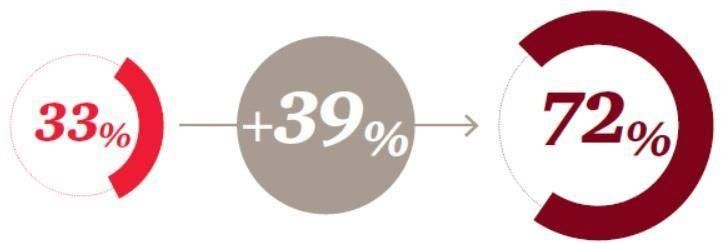
PDF Business Models                                                                      In ‘000
                                                                                                     Average Analytics
                                                                                                   revenue per customer
                                                                                         $500
◼   PDF has a long history of providing solutions combining                                                          $450

                                                                                         $400       $353
    advanced analytics and differentiated data
                                                                                         $300

◼   PDF has two business models to capture the value of our                              $200

    products, services, and systems                                                      $100

                                                                                            $0
                                                                                                    2018          TTM Q3 2020
◼   Subscription model: when value is data and analytics
    – Analytics revenue is primarily subscription based and is the growth driver
                                                                                                   Gainshare model value
      for PDF
    – Subscription model enables PDF to be compensated based on continuous
      usage

◼   Gainshare model: when value is time to volume
    – Integrated Yield Ramp revenue is the variable-fee royalty model that
      enables PDF to be compensated based on measurable value delivered
    – In competitive foundry market, time to mass production is critical
                                             © 2020 PDF Solutions, All Rights Reserved                                          6
Investor Presentation - John Kibarian, President & CEO, Co-Founder Kimon Michaels, Executive VP, Products and Solutions, Co-Founder Adnan Raza ...
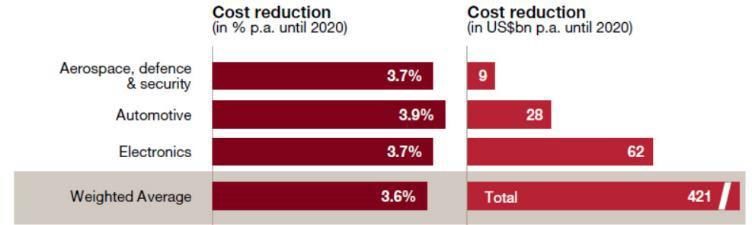
Value Shifting to Mass Production
                                                                                                           Foundries on Leading Edge       Foundry Market By Node
                                                                                                    25

                                                                                                    20

                                                                                                     15

                                                                                                     10

                                                                                                     5

                                                                                                     0

www.techrepublic.com/article/moores-law-is-dead-three-predictions-about-the-computers-of-tomorrow                       node

◼      Trends:
          – Moore’s Law is slowing down, and foundry business is consolidating due to process complexity
          – Percentage of foundry market in finFET nodes expected to continue to grow

◼      Implications:
          – Increased value now in mass production continuous improvement vs. simply time to market
          – Financial risk shifting away from foundry to fabless & system companies
                                                                                               © 2020 PDF Solutions, All Rights Reserved                            7
Investor Presentation - John Kibarian, President & CEO, Co-Founder Kimon Michaels, Executive VP, Products and Solutions, Co-Founder Adnan Raza ...
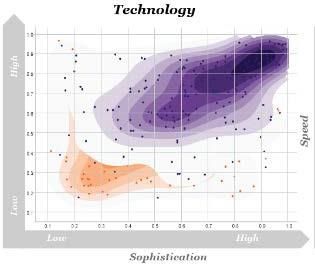
Data and Analytics Growing in Importance

  High-tech sectors will see a greater percentage of cost
  reductions than average and represent nearly a fourth                                 Companies moving to faster decision speed with
         of the total revenue reductions tracked                                         greater sophistication, especially in tech. sector

  Only half of companies today place a high importance                             Number of companies with “highly digitized” functional
  on data analytics, but 83% expect that it will be a core                             groups expected to double over next 5 years
                 competence in five years                                             Source: PwC – Industry 4.0 Building your digital enterprise

                                                  © 2020 PDF Solutions, All Rights Reserved                                                         8
Investor Presentation - John Kibarian, President & CEO, Co-Founder Kimon Michaels, Executive VP, Products and Solutions, Co-Founder Adnan Raza ...
PDF Has A Unique View And Access To Data Sources In The
Manufacturing And Testing Value Chain

                                    Coverage by                                                                 ◼   Wafer-level grading and
                                                                                                                    disposition
                   Semis            Parametric     Wafer                             Final       System-level
      Design                                                     Assembly
                manufacturing          test         sort                             test            test
                                                                                                                ◼   Test reduction and adaptation

                                                                                                                ◼   Die quality and RMA prediction

                                                                                                                ◼   Virtual metrology

                                                                                                                ◼   Yield prediction
   Simulation      Materials data                 Wafer test   Traceability data   Reliability   Performance
      data          Process data    E-test data
                                                    data           FDC data          data            data
                   Metrology data
                                                                                                                ◼   Predictive maintenance

                                                                                                                ◼   Fault detection and classification

                                                                                                                ◼   Capacity and efficiency
                                                                                                                    improvement

                                                         © 2020 PDF Solutions, All Rights Reserved                                               9
PDF Spans and Bridges the Supply Chain Stack

                                                                                                                                                ◼ The only commercial
                             SYSTEM                                                                                                               analytics-focused provider
                                                                                                                                                  with breadth and scale
                             SEMI DEVICE                                                                                                          required by our customers
                             (Fabless & Fab-lite)
                                                                                                                                                ◼ Analytics and data
                                                                                                                                                  implemented broadly across
                             FACTORY                                                                                                              the supply chain
                             (Foundry, OSAT)
                                                                                                                                                ◼ Unique view and access to
                                                                                                                                                  data sources in the
                             ENABLEMENT                                                                                                           manufacturing and testing
                             (Equip, EDA, IP)                                                                                                     value chain

PDF vehicles, systems and
                                                                                                                      PDF Exensio system        ◼ Continue to increase our
                                                                                                                       provides the data
infrastructure are used to
                                                                                                                  collection, connections and     established relationships with
transfer these innovations
     across the stack
                                                                                                                   analytics for feedback and
                                                                                                                    insight down the stack
                                                                                                                                                  critical industry members
                                    Representative industry participants; not indicative of actual customers.
                                    Logos are the property of the respective trademark owners.
                                                                                 © 2020 PDF Solutions, All Rights Reserved                                                  10
Customer Base Spans Fabless, Fab, OSAT, and System

        127 revenue          #1 commercial                     #2 and fastest                           Leading commercial
         generating        solution for mfg                 growing commercial                             provider of die
        customers in       yield and control                 provider in mfg test                       traceability through
    29 countries through   with large cloud                 operations leveraging                         the supply chain
        TTM Q3 2020         customer base                       DEX network

                                                                         Representative industry participants; not indicative of actual customers. Logos are the
                                  © 2020 PDF Solutions, All Rights Reserved                 property of the respective trademark owners.                 11
PDF Solutions – Total Available Market
             1400                                                                                               ◼ Today, PDF provides the only
             1200
                                                                                                                  commercial, supply-chain-
             1000
                                                                                                                  wide analytics products,
                                                                                                                  services, and systems
Millions $

             800

             600                                                                                                ◼ Growth in analytics TAM
             400                                                                                                  being driven from
             200                                                                                                    – Move to cloud and increased data
                                                                                                                      volumes
               0
                                  2016                                                  Today                       – Additional opportunities in
                                              IYR   DFI   Analytics w/o DFI
                                                                                                                      fabless, OSAT, system analytics

                                                                                                                ◼ DFI™ TAM growth driven by
                                                                                                                    – Need for electrical data for
                                  2016                                          Analytics growth                      quality and reliability
                          • Median of range                             • Expansion across supply chain             – Observability limits of
                            presented                                   • ML & advanced solutions
                                                                                                                      conventional inspection
                                                                                 DFI key use case
                                                                        • Quality & reliability

Source: PDF Solutions estimates
                                                                    © 2020 PDF Solutions, All Rights Reserved                                        12
PDF Solutions and Advantest Partnership – 30 July 2020
                        Overview of PDF Solutions                                                               Strategic Rationale of Partnership

                                                                                                                 Mfg                   Test                Assembly
                                                                                                               Analytics             Operations            Operations

    ◼    The only end-to-end data and analytics solutions provider for the                    ◼       >40 and deepens
                                                                                                  Expands         >100 tools >20 supported>50  by Exensio,>50already>150
                                                                                                                                                                     at >300 tool types
                                                                                                       Vendors  Equipment Models Vendors Tester/Prober/    Vendors   Equipment
         semiconductor and electronics manufacturing supply chains                                from >100 equipment companies and           >40k
                                                                                                                                         Handler Modelsconnected tools models
                                                                                                                                                                       worldwide
    ◼    PDF’s Exensio Analytics Platform provides a semantic data model to                   ◼   Increases number of fabs/OSATs using PDF to communicate product data
         integrate and align data from across the semiconductor product lifecycle             ◼   Advantest is the established leader in test systems global ecosystem, with
    ◼    CY 2019 revenues of $86 million with 65% gross margins                                   greater than 50% market share
    ◼    $100 million cash and no debt, as of Q1 ended March-2020                             ◼   Partnering with Advantest allows PDF to further solidify our industry-leading
    ◼    Worldwide ~350 employees and presence in 11 countries                                    footprint in the manufacturing & test equipment data collection ecosystem

                          Overview of Partnership                                                                          Benefits for PDF Solutions
◼       Development of a software platform based on Exensio (“Advantest Cloud                 ◼   Validates PDF strategy of making Exensio an open and independent
        powered by PDF Exensio”) for Advantest’s internal & customers use                         analytics platform for partners to use as a base for their own solutions
◼       Joint development and sale of technology solutions based on Advantest                 ◼   Creates additional opportunities for PDF at fabless and system companies
        testing platforms and PDF’s Exensio analytics software                                    from accelerated adoption of Exensio solution for test, as well as revenue
◼       A 5-year subscription for the PDF Exensio cloud platform and DEX network,                 from the Advantest solutions that leverage Exensio
        which is expected to result in >$50 million revenue                                   ◼   Accelerates adoption of DEX nodes connecting customers, manufacturers
◼       Purchase of 3,306,924 PDF common shares for $65.2 million                                 and suppliers
◼       PDF remains independent and will continue to work with all equipment                  ◼   Accretive deal for PDF stockholders, including share issuance
        providers in both the front-end and back-end                                          ◼   $65.2 million of additional cash provides a platform to accelerate PDF’s
                                                                                                  growth and investments going forward
                                                                   © 2020 PDF Solutions, All Rights Reserved                                                                      13
PDF Acquisitions and Product Releases Expanded Our Scope and
 TAM
                    Gainshare Model “Selling Time to Volume”                                                       Subscription Model “Selling Actionable Data”

                                                                                                                                                                      2020 Q1
                                                                                               2015                                                                 First 8-figure size deal
                                                                                                                                           2018                     of conversion to cloud
                                                                                              Salland Acquisition                        CV Core                    Bookings of >3x YoY
                                                                                              o Test, package, assembly
                                                                                                  mgmt
                                                                                                                                         o Proof of concept         and QoQ                     2020 Q3
                                                                                                                                         Completed major data                                  Partnership with
                                                                                              Syntricity Acquisition                     type migration to                                     Advantest >50% world's
                                                                                              o Hosted yield analysis &                  Cassandra enabling                                    tester market
                                                                       2008                      product characterization                ~20X speedup
                                                                      Triant Acquisition
                                                                                                                                                                              2020 Q2
                                                                                              Established Exensio Test
                                                                      o FDC                                                                                                Strong demand in
                                                                                              offering
                                                                                                                                                                           HPC market
                                                  2007                Production
                                                                      deployment out of
                                                                                                                                                                           Analytics >70% of
                                                                                                                                                                           total revenue
                      2003                      Fabbrix Acquisition   Cassandra-based FDC
                                                                      for YieldAware FDC
                                                o Si IP for DFM
                    IDS Software Acquisition
                                                                                                                            2017                                2019
                    o Yield analysis
  2000              o DB
                                                                                                                            Kinesys Acquisition
                                                                                                                            o Assembly & packaging            StreamMosaic Acquisition
AISS Acquisition                                                                   2010                                        traceability                   o AI & ML for semi
o Layout analysis                                                                Extension of YieldAware
                                                                                                            2016                                                  industry
                                                                                 FDC to include
                                        2006                                     consumable analysis
                                                                                                             Integration of Exensio                           First Big Data Customers
                                                                                                             reporting with Syntricity                        on cloud
                                     Si Automation Acquisition                                               dataConductor and
                                     o FDC                                                                   rebranding as Exensio                            First POC processing
                                                                                                             Hosted                                           integration of
                                     Establish Office in Shanghai                                                                                             StreamMosaic
                                     o Converting field to                                                                                                    technologies with Exensio
                                        address analytics growth                   © 2020 PDF Solutions, All Rights Reserved                                  in Asia                                                   14
GROWTH
Revenue Transition to Analytics

                CY 2018                                                      TTM Q3 2020
                                                                                           Analytics
                               Analytics                                                     64%
                                 45%

   Integrated
   Yield Ramp                                               Integrated
       55%                                                  Yield Ramp
                                                                36%

                     Analytics accounted for 62% of revenues in Q3 2020
                                 © 2020 PDF Solutions, All Rights Reserved                                 15
GROWTH
Analytics Revenue
                $60
                                             $56.3                          ◼ Q3 2020 bookings > 2019
                                                                              bookings
                $50
                                                                            ◼ 1H CY2020 bookings also >
                                                                              2019 bookings
                      $38.5
                $40
                                                                            ◼ CAGR of 24% from 2018 to
                                                                              TTM Q3 2020
   $ Millions

                $30                                                         ◼ Average Analytics revenue per
                                                                              customer has increased 28%
                                                                              from $353K in 2018 to $450K
                $20
                                                                              in TTM Q3 2020

                $10

                $0
                      CY 2018             TTM Q3 2020

                                © 2020 PDF Solutions, All Rights Reserved                               16
PROFITABILITY
Gross Margins
             GAAP                                   Non-GAAP                           ◼ Progressing towards our long
                                  70%
                                                                                         term target Non-GAAP gross
70%
                                                                                         margin of 70%+
65%                               65%                                        64%       ◼ First monetization of
                                                                                         technology was IYR
60%                    59%        60%                                                    engagements with associated
                                                                                         royalties
                                                    55%
55%                               55%                                                  ◼ Second wave of monetization
                                                                                         consists of growing the
       50%
50%                               50%                                                    Analytics business
                                                                                       ◼ Analytics customers
45%                               45%
                                                                                         transitioning to subscription
                                                                                         and cloud over time
40%                               40%
      CY 2018       TTM Q3 2020                   CY 2018                TTM Q3 2020

                                        © 2020 PDF Solutions, All Rights Reserved                                  17
DIVERSIFICATION
Global Geographic Revenue Distribution
                     TTM Q3 2020                                        ◼ Globally diverse geographic
                                                                          distribution

               17%                                                      ◼ No foreign country accounts
                                                                          for more than 20%
                                                                        ◼ US largest market at 41% of
                                                        APAC
                                  42%                                     revenues

                                                        NORTH AMERICA

                                                        EMEA

         41%

                            © 2020 PDF Solutions, All Rights Reserved                              18
STRENGTH
Balance Sheet Strength
                                                                                      ◼ Existing balance sheet
                                                                                        strength provides foundation
                                                                                        for investment in growth of
                    End of Q3   End of Q3
($ Millions)                                                                            analytics business both
                      2019        2020
                                                                                        organically and inorganically
 Cash and ST invt    $100.3      $168.4                        + $65.2 million from
                                                                                      ◼ Cash and Short term
                                                                  Advantest in July
                                                                                        investment increased by $68
 Debt                              $0                                                   million on a year over year
                                                                                        basis
                                                                                      ◼ Investments made in R&D,
                                                                                        PP&E, M&A, S&M, and share
                                                                                        buyback

                                          © 2020 PDF Solutions, All Rights Reserved                               19
Disciplined Capital Allocation
                                                                                                 ◼ Capex investments include
                                                                                                   DFI, CVi, IP, DEX network, and
       Invest in Organic          Invest in M&A to
                                                                     Return Capital to             infrastructure
                                                                   Shareholders through
            Growth                Enhance Growth
                                                                      Stock Buyback              ◼ Cash balance has increased
                                                                                                   while we:
                                                                                                     –   Invest in Capex
                                                                                                     –   Make acquisitions
            $50
                       Capex   Share Repurchase          M&A                                         –   Purchase T-bills
            $45                     $2.7                                                             –   Return capital to shareholders
            $40
                                                                                                         through stock buyback
                                   $14.9
$ Million

            $35
            $30
            $25
            $20
            $15                    $29.1
            $10
            $5
            $0
                               2018 thru Q3'20
                                                     © 2020 PDF Solutions, All Rights Reserved                                       20
VALUE
Long-Term Targets

                                                                          Target

         Annual Analytics Revenue Growth                                   20%

         Non-GAAP Gross Margins                                           >70%

         Non-GAAP Operating Margin                                         20%

                              © 2020 PDF Solutions, All Rights Reserved                    21
Investment Results in Strong Patent Position

◼   Our investments in analytics & differentiated data result
                                                                                       174 Issued
    in a strong and growing patent position                                             Patents
◼   Patents based on 28 years of know-how in semiconductor
    development and mass production
◼   Key patents in areas of:
    – Design for inspection and CV structures for advanced nodes
    – Electrical characterization
    – AI/ML technology                                                                     249
                                                                                         Pending
                                                                                         Patents

                                           © 2020 PDF Solutions, All Rights Reserved                22
Summary
                                Rapid Growth

           Disciplined
                                                             Improved
             Capital
                                                            Profitability
           Allocation
                               Platform to
                                  Drive
                               Shareholder
                                  Value
              Strong                                            Increased
          Balance Sheet                                          Visibility

                                  Enhanced
                                Diversification

                    © 2020 PDF Solutions, All Rights Reserved                 23
Thank You
pdf-solutions   pdfsolutionsinc        pdfs.inc         pdf_solutions   pdfs_cn
                      © 2020 PDF Solutions, All Rights Reserved                   24
Financials - Appendix
                    © 2020 PDF Solutions, All Rights Reserved   25
Non-GAAP Presentation
In addition to providing results that are determined in accordance with Generally Accepted Accounting Principles
in the United States of America (GAAP), the Company also provides certain non-GAAP financial measures. Non-
GAAP net income (loss) excludes the effects of non-recurring items (including adjustment to contingent
consideration related to acquisition, restructuring charges and severance payments, and expenses related to an
arbitration proceeding for a disputed contract with a customer), stock-based compensation expense, amortization
of acquired technology and other acquired intangible assets, and their related income tax effects, as applicable, as
well as adjustments for the non-cash portion of income taxes and tax impact of the CARES Act. These non-GAAP
financial measures are used by management internally to measure the Company’s profitability and performance.
PDF Solutions’ management believes that these non-GAAP measures provide useful supplemental measures to
investors regarding the Company’s ongoing operations in light of the fact that none of these categories of expense
has a current effect on the future uses of cash (with the exception of certain non-recurring items) nor do they
impact the generation of current or future revenues. These non-GAAP results should not be considered an
alternative to, or a substitute for, GAAP financial information, and may be different from similarly titled non-GAAP
measures used by other companies. In particular, these non-GAAP financial measures are not a substitute for
GAAP measures of income or loss as a measure of performance, or to cash flows from operating, investing and
financing activities as a measure of liquidity. Management uses these non-GAAP financial measures internally to
measure profitability and performance; these non-GAAP measures are presented here to give investors an
opportunity to see the Company’s financial results as viewed by management. A detailed reconciliation of the
adjustments made to comparable GAAP measures is included herein.

                                            © 2020 PDF Solutions, All Rights Reserved                             26
GAAP to Non-GAAP Income Reconciliation
     in thousands (except share amounts, percent of revenue, and EPS)

                                                                                                                                              2020 YTD
                                                                                                                           2018      2019      thru Q3
                 GAAP net income (loss)                                                                                   $ (7,716) $ (5,418) $ (6,914)
                 Adjustments to reconcile GAAP net income (loss) to non-GAAP net income (loss):
                 Stock-based compensation expense                                                                               10,295         11,423           9,476
                 Amortization of acquired technology                                                                                574            574            431
                 Amortization of other acquired intangible assets                                                                   435            609            521
                 Restructuring charges and severance payments                                                                       907             92              4
                 Write-down in value of property and equipment                                                                      227              -            311
                 Acquisition costs & adjustment to contingent consideration related to acquisition                                   90             30              -
                 Legal arbitration/litigation *                                                                                       -              -            830
                 Tax Impact of Adjustments                                                                                      (1,992)        (2,785)        (4,192)
                    Non-GAAP net income (loss)                                                                             $      2,820 $        4,525 $          467

                 GAAP net income (loss) per diluted share                                                                        (0.24)         (0.17)         (0.19)
                 Non-GAAP net income (loss) per diluted share                                                                     0.09           0.14           0.01

                 Shares used in diluted shares calculation (in millions)                                                           32.5           33.1           36.7

   * Represents the expenses related to an arbitration proceeding over a disputed contract with a customer, which expenses are expected to continue until the arbitration is resolved.

                                                                     © 2020 PDF Solutions, All Rights Reserved                                                                           27
GAAP to Non-GAAP Gross Margin Reconciliation

  in thousands

                                                                                                                     2020 YTD
                                                                                                   2018     2019      thru Q3
           GAAP Gross Margin                                                                      $ 42,992 $ 52,112 $    38,753
           Adjustments to reconcile GAAP gross margin (loss) to non-GAAP gross margin:
           Stock-based compensation expense                                                            3,554      3,186      2,582
           Impaired deferred costs                                                                         -          -          -
           Previously impaired deferred costs                                                              -          -          -
           Amortization of acquired technology                                                           574        574        431
           Restructuring charges and severance payments                                                  258          -          -
              Non-GAAP gross margin                                                               $   47,378 $   55,872 $   41,766

                                                      © 2020 PDF Solutions, All Rights Reserved                                      28
Balance Sheet
                                                                Actual          Actual     Actual     Actual     Actual
      ($ '000)                                                   2018            2019      Q1 '20     Q2 '20     Q3 '20

      Cash and cash equivalents                                 $96,089         $97,605    $100,385   $103,441   $118,386
      Accounts receivable, net                                   29,332          33,208      28,002     19,903     33,749
      Unbilled accounts receivable                               22,238           7,332       9,362      9,057      6,639
      Prepaids and other current assets                           9,562           9,320      11,628      8,665      9,310
      Property, plant and equipment, net                         35,681          40,798      41,009     40,412     39,487
      Operating lease right-of-use assets                           -             7,609       7,368      7,056      6,712
      Other assets                                               33,003          43,561      41,604     45,494     96,325
      TOTAL ASSETS                                             $225,905        $239,433    $239,358   $234,028   $310,608

      Accounts payable                                           $2,454          $7,636      $4,828     $2,763     $2,212
      Accrued liabilities                                         7,962           6,737       6,161      6,653      8,395
      Operating lease liabilities - current portion                 -             1,867       1,954      1,880      1,763
      Deferred revenue and billing in excess of revenue           9,112          11,644      14,122     10,866     20,504
      Non-current operating lease liabilities                       -             7,677       7,310      7,032      6,764
      Tax and other long-term liabilities                         6,582           7,713       6,514      7,128      6,192
      Total stockholders' equity                                199,795         196,158     198,469    197,706    264,778
      TOTAL LIABILITIES & EQUITY                               $225,905        $239,433    $239,358   $234,028   $310,608

                                               © 2020 PDF Solutions, All Rights Reserved                                    29
© 2020 PDF Solutions, All Rights Reserved   30
You can also read