Adobe Digital Economy Index - Adobe Analytics | May 2020
←
→
Page content transcription
If your browser does not render page correctly, please read the page content below

Adobe Digital Economy Index
Adobe Analytics | May 2020

 ©2020 Adobe. All Rights Reserved. Adobe Confidential.
Methodology

Most comprehensive report of its kind

• Based on an analysis of aggregate and anonymous data via Adobe Analytics

• The DEI is powered by Adobe Analytics, which analyzes 1 trillion visits to retail sites and over 100 million SKUs.

• Adobe Analytics measures transactions from 80 of the top 100 U.S. online retailers as well as 7 out of the top 10
 US airlines.

• Companion research based on a survey of 1,081 U.S. consumers (18+ years) conducted between June 1st - June
 3rd, 2020.

 ©2020 Adobe. All Rights Reserved. Adobe Confidential. 2
Summary

• Adobe’s Digital Economy Index (DEI) is a global economic measure for the 21st century that more
 quickly, comprehensively, and internationally measures the increasing buying power of digital
 consumers — with greater detail than any other data source available.
• Online sales surged above holiday levels in May and spiked further over Memorial Day weekend.
 Growth has plateaued but remains significantly higher than expected levels for 2020.
• Prices for computers and related components continue to climb for the third month in a row.
• Flight booking behaviors and associated data show positive signs.
• As limited re-entry begins, B.O.P.I.S. (Buy-Online-Pick-Up-In-Store) growth starts to slow, after the
 initial pandemic-driven, accelerated rally.

 ©2020 Adobe. All Rights Reserved. Adobe Confidential. 3
Ecommerce has Gained $52B in Extra Online Spend Since the Pandemic Began
• US consumers have shifted a
 significant part of their shopping
 online.

• Compared to our prediction for the
 same period, $52B extra have been
 spent online.

• The $52B equates to more than a
 third of the 2019 holiday season in
 additional spend.

• Ecommerce shopping levels are
 tracking at above holiday (Nov-Dec)
 levels.

• May generated $82.5B in online
 spend, up 77.8% YoY.

 ©2020 Adobe. All Rights Reserved. Adobe Confidential. 4
Memorial Day Breaks a New Milestone For Second Year in a Row at Above $3B

After barely surpassing $2B in spend
last year, Memorial Day* flew past the
$3B mark at $3.5B and drove
staggering growth of 63% YoY.

Last year’s Memorial Day revenue
was 1.5x above the average May day,
but this year it was only 1.3x larger -
even though discounts were 3% less
steep on average YoY.

 *Memorial Day analyzed as a single day
 ©2020 Adobe. All Rights Reserved. Adobe5 Confidential.
Smartphone Adoption Accelerated Despite More Time at Home

• Share of online sales being driven by
 smartphones increased with the spike
 in ecommerce activity.

• Share of products purchased through
 smartphones increased by 10% in
 May compared to January.

• As consumers remain away from their
 office desks, they opt to shop through
 their smartphones at home.

• New consumers who are shopping
 online for the first time are doing so
 from their smartphones.

 ©2020 Adobe. All Rights Reserved. Adobe Confidential. 6
Top Five States with Highest and Lowest Ecommerce Lift

 Different states experienced different levels of COVID-19 spread and different levels of lockdowns. As a result, consumers
 reacted differently in the ecommerce space.

 *Lift is defined as increase in sales from January 2020 to May 2020
 ©2020 Adobe. All Rights Reserved. Adobe7 Confidential.
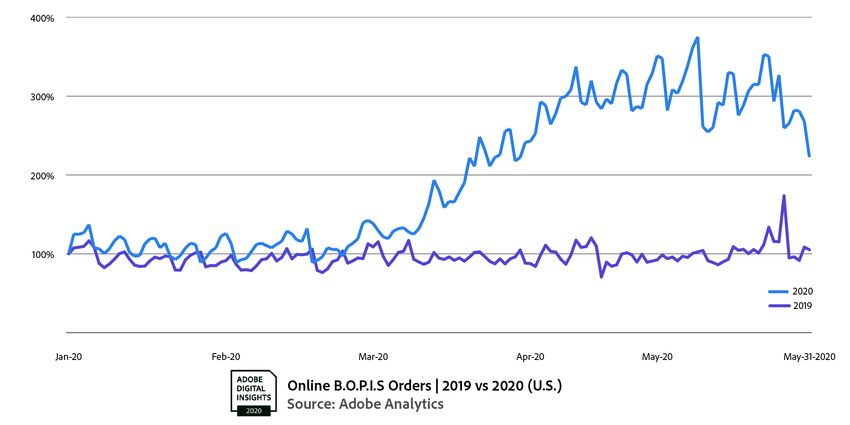
BOPIS Order Demand Begins to Plateau

• BOPIS orders maintained a YoY growth of 195%
 in May, leveling off after the sharp upward
 trajectory seen in March and early April. We'll
 likely see this growth draw down further as
 stores re-open.

• According to our survey, 23% of online
 consumers prefer using buy online, pick-up in
 store or curbside over delivery.

 ©2020 Adobe. All Rights Reserved. Adobe Confidential. 8

Online Grocery Prices Tick up and Consumers Are Feeling the Pinch

Grocery prices were up in May by 4% YoY and
increased 1.3% MoM. In our survey, approximately
60% of consumers say that they believe prices have
gone up for grocery.

 ©2020 Adobe. All Rights Reserved. Adobe Confidential. 9
Computer Prices Are on the Rise

• Computer prices increased by 2.6% MoM in
 May, leading to the third month in a row of
 price increases the category has seen this
 year.

• Supply chain factors and shortages have likely
 contributed to the reversal in deflationary
 pricing the category experienced through
 much of last year. The recent COVID-19 related
 impact resulted in flat YoY change for
 computer prices in May.

 ©2020 Adobe. All Rights Reserved. Adobe Confidential. 10
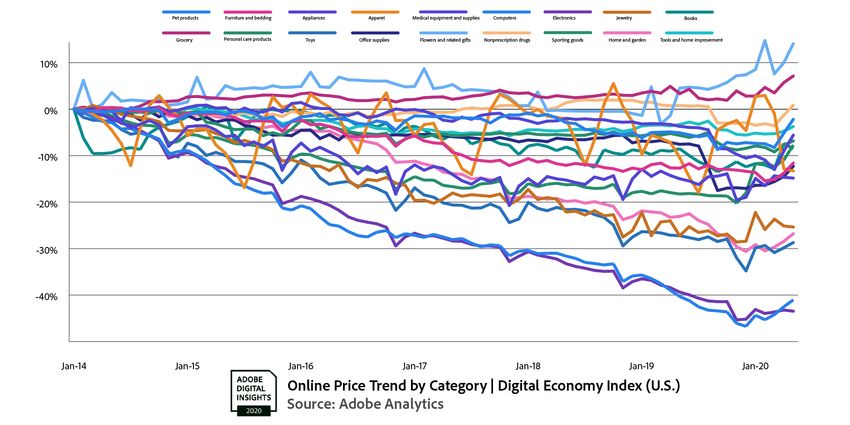
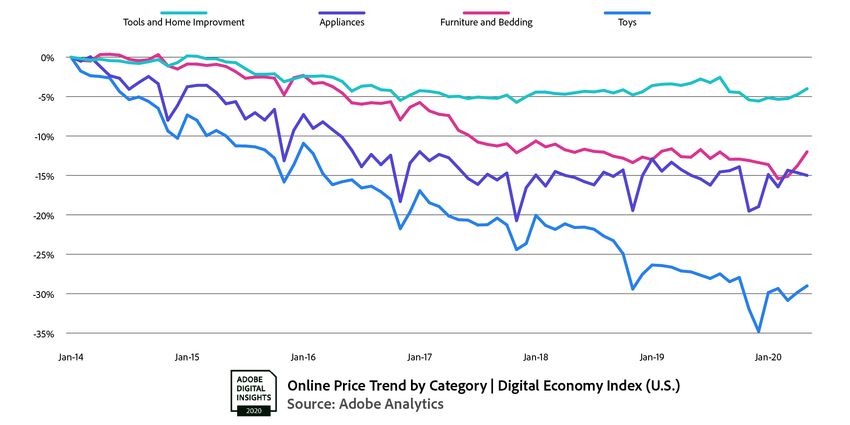
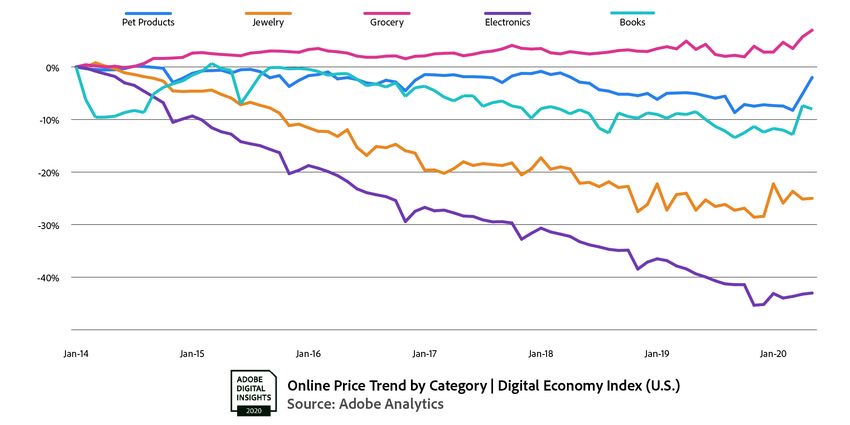
Inflation Throttles U.S. Dollar Purchase Power in May

U.S. DPP was 1.4% percent in May 2020 YoY:
• Consumers can now purchase goods for $1.00 that were worth $1.01 in
 May 2019.

• All DEI categories experienced inflation this month, except for apparel,
 books, electronics, appliances, and jewelry. As a result DPP remained
 relatively flat.

• While YoY apparel growth changes helped a pronounced DPP increase
 in April, those effects were not as strong in May. This ensured the
 1.4% DPP measure, which was down from the 4.1% DPP reported in
 April.

 ©2020 Adobe. All Rights Reserved. Adobe Confidential. 11
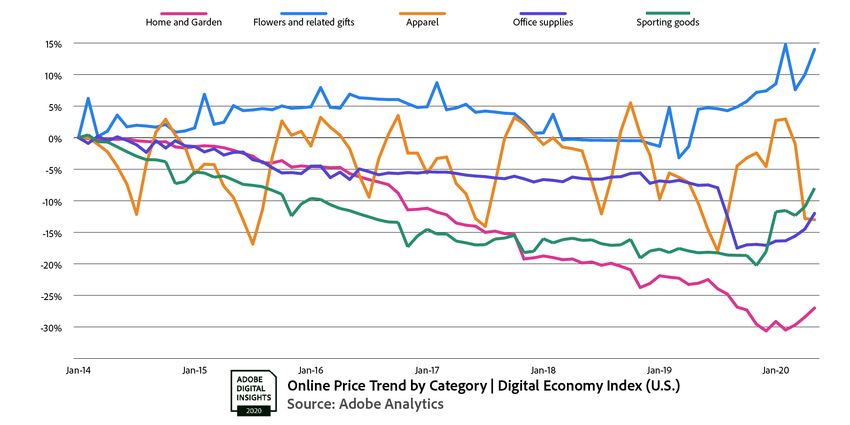
May Daily Sales Shift in Grocery, Apparel and Electronics
After sizable online sales increases in both March and April, May brought more muted increases and certain
decreases for some of the major online categories as re-opening phases began.

• US online grocery daily sales saw a 14% decrease in average daily sales
 in May.

• Consumer electronics daily sales were up 11%.

• Daily online apparel sales increased by 12% in May as prices
 remained low after dropping heavily last month.

 *Growth compared to baseline period of April 15 to April 30 to measurement period of May 1 to May 15
 ©2020 Adobe. All Rights Reserved. Adobe Confidential. 12
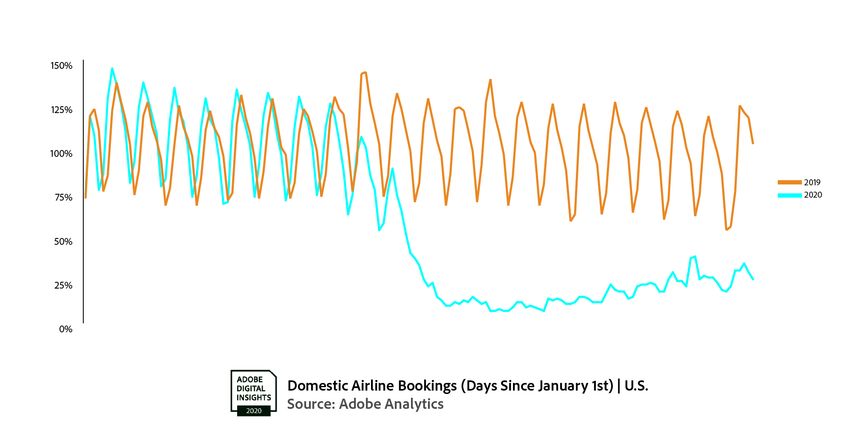
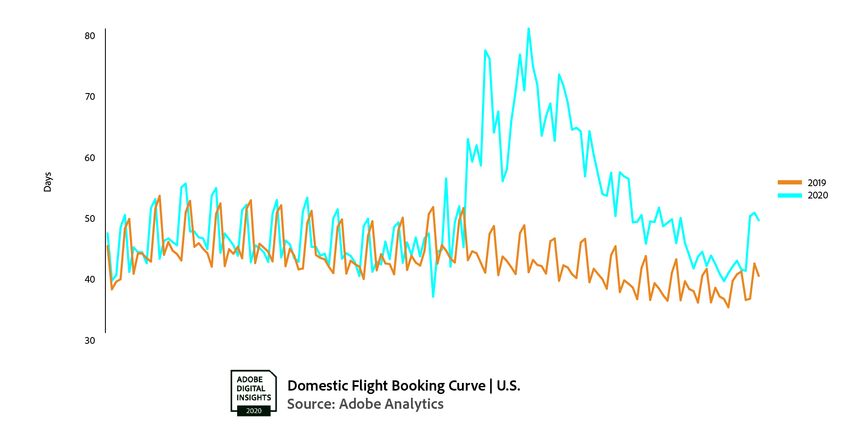
Flight Booking Behaviors Return
Historically, flights are booked on average 40-50 days in advance of the departure date. The length of the
booking window doubled in duration in March & April due to Covid19

 Days Between Booking and Departure Date
• Flight booking windows returning to normative levels suggests
 more confidence with travel stabilizing from governmental
 restrictions.

• In mid-March, the booking window length among those
 purchasing tickets peaked at 90 days prior to departure in the
 first week of April.

• Since then the time to departure has come down as
 consumers are slowly buying more tickets for dates that are
 closer in time.

 ©2020 Adobe. All Rights Reserved. Adobe Confidential. 13
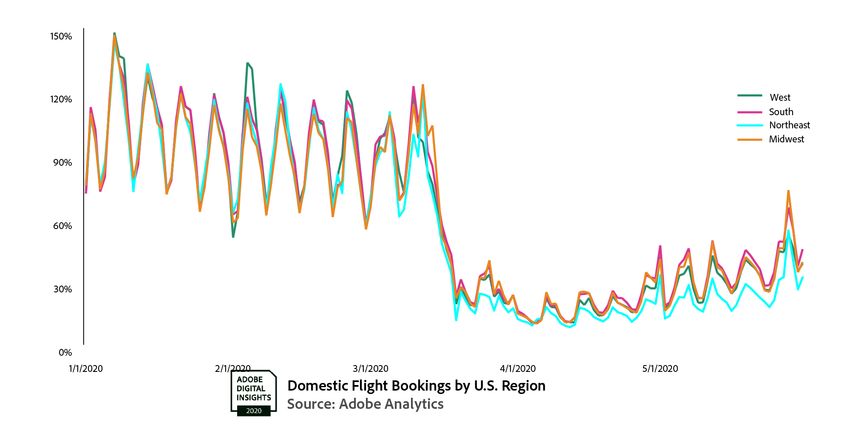
Flight Bookings Rising with Prices Following Suite

 Flight bookings are Flight prices increase in May after experiencing
 growing and have significant deflation in March and April,
 tripled since April 1-7 to
 May 25-31.
 but they are still down 28%.

 Ticket sales dropped
 off slightly over
 Memorial Day
 weekend.

 Flight bookings from
 the Northeast have
 been growing slower
 than the rest of the
 country
 • Northeast: +176%
 • West: + 198%
 • Midwest: +229%
 • South: +234%
 Average daily revenue relative to first week of January 2019 = 100%
 Data thru May 31, 2020
 ©2020 Adobe. All Rights Reserved. Adobe Confidential. 14
Flight Bookings to and From Northeast Hardest Hit
 • No region was immune from travel impact, but the Northeast showed the biggest decline in both departures (-78%) and arrivals
 (-79%) between January and mid-May.

 • As a destination, the South shows better recovery since April 1st than other regions.

 Where Flight Started Where Flight Landed

 ©2020 Adobe. All Rights Reserved. Adobe Confidential. 15
Scope and outlook

 March announcement April monthly refreshes begin Additional countries and “H1 Outlook Report” Holiday pricing trends

 Stay tuned for updates and data refreshes here:
 https://www.adobe.com/experience-cloud/digital-insights/digital-economy-index.html

 ©2020 Adobe. All Rights Reserved. Adobe Confidential. 16
Appendix
The appendix contains a closer look at U.S. DEI categories, formula, and methodology, along with
the benefits to consumers, companies, and policy makers.

 ©2020 Adobe. All Rights Reserved. Adobe Confidential. 17
Why We're Introducing DEI in an Evolving Landscape
Before the COVID-19 pandemic: In today’s reality:
• The digital economy has been growing faster than the economy as a • Economic policymakers need fast turn-around insights to manage a global
 whole. health and economic crisis.
• Inflation has been historically low—influenced by falling prices • Online shopping has become the primary means of commerce
 online. populations around the world as purchases previously made in person are
• Online shopping has been converging with offline as click-and-collect, shifted online.
 one-day shipping, and other services let people transact online for a • Shoppers' baskets have shifted toward items related to health, working
 wider variety of goods and services. from home, and social distancing.
• Mobile shopping has allowed people to shop and buy from anywhere • Companies are adjusting to daily changes in demand, supply, and labor
 at any time.
 availability.
• Online shoppers have become accustomed to being able to compare
 • With the global economy rapidly evolving we need a metric and
 and buy products around the world and have them shipped to their
 supporting insights that can help consumers, citizens, companies, and
 door.
 policy makers assess their economic world and make intelligent, informed
• Similarly, e-commerce companies have come to expect competition choices about how to help themselves and others.
 from around the world.
• In this growing global digital economy we need a metric that can
 track online prices across nations and enables consumers, companies,
 and policy makers to understand the trends, similarities, and
 differences across industries and countries.

 ©2020 Adobe. All Rights Reserved. Adobe Confidential.
Measuring the 21st-Century Economy
A snapshot of the DEI Why we’re uniquely qualified to build the DEI
• It’s a measure of increasing consumer buying in the digital world, starting • Only we have the data from trillions of visits, tens of millions of products, and
 with the U.S. and growing to cover the world’s major economies. thousands of retailers needed to assess the global digital economy.
 • Our Adobe Sensei AI capability can take all this data and process it in near real-time to
• It uses this metric to explore our global digital lives, from when to buy a
 give high-speed insights.
 new TV, to which countries pay most for organic produce.
 • We’re trusted by multiple companies to create this index.
• Through the it we're able to establish the digital purchasing power (DPP)
 • Only Adobe is trusted by the economists and academics that can use this data to make
 that informs consumers' buying power online for various goods.
 a real difference in the world.
Why the DEI is important How DEI can help
• The world economy is interconnected, especially the digital economy, and • Consumers get a better understanding of their digital world—when to buy, what to
 it needs metrics that reflect that relationship. buy, and how digital commerce is changing their lives.
• Consumers, companies, and policy makers need a high-speed, detailed, • Companies get a better understanding of local and global trends, allowing them to
 reliable, global source of insight to inform their choices. anticipate and manage across international businesses.
 Policy makers get a much-needed rapid read on the digital economy and key data that
What sets the DEI apart •
 can be used to anticipate broader economic trends.
• Its insights are fast and accurate.
• Its insights are based on what consumers actually purchase, rather than
 surveying respondents about products they've purchased without
 controlling for quantity (how BLS calculates CPI).
• Its data spans the globe.

 ©2020 Adobe. All Rights Reserved. Adobe Confidential. 19
What the Digital Economy Index Measures

• The DEI calculates digital purchasing power (DPP) by country.
• Digital purchasing power measures how much more people can
 buy with a dollar, euro, real, pound, yen, etc. online now versus a
 year ago.
• For example, if DEI for the U.S. is up by 2 percent, then $1.00
 spent online now will buy you what $1.02 would have bought
 you a year ago.
• The DEI is always weighted by what people actually spend
 online:
 • As computers become less expensive, total online purchasing power
 will go up quickly because a good portion of what people buy online is
 computers.
 • But a rise in the price of pet products wouldn’t affect purchasing power
 much, because people spend relatively little on pet products online.
• Economies with fast-growing DEIs are making more and better
 goods available to their online consumers more cheaply.
• Because Adobe’s DEI looks at what people actually buy, it allows
 reasonable comparisons between global economies.

 ©2020 Adobe. All Rights Reserved. Adobe Confidential. 20
©2020 Adobe. All Rights Reserved. Adobe Confidential. 21
©2020 Adobe. All Rights Reserved. Adobe Confidential. 22
©2020 Adobe. All Rights Reserved. Adobe Confidential. 23
©2020 Adobe. All Rights Reserved. Adobe Confidential. 24
Methodology and Partnerships We’ve partnered with economists Austan Goolsbee and Pete Klenow to contextualize and analyze the output from the DEI. Austan Goolsbee, University of Chicago Robert P. Gwinn Professor of Economics at the University of Chicago's Booth School of Business Formerly served as President Obama’s Chairman of the Council of Economic Advisers Pete Klenow, Stanford University Professor at Stanford University’s Department of Economics Currently visiting scholar, Federal Reserve Bank of San Francisco Member of editorial boards for Econometrica, American Economic Review, Quarterly Journal of Economics, and more ©2020 Adobe. All Rights Reserved. Adobe Confidential. 25
Formula for the DEI

The base formulation for the DEI is informed by the Fisher Price Index:
 • The Fisher Ideal Price Index uses quantities purchased on the current period (month) and a previous period
 (previous month) to determine actual consumer’s preferences. Instead of assuming that consumers’ preferences
 for what goods to buy are constant over a certain number of years, it's able to account for the fact that they are
 constantly changing what they buy.

 ∑ =1 −1 ∑ =1
 Fisher πt = ∗
 ∑ =1 −1 −1 ∑ =1 −1

 ©2020 Adobe. All Rights Reserved. Adobe Confidential. 26
How the DEI Benefits Consumers

• Consumers can get valuable guidance from the DEI, like
 the best times to buy appliances, TV’s or cameras. Our
 holiday report already featured DEI insights during the
 Q4 shopping season, and it provides guidance on the
 best days to buy hot-selling items.

• The DEI initiative will expand the product categories
 and geographic scope of our pricing data, which will
 allow consumers to tap into the best days to buy a wider
 assortment of goods, wherever they are in the world.

• Lastly, the DEI will help contextualize the pricing that
 consumers are observing on certain goods, as well as
 how these price changes may fluctuate and impact
 them in the future.

 ©2020 Adobe. All Rights Reserved. Adobe Confidential. 27
How the DEI Benefits Companies
• Companies can gain valuable insights from the DEI, like how digital economies are different in the U.S. versus
 UK, especially when it comes to apparel, grocery items, and a host of other product categories.

• The DEI shows movement in global prices that require context and comprehensive tracking, so that
 companies can gain visibility into the market forces that are impacting their consumers and clients.

• Companies will be able to see how their pricing strategies will impact and be reflected in global pricing trends
 both inside and outside their own product/goods categories.

• Quantity data that the DEI initiative uncovers will illuminate how product demand is being impacted by price
 and how consumers are substituting one type of good for another.

• The speed at which DEI data is populated will allow them to be more reactive to emerging pricing trends. In
 some cases the data will be predictive, which will be even more valuable to organizations everywhere.

 ©2020 Adobe. All Rights Reserved. Adobe Confidential. 28
DEI Data for Leading Thinkers and Institutions

• We will make our DEI data feeds available to governmental institutions and organizations that develop
 policy and provide economic guidance.

• Organizations that are looking for ways to more accurately understand the digital economy will be able
 to use real-time data to analyze the rapid-impact events like COVID-19 that are happening both
 domestically and globally.

• This data will be providing will be a combination of pricing and product-level category data to help
 economic institutions better determine which parts of the digital economy can best predict inflation, as
 well as how consumer baskets are shifting.

• These data feeds will be provided on a biweekly cadence to most organizations so that they can be more
 responsive to shifts happening within different sectors.

 ©2020 Adobe. All Rights Reserved. Adobe Confidential. 29
How the DEI Benefits Policy Makers

• Policy makers can get guidance from the DEI, especially in categories where digital data predict changes
 in the broader economy.

• The DEI can look at prices mapped across a national census framework. This allows for pricing and product
 sales insights across urban and rural regions, high- and low-income segments, and diverse and non-
 diverse populations. Ultimately, this allows policy makers to understand the pricing effects being experienced
 by different constituencies.

• Policy makers can develop plans based on the DPP metric we’re tracking to determine the buying power
 consumers are experiencing over time.

• The DEI will be trended against the CPI to help paint a clear picture of whether consumers are experiencing
 better pricing offline or online. As a result, policy makers will be able to make the case to expand broadband
 and bring connectivity to regions in need of favorable pricing on goods that were not accessible online before.

 ©2020 Adobe. All Rights Reserved. Adobe Confidential. 30
You can also read