LAUNCH PRESENTATION 7th APRIL 2020 - Advertising Media Forum
←
→
Page content transcription
If your browser does not render page correctly, please read the page content below

LAUNCH PRESENTATION
      7 APRIL 2020
       th
COMPLETE READER MEASURE

  The most complete
    measurement of
   reader audiences,
across all platforms, to
    inform effective
advertising investment

                  COMPLETE READER MEASURE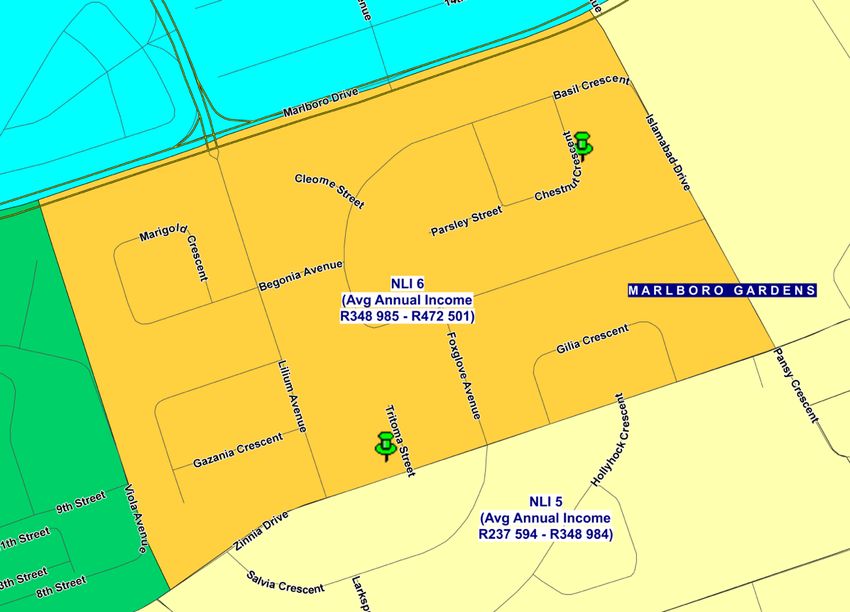
IN LINE WITH GLOBAL BEST PRACTICE

        PAMS provides an innovative
            “Gold Standard”
      Reader Audience Measurement,
        founded on global and local
           best-in-class practice,
          expertise and resources

                 GLOBAL BEST PRACTICE
SURVEY DETAILS
SURVEY DETAILS
•    Fieldwork: 1 August 2019 – 4 December 2019

•    Total sample of 15 250

•    Weighted to the 2019 GeoTerraImage (GTI) population of 41 874 000
     (Adults 15+)

•    Publications measured:

      Newspapers        Magazines          Online News      Total
                                               Sites
           50                 70                12          132

                                   SURVEY DETAILS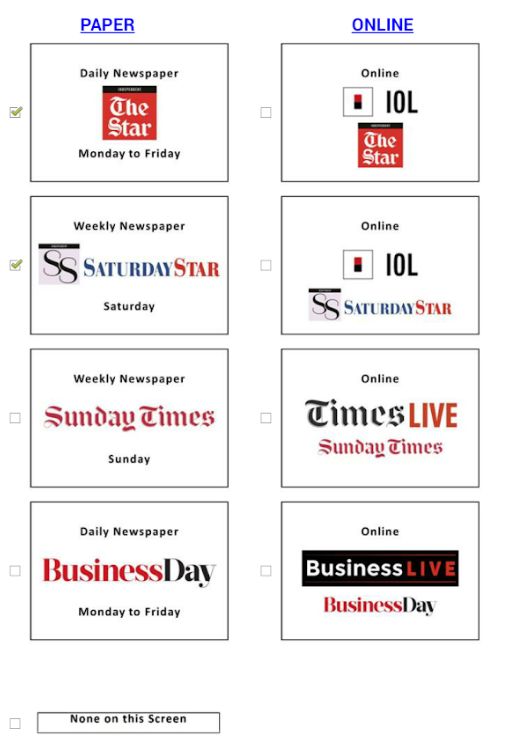
FLOODING – INCREASED SAMPLE BY 50%

Significant cost efficiency generated through flooding methodology

         10 000               1,5            15 250
                         Average           Total
        Households
                         Flooded Rate      Respondents

                             FLOODING
FLOODING – ACTUALLY REDUCES READERSHIP BY 4%

                                                - 3.9%                 - 4.3%
  61
                           57                     57
                                                                         53
       44   47
                                41   43                       44                     41
                                                         41                     38

  PAMS 2017                PAMS 2019                 PAMS 2017             PAMS 2019
                 PRIMARY                                      TOTAL SAMPLE

                           Total     Newspapers          Magazines
                                                                                 Source: PAMS 2019

                                          FLOODING
A SINGLE DATABASE THROUGH IMPUTATION

      PRIMARY SAMPLE                       FLOODED SAMPLE
          10 000                                5 250

         Reading                               Reading
       Demographics                          Demographics

                                                Imputed
     Products + Services
                                           Products + Services

                           Single PAMS
                           2019 Datafile
                              15 250

                           IMPUTATION
SAMPLE AND
WEIGHTING
NEW INNOVATIVE SAMPLING DESIGN

        The PRC introduced a new innovative
            sampling design for PAMS 2019

         Income was used as an additional
                 sampling variable

               SAMPLING AND WEIGHTING
NEW SAMPLING VARIABLE
• The Neighbourhood Lifestyle Index®© (NLI™©), developed by GTI, was used
• The NLIs are developed by using more variables, than only household income
• Other variables used include e.g. Type of Dwelling and Household Size
• As income is one of the main variables, the groups are expressed in income intervals
NLI %
1-3 (R0 – R11 159) 50
4-6 (R11 160 – R39 691) 30
7-10 (R39 692 +) 20
SAMPLING AND WEIGHTINGDISPROPORTIONAL DESIGN IN LINE WITH INCOME SHARE
9
3
30 9
15 18
44
6
30 55 14 62
79
26
Metro Urban Rural Black Coloured Indian White
SAMPLING AND WEIGHTING100% OF MUNICIPALITIES SAMPLED
PAMS 2019
coverage…
All 233
Municipalities sampled
SAMPLING AND WEIGHTINGSAMPLE POINTS STRETCHED TO MAXIMISE DIVERSITY
Limited to
Points of 2
per Enumerated
NLI 6
Avg Annual Income
Area (EA)
R348 985 – R472 501
And stretched to
NLI 5
maximise diversity
and national
Avg Annual Income
R237 594 – R348 984
representivity
SAMPLING AND WEIGHTINGNEW INNOVATIVE SAMPLING DESIGN
“I have audited TAMS over the past few years as well as specific parts of the
Establishment Survey in South Africa. I can confirm that the PAMS 2019 sample
design as developed by Prof. Ariane Neethling seems to be well adapted to the
particular socio-economic landscape of the South Africa market. The innovations
adopted in terms of appointing a new demographic data partner GTI to provide
very accurate population movements into metro areas, combined with the
inclusion of the PRC inspired income sampling and weighting should result in a
well-balanced and efficient sample is in line with global best practice.
In my opinion the sampling is well designed for the particular socio-economic
landscape of the South African market.”
- ROBERT RUUD Auditor 3M3A
SAMPLING AND WEIGHTINGHYBRID OF CELL AND RIM WEIGHTING
• An Interlaced Random Iterative Method (RIM) approach was used – a hybrid of cell
and RIM weighting, with a design pre-weight including income
CELL WEIGHTING RIM WEIGHTING
Design
pre-weight
with Income
Interlaced demographic control, for in-depth analysis reliability
SAMPLING AND WEIGHTINGWEIGHTING EFFICIENCY
74% 70%
International Standard
Measure of how well PAMS sample is aligned to the population
SAMPLING AND WEIGHTINGQUESTIONNAIRE DESIGN
QUESTIONNAIRE FLOW
1 PLATFORM FILTER 2 Computer Assisted Self- 3 ROUTING 4 PRODUCT/
Interviewing (CASI)
SELF-SELECTION PAPER/ONLINE BRAND/RETAIL
QUESTIONS BEHAVIOUR
On Paper
On a Cellphone Frequency Mobile/Online
On a Computer When Last for Average behaviour
On a Tablet Issue Readership (AIR) Motoring/Financial
On another device Pick ups Retail: Food and
None of these Origin of Copy Groceries/Furniture and
Time Spent Reading Appliances/Clothing
Device/Platform
QUESTIONNAIRE DESIGNCASI – SELF-SELECTION OF TITLES
Design
• Masthead rotations
• Only 4 titles per screen
• Newspaper prompts regionalised by province
• Shortens questionnaire length
• Publications reported by Platform and in Total
• Increases respondent interest
• Saves time
Outcome
• Removes bias
• More focus on EACH title
• Zero incompletes
• More “Niche” publications hitting the radar
• Removes status induced over-claim
QUESTIONNAIRE DESIGNQUESTIONNAIRE CHANGES
NEW BENCHMARK FOR PAMS 2019
Ø PAMS 2019 data is not comparable to PAMS 2017 – even the Paper
measure:
§ Questionnaire changes
§ Dual Online newspaper masthead prompts
§ New Sample Design using Income
QUESTIONNAIRE CHANGESEXPANSION OF VISUAL ONLINE PROMPTS
DEFINITION OF READING
ALL PLATFORMS DIGITAL ONLY
By Reading we mean, that you have personally read, paged Now, thinking about your online reading or viewing of
through or viewed all or any part of any of these, for one news/stories/features/articles on a website, an App or on
minute or longer. social media.
You could have read a paper version, including any of the You might have been using a cellphone, computer, tablet
separate parts or sections that come with it, OR you could or any other device with internet access.
have read these online on your cellphone, computer or You could have been anywhere - at home, at work, at an
tablet. internet cafe, at a friend’s place or out and about. It does
It does not matter if you paid for them or if they were free. not matter how much or how long you have spent reading
It also does not matter where you read them. or viewing content online.
QUESTIONNAIRE CHANGESEXPANSION OF VISUAL ONLINE PROMPTS
PLATFORM FILTER QUESTION
NEWSPAPER or ONLINE NEWS SITE MAGAZINE or ONLINE MAGAZINE CONTENT
B1. In which of these ways, if any, have you B2. In which of these ways, if any, have you
personally read, paged through or viewed any personally read, paged through or viewed any
copy of a NEWSPAPER or ONLINE NEWS SITE, at copy of a MAGAZINE or ONLINE MAGAZINE
least once, in the PAST 12 MONTHS - for one CONTENT, at least once, in the PAST 12 MONTHS -
minute or longer? for one minute or longer?
q On Paper
q On a Cellphone (Website/App/Social Media)
q On a Computer (Desktop/Laptop) (Website/App/Social Media)
q On a Tablet (Website/App/Social Media)
q On another device (Website/App/Social Media)
q None of these
QUESTIONNAIRE CHANGESMASTHEADS
NEWSPAPER MASTHEADS
DUAL ONLINE MASTHEADS
q Dual mastheads were incorporated for online
newspapers, as per PAMS 2018 Pilot results
q Umbrella Sites were positioned above Actual Title
q Actual Title was smaller than the Umbrella Site
QUESTIONNAIRE CHANGESWORDING CHANGE
ISSUE/COPY
NUMBER OF ISSUES
q In the frequency question, first
B4. For each paper copy/issue of the Newspaper and/or reference became “copy/issue”
Magazine you have read or paged through in the PAST 12
MONTHS, I am going to ask you about the number of different
copies/issues you normally read or page through over a certain
period of time. q Subsequent reading questions refer
to “copy” only
B4a. Thinking of ….. (MENTION DAILY NEWSPAPER), there are FIVE
copies published from MONDAY to FRIDAY.
How many different copies do you normally read or page q This is in line with PAMS 2018 Pilot
through? findings
NUMBER OF COPIES OUT OF 5:
QUESTIONNAIRE CHANGESUPDATED INCOME
HOUSEHOLD INCOME
Please tell me into which of these categories you estimate that your TOTAL monthly HOUSEHOLD
INCOME falls? By this I mean the total income of all members in your household before tax or any other
deductions. Please include all sources of Income i.e. salaries, pensions, government grants, rentals,
informal trading, ‘stokvels’, income from investments and family.
q R1 - R999
q R20 000 - R24 999
q R1 000 - R1 999
q R25 000 - R29 999
q R2 000 - R2 999
q R30 000 - R39 000
q R3 000 - R3 999
q R40 000 - R49 000
q The first income group changed to R1 – R999
q R4 000 - R4 999
q R50 000 - R59 000
q R5 000 - R5 999
q R60 000 - R79 999
q R6 000 - R7 999
q R80 000 - R99 999
q R8 000 - R9 999 q Top group expanded to R100 000
q R100 000 +
q R10 000 - R11 999
q Don’t know
q R12 000 - R13 999
q Refused
q R14 000 - R15 999
q R16 000 – R19 999
QUESTIONNAIRE CHANGESUPDATED INCOME
PERSONAL INCOME
R11. And can you tell me into which of these categories you estimate that
your total monthly PERSONAL INCOME falls? This is before tax or any
other deductions. q The first income group changed
to
q R1 - R999 q R20 000 - R24 999
q R1 000 - R1 999 q R25 000 - R29 999 R1 – R999
q R2 000 - R2 999 q R30 000 - R39 000
q R3 000 - R3 999 q R40 000 - R49 000
q R4 000 - R4 999 q R50 000 - R59 000
q R5 000 - R5 999 q R60 000 - R79 999 q Top group was expanded to
q R6 000 - R7 999 q R80 000 - R99 999 R100 000+
q R8 000 - R9 999 q R100 000 +
q R10 000 - R11 999 q No Personal Income
q R12 000 - R13 999 q Don’t know
q R14 000 - R15 999 q Refused q New option was included for
q R16 000 – R19 999 “No Personal Income”
QUESTIONNAIRE CHANGESNEW QUESTIONS
FINANCE LOYALTY/STORE CARDS
F1. Do you personally have/make use of a SASSA government J3. Which of these store cards, if any, do you PERSONALLY
grant card? have, which may earn you loyalty points or give you
discounts?
q Yes
q No q Ackermans
q Clicks
q Dis-Chem
F4. Do you personally make use of a credit card from a q Edgars
financial institution? This includes all Visa and Mastercard, as q Jet
well as American Express, Diners Club, Discovery credit card. q Makro
q Pep
q Yes q Pick ‘n Pay
q No q Spar
q Woolworths
q Other
q None
QUESTIONNAIRE CHANGESNEW QUESTIONS
ADDITIONAL LISTENING QUESTION ADDITIONAL VIEWING QUESTION
K2. On average, how many hours per day do you personally L2. On average, how many hours per day do you personally
listen to the radio? watch television?
q Less than one hour q Less than one hour
q 1 - 2 hours q 1 - 2 hours
q 3 - 4 hours q 3 - 4 hours
q More than 4 hours q More than 4 hours
QUESTIONNAIRE CHANGESNEW QUESTIONS
INFLUENCER QUESTION
M1. Here are a few comments that other people have made about themselves. For each one, please indicate how
well it describes you, using the options on the screen.
STATEMENTS
• I would like to believe that I am better informed and up to • I like to keep abreast of the changes in my industry and
date on what’s going on in South Africa at the moment than read quite a bit to stay informed
the average person • I have more followers on Twitter than most, and tweet
• I have more friends on Facebook than most people often
• I earn and think more than most South Africans • I am one of the decision-makers at my place of work when
• I have been quoted by my friends or in the media on a few it comes to buying products and services
occasions • I am on at least one committee at work, the kids’ school, a
• People sometimes ask me for my opinion or advice local society or sport club, our neighbourhood
QUESTIONNAIRE CHANGESNEW QUESTIONS
VOTING INTERVIEWER OBSERVATION
R16a. Did you vote in the 2019 General Election? P2a. TYPE OF HOME?
q Yes q House (free-standing)
q No q Cluster/Townhouse
q Flat (in a block of flats)
q Matchbox/RDP house
q Traditional Hut
R16b. Are you registered to vote? q Hostel/Compound
q Single room in a larger dwelling or backyard
q Yes q Temporary structure/Shack
q No q Other
P2b. ELECTRICITY IN HOME?
q Yes
q No
QUESTIONNAIRE CHANGESEXCLUSIONS
STORE MAGAZINES WERE EXCLUDED FROM
PAMS 2019
QUESTIONNAIRE CHANGESAVERAGE ISSUE READERSHIP (AIR)
BASED ON RECENCY
Paper AIR Online AIR
Last read in Issue period Last read in 7 days
Last read in 4 weeks
Total Multi-platform AIR
(7 Day online/4 week online)
AIRMULTIPLE PICK-UPS
OPPORTUNITIES TO SEE (OTS)
B6. Thinking about the paper copy of Sunday B6. Thinking about the paper copy of BONA you
Times you last read, how many times did you last read, how many times did you pick it up
pick it up before you finished with it? before you finished with it?
q Once only q Once only
q 2 - 3 times q 2 - 3 times
q 4 - 5 times q 4 - 5 times
q 6 or more times q 6 or more times
QUESTIONNAIRE ELEMENTSNUMBER OF PICK-UPS
Average number 2.1 2.3 2.7 2.8
Pick-ups
13 17
25 28
39
41
44 40
49 42
31 32
DAILY NEWSPAPER WEEKLY NEWSPAPER WEEKLY MAGAZINE MONTHLY MAGAZINE
Once only 2-3 times 4 or more times
Based on 12 month Readers Source: PAMS 2019
QUESTIONNAIRE ELEMENTSTIME SPENT READING (TSR)
B8. Thinking of your reading of Daily Dispatch, on B6. Thinking of your reading of Kuier, on average,
average, how long do you spend reading or paging how long do you spend reading or paging through
through the paper copy of Daily Dispatch? the paper copy of Kuier?
q Less than 30 minutes q Less than 30 minutes
q Between 30 minutes – 1 hour q Between 30 minutes – 1 hour
q Between 1 - 2 hours q Between 1 - 2 hours
q Between 3 - 4 hours q Between 3 - 4 hours
q 4 hours or more q 4 hours or more
Source: PAMS 2019
QUESTIONNAIRE ELEMENTSTIME SPENT READING
Average time 51 60 71 69
minutes
33 28
37 36
45 35
45 41
21 27 23 29
DAILY NEWSPAPER WEEKLY NEWSPAPER WEEKLY MAGAZINE MONTHLY MAGAZINE
Less than 30 min 30 min - 1 hours
Based on 12 month Readers Source: PAMS 2019
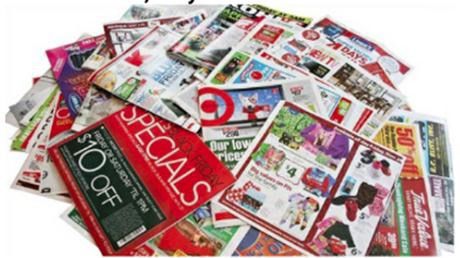
QUESTIONNAIRE ELEMENTSUSAGE OF ADVERTISING INSERTS/LEAFLETS
Thinking about advertising pamphlets, leaflets
%
or inserts such as these, do you…
• Use them to compare prices 61 %
• Use them to plan your shopping 53 %
• Buy products as a result of seeing them 33 %
• Glance or page through to see if anything
33 %
interests you
• Don’t look at them 12 %
Source: PAMS 2019
QUESTIONNAIRE ELEMENTSTOPICS/INTERESTS QUESTION - NEWSPAPERS
Community News/Local News 44
SA News/Current Affairs 43
%
Sport 42
Jobs/Careers 40
Celebrity news 37
Politics 36
Health/Fitness 33
Education 32
International news 30
Food/Recipes 30
Beauty & Fashion 27
Advertising 23
Technology 22
Business/Economic/Company news 22
Entertainment/Movies/TV/Book… 21
Motoring 20
Comics/Cartoons/Crossword puzzles 19
Property 19
Travel 19
Personal Finance 16
Home/Gardening/DIY 15
Source: PAMS 2019
QUESTIONNAIRE ELEMENTSTOPICS/INTERESTS QUESTION - MAGAZINES
Real life stories 43
%
Celebrities 37
Sports 36
Food, Cooking and Baking 32
Health , Fitness, Weight loss 31
Fashion and Beauty 29
Wellness and Relationships 27
Careers, Jobs and Appointments 27
International News 26
TV guides 24
Home Décor and Gardening 20
Holidays and Travel 19
Motoring 19
Technology, Gadgets and Hobbies 18
Financial and Business 16
Agriculture 16
Personal Finance and Investment 15
Pregnancy, Baby and Parenting 14
Source: PAMS 2019
QUESTIONNAIRE ELEMENTSKEY DEMOGRAPHICS
SOCIO-ECONOMIC MEASURE (SEM)

        Establishment Survey (ES) 2019B       PAMS 2017         PAMS 2019                    %

          16
12                  12 13    10 12
9                                     10 10     9 10    11 11                           10
         14                                                       89        79
                    13                                                                       8
           11                10       11       11         9
5                                                                 7         6            8

SEM 1    SEM 2    SEM 3     SEM 4    SEM 5    SEM 6    SEM 7    SEM 8   SEM 9        SEM 10

                                                                                Source: PAMS 2019

                                  KEY DEMOGRAPHICS
LIVING STANDARDS MEASURE (LSM)
PAMS 2017 PAMS 2019 %
28
19 28
13
11 18 8
14 8 7
4 11
1 2 8 9
0 6
2 4
LSM 1 LSM 2 LSM 3 LSM 4 LSM 5 LSM 6 LSM 7 LSM 8 LSM 9 LSM 10
Source: PAMS 2019
KEY DEMOGRAPHICSEMPLOYMENT HIGHER AMONGST READERS
PAMS 2017 PAMS 2019
28 27
%
Working Full Time 34 Working Full Time 30
Working Part Time 9 Working Part Time 8
9 8
Housewife/Husband 7 Housewife/Husband 7
6 6
Unemployed 33 Unemployed 33
28 31
Student 14 Student 14
15 15
Retired 10 Retired 11
8 9
Total Readers Total Readers
Source: PAMS 2019
KEY DEMOGRAPHICSEDUCATION HIGHER AMONGST READERS
PAMS 2017 PAMS 2019
%
Up to Primary School 12 Up to Primary School 12
complete 5 complete 7
42 40
Some High School Some High School
37 40
33 33
Matric Matric
39 36
14 15
Any Tertiary Education Any Tertiary Education
19 17
Total Readers Total Readers
Source: PAMS 2019
KEY DEMOGRAPHICSMONTHLY HOUSEHOLD INCOME
TOTAL READERS
PAMS 2017 PAMS 2019 PAMS 2017 PAMS 2019
% % % %
Up to R4 999 43.0 36.0 38.8 32.8
R5 000 to R9 999 25.9 27.6 27.3 27.7
R10 000 to R19 999 18.0 19.4 19.5 20.3
R20 000 to R39 999 8.8 11.0 9.6 12.2
GTI
R40 000 to R59 000 2.9 4.1 3.3 4.8
NLI Average
R60 000 to R79 999 0.8 1.0 0.9 1.1 R13 181
R80 000 to R99 000 0.5 0.5 0.6 0.6
R100 000 + 0.4 0.5
Average R10 837 R13 230 R11 616 R14 411
+ 22% + 24% Source: PAMS 2019
KEY DEMOGRAPHICSRESULTS
PAMS READER UNIVERSE

    The figures in this presentation
      only reflect the publications
           measured in PAMS

                                       Source: PAMS 2019

                 RESULTS
FROM PAPER TO PHONE
25.2M 5,2M 2.0M
Device used for Online:
Cellphone 16.4 %
Paper Only Paper & Online
78 % Online Only Computer 1.8 %
(2017) (85%) 16 % 6% Tablet 0.6 %
(12%) (3%)
R11 563 R22 120 R23 575
Based on
12 month Readers 38 years 33 years 33 years Source: PAMS 2019
RESULTSNEWSPAPER PLATFORM OVERLAP AND CHANGE
23.5M 4.1M 2.9M
Paper Only Paper & Online
77 % Online Only
(2017) (85%) 14 % 9%
(11%) (4%)
R11 358 R20 947 R25 324
38 years 33 years 33 years Source: PAMS 2019
Based on 12 month Readers
RESULTSMAGAZINE PLATFORM OVERLAP AND CHANGE
19.7M 2.4M 1.9M
Paper Only Paper & Online
82 % Online Only
(2017) (88%) 10 % 8%
(9%) (3%)
R13 043 R24 281 R23 494
37 years 32 years 32 years Based on 12 month Readers
Source: PAMS 2019
RESULTSTOTAL READERS
12 MONTHS
TOTAL AUDIENCE 33.8M 32.4M
%
84
77
PAMS 2017 Total PAMS 2019 Total
Source: PAMS 2019
RESULTSTOTAL READERS
AIR
TOTAL AUDIENCE 22.8M 22.2M
%
57
53
PAMS 2017 Total PAMS 2019 Total
Source: PAMS 2019
RESULTSTOTAL READERS
STEPDOWN
% VARIANCE 28 % 24 %
%
84
77
57 53
PAMS 2017 PAMS 2019
12 MONTH AIR
Source: PAMS 2019
RESULTSREADING PLATFORMS
PAST 12 MONTHS
None
Paper Cellphone Desktop/Laptop Tablet
Computer
PAMS 2017 TOTAL 82 10 2 1 %16
Newspapers 73 9 2 1 23
Magazines 62 6 1 1 36
PAMS 2019 TOTAL 72 16 2 1 23
Newspapers 66 16 2 1 27
Magazines 53 10 1 1 43
Source: PAMS 2019
RESULTSAVERAGE NUMBER OF PUBLICATIONS
PAMS 2017 PAMS 2019
PAPER ONLINE TOTAL PAPER ONLINE TOTAL
2.0 2.6 2.2 2.0 2.5 2.3
2.6 3.1 2.8 2.7 3.2 3.1
+ 3.3 4.1 3.6 3.5 4.2 4.1
Source: PAMS 2019
RESULTSNEWSPAPERS
NEWSPAPERS AIR
Total Audience (000)
PAMS 2017                       8 756                      11 797              16 251
PAMS 2019                       8 560                      12 514              16 082
ABC PAPER % CHANGE             - 21.1%                 - 22.6%                 - 22.1%

                                         PAMS 2017    PAMS 2019                           %

                                                                    41        38
                                              29      30
               22          20

                   Any Daily                  Any Weekly            Any Newspaper
                                                                                    Source: PAMS 2019

                                             NEWSPAPERS
NEWSPAPERS AIR
Total Audience (000)
PAMS 2017 8 756 11 797 16 251
PAMS 2019 8 560 12 514 16 082
ABC PAPER % CHANGE - 21.1% - 22.6% - 22.1%
PAMS 2017 PAMS 2019 %
37 32 41 38
27 25 29 30
18 15 22 20
5 6 7 6 9
4
Paper Online Total Paper Online Total Paper Online Total
Any Daily Any Weekly Any Newspaper
Source: PAMS 2019
NEWSPAPERSRANKINGS – DAILY NEWSPAPERS
PAMS 2017 PAMS 2019
Daily Sun 3,821 Daily Sun 3,891
Sowetan 1,261 Isolezwe 1,296
Isolezwe 1,154 Sowetan 1,171
Son 849 Son 736
The Star 679 Business Day 526
The Times 517 The Citizen 502
Daily Voice 434 Daily Voice 483
The Citizen 345 The Star 466
Business Day 338 Beeld 403
Daily News 310 Daily Dispatch 240
Beeld 287 The Herald 220
The Mercury 269 The Mercury 202
Thousands
Source: PAMS 2019
NEWSPAPERSRANKINGS – WEEKLY NEWSPAPERS
PAMS 2017 PAMS 2019
Soccer Laduma 3,629 Soccer Laduma 4,605
Sunday Times 3,097 Sunday Times 3,481
Sunday Sun 2,097 Sunday Sun 2,520
City Press 1,698 City Press 2,055
Sunday World 1,375 Sunday World 1,302
Ilanga LangeSonto 1,134 Isolezwe ngeSonto… 1,210
Isolezwe ngeSonto (Sun) 1,111 Ilanga LangeSonto 1,102
Rapport 1,029 Rapport 971
Isolezwe ngoMgqibelo… 911 Ilanga 928
Ilanga 894 Mail & Guardian 914
Vuk'uzenzele 825 Vuk'uzenzele 854
Mail & Guardian 743 Isolezwe… 799
Thousands
Source: PAMS 2019
NEWSPAPERSMAGAZINES
MAGAZINES AIR
Total Audience (000)
PAMS 2017                 8 063                 13 143              16 712
PAMS 2019                 7 166                 13 080              16 316
ABC PAPER % CHANGE     - 21.1%                 - 18.5%              - 21.1%

                                  PAMS 2017   PAMS 2019                         %

                                                          42       39
                                      33       31
            20         17

             Any Weekly               Any Monthly         Any Magazine
                                                                         Source: PAMS 2019

                                      MAGAZINES
MAGAZINES AIR
Total Audience (000)
PAMS 2017 8 063 13 143 16 712
PAMS 2019 7 166 13 080 16 316
ABC PAPER % CHANGE - 21.1% - 18.5% - 21.1%
PAMS 2017 PAMS 2019 %
39 35 42 39
31 27 33 31
19 15 20 17
2 3 4 6 5 8
Paper Online Total Paper Online Total Paper Online Total
Any Weekly Any Monthly Any Magazine
Source: PAMS 2019
MAGAZINESRANKINGS – MAGAZINES
PAMS 2017 PAMS 2019
KICKOFF 4,054 KICKOFF 4,566
DRUM 3,239 BONA 3,170
BONA 3,170 DRUM 2,665
YOU 2,148 TRUE LOVE 2,120
Move! 2,127 Move! 2,094
Huisgenoot 1,985 YOU 2,020
TRUE LOVE 1,975 Car 1,915
Car 1,459 Food & Home… 1,764
People 1,198 Huisgenoot 1,705
Men's Health 1,004 Men's Health 1,359
Kuier 948 People 1,039
Food & Home… 918 Women's Health 1,004
Thousands
Source: PAMS 2019
MAGAZINESINTERNET AND DEVICE
INTERNET ACCESS

                     PAMS 2017       PAMS 2019

      Total Access     55.3%           65.5%
                                                     64.7%
                                                  Source: Stats SA
                                                      General
      Cellphone        51.4%           63.5%     Household Survey
                                                       2018

      Computer         8.0%            7.7%

      Tablet           3.7%            2.3%

                                                           Source: PAMS 2019

                               MAGAZINES
INTERNET DEVICE OVERLAP
23.6M 3.0M 826k
Cellphone Only Cellphone & Computer/
86 % Computer/ Tablet Only
(2017) (81%) Tablet 3%
11 % (7%)
(12%)
R13 754 R32 463 R16 775
33 years 37 years 36 years
Source: PAMS 2019
INTERNET DEVICECELLPHONES
Smartphone Ordinary Cell Feature Cell
64% 24% 5%
TOTAL INCIDENCE 93% Source: PAMS 2019
CELLPHONE TYPERETAIL AND BRANDS
34% OF HOUSEHOLDS HAVE A MOTOR VEHICLE
NUMBER VEHICLES IN HOUSEHOLD
One
21%
Two
9%
None Three +
66% 4%
Source: PAMS 2019
MOTOR VEHICLESTOP CAR MANUFACTURERS
Toyota 22 %
Volkswagen 13
Ford 7
Nissan 7
BMW 5
Hyundai 5
Mercedes-Benz 4
Opel 4
KIA 4
Mazda 3
Audi 3
Renault 2
Honda 2
Isuzu 2
Chevrolet 2
Jeep 2
Source: PAMS 2019
RETAIL AND BRANDSMAIN BANK
Capitec Bank 29 %
ABSA 12
Capitec was
23% in 2017
First National Bank (FNB) 11
Standard Bank 9
Nedbank 7
Postbank/Posbank 1
Other 1
Don't have a main Bank 29
Source: PAMS 2019
RETAIL AND BRANDSHOUSEHOLD PURCHASES
WHOLLY/PARTLY RESPONSIBLE – DAY TO DAY PURCHASES
No
32%
(36%)
Yes
68%
(64%)
Source: PAMS 2019
RETAIL AND BRANDSTOP 3 SPEND MOST MONEY
SEM SEM SEM
1-4 5-7 8-10
% % %
Pick n Pay/
Shoprite 43 Shoprite 49 Pick n Pay 28
Hypermarket
Pick n Pay/
Boxer
19 Pick n Pay 12 Shoprite 25
Superstores
Hypermarket
Checkers/
Spar/Super Spar 14 Spar/Super Spar 12 19
Checkers Hyper
Source: PAMS 2019
RETAIL AND BRANDSFURNITURE OR APPLIANCES
BOUGHT IN PAST 12 MONTHS Game 17 %
Shoprite 17
OK Furniture 14
Mr Price Home 8
Lewis 8
Russells 7
Yes Makro 7
25% Checkers/Checkers Hyper 7
Pick 'n Pay/Pick 'n Pay… 7
Clicks 6
Bradlows 4
Ackermans 4
Hi-Fi Corporation 4
No House and Home 4
75% At Home 3
Woolworths 3
Jet Mart 3
Pep Home 3
Other outlet 29
Source: PAMS 2019
RETAIL AND BRANDSCLOTHING
BOUGHT IN PAST 6 MONTHS Mr Price/Mr Price Sport 26 %
Ackermans 18
Pep Stores 14
Jet 13
Truworths 10
Edgars/Edgars Active 10
No
Woolworths 8
35%
Markham 8
Sportscene 7
Totalsports 6
Yes Identity 5
65% Foschini 4
Studio 88 4
Legit 3
Pick 'n Pay/Pick 'n Pay… 3
Source: PAMS 2019
RETAIL AND BRANDSCLOTHING 2017 VS. 2019
Mr Price/Mr Price Sport 26
33 %
Ackermans 23
18
Pep Stores 20
14
Jet 25
13
Truworths 14
10
Edgars/Edgars Active 19
10
Woolworths 12
8
Markham 8
9 2017
Sportscene 8
6
7 2019
Totalsports 6
Identity 7
5
Foschini 6
4
Studio 88 5
4
Legit 4
3
Pick 'n Pay/Pick 'n Pay Hypermarket 3
3 Source: PAMS 2019
RETAIL AND BRANDSTHANK YOU
VISIT PRC.ZA.COM FOR A COPY OF PRESENTATION
JOSEPHINE BUYS
CEO
For research queries contact peter@prc.za.com
Unit 8 Burnside Office Park 410 Jan Smuts Ave Craighall JHB South Africa
+27 11 326 4041 +27 82 604 5940 www.prc.za.com josephine@prc.za.comYou can also read