BIRMINGHAM HEALTH PROFILES: EDGBASTON CONSTITUENCY 2019 - Birmingham City Council
←
→
Page content transcription
If your browser does not render page correctly, please read the page content below
BIRMINGHAM HEALTH PROFILES:
EDGBASTON CONSTITUENCY 2019

                              1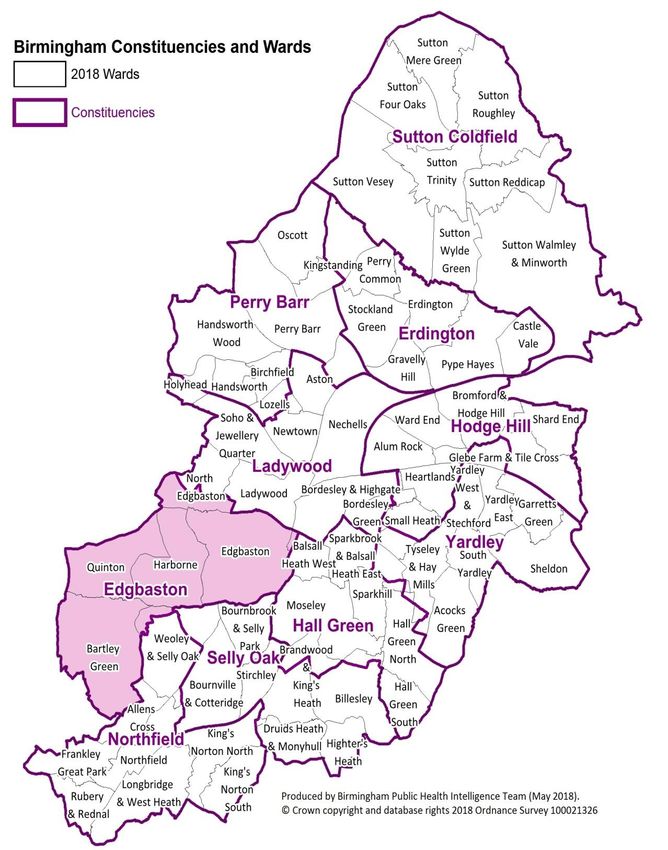
Contents
Introduction .......................................................................................................................... 3
Demographics...................................................................................................................... 4
Life Expectancy ................................................................................................................... 5
   Causes of early death ...................................................................................................... 5
Child Health ......................................................................................................................... 7
  Infant mortality .................................................................................................................. 7
   Child obesity..................................................................................................................... 8
   Educational attainment ..................................................................................................... 9
   Child protection .............................................................................................................. 10
   Children in care .............................................................................................................. 10
   Child mental health......................................................................................................... 11
Working Age Adults ........................................................................................................... 12
 Smoking ......................................................................................................................... 12
   Alcohol ........................................................................................................................... 12
   Substance misuse .......................................................................................................... 14
   Learning disability and employment ............................................................................... 15
Older Adults ....................................................................................................................... 16
  Social isolation ............................................................................................................... 16
   Pension claimants .......................................................................................................... 17
   Admissions for falls ........................................................................................................ 18
   End of life care ............................................................................................................... 19
Healthy Environment.......................................................................................................... 20
  Deprivation ..................................................................................................................... 20
   Life expectancy inequality .............................................................................................. 21
   Air quality ....................................................................................................................... 22
   Becoming a food smart city ............................................................................................ 24
Fuel Poverty....................................................................................................................... 25
Overcrowding ..................................................................................................................... 26
A&E Hospital Attendances ................................................................................................. 27
Disease Breakdowns ......................................................................................................... 28
  Cardiovascular disease (CVD) ....................................................................................... 28
   Diabetes ......................................................................................................................... 33
   Cancer............................................................................................................................ 35
   Respiratory ..................................................................................................................... 37

                                                                                                                                2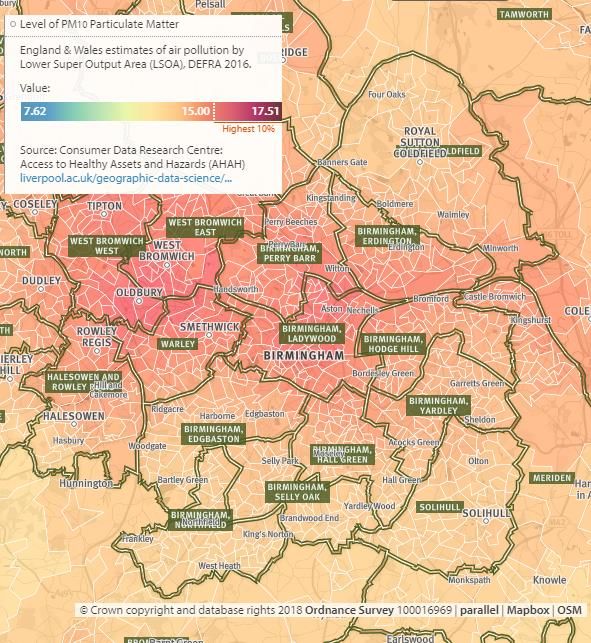
Introduction
This profile is one of a series of reports containing demographics and data relating to the
health and wellbeing of the citizens of Birmingham at a local area level.
Birmingham’s health and social care organisations use a locality model to deliver services
across the city. Birmingham has 5 localities each made up of 2 constituencies. These are:
Central: Hall Green and Selly Oak constituencies
East: Hodge Hill and Yardley constituencies
North: Erdington and Sutton Coldfield constituencies
South: Edgbaston and Northfield constituencies
West: Ladywood and Perry Barr constituencies.
Birmingham Public Health are currently consulting on a draft vision and strategy which is
to improve and protect the health and wellbeing of Birmingham’s population by reducing
inequalities in health and enabling people to help themselves. These are our draft
priorities which are underpinned by addressing health inequalities and an intention to
maximise the public health gains from hosting the Commonwealth Games in 2022.
Figure 1 – Draft Birmingham Public Health Priorities 2019
There is a variety of information available on each local area, including demographics and
public health priorities. These profiles allows health and care organisations to identify
public health issues in their local area and work with Birmingham Public Health to improve
local services.
3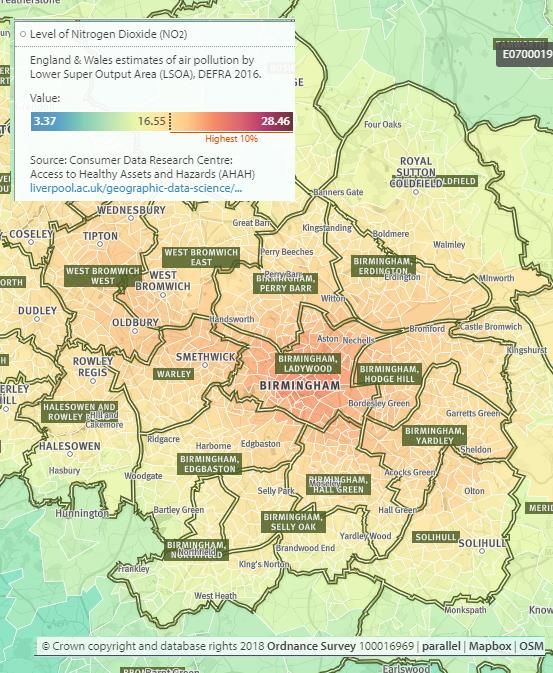
Demographics

                  Figure 2 - Edgbaston population pyramid. Source: ONS 2017MYE

It is estimated that there are approximately 105,320 people living in Edgbaston
constituency (ONS 2017 mid-year estimates) which is just over 9.3% of the total
population of Birmingham. Of these 49.4% are male and 50.6% are female. 65.6% of the
constituency population are under 45 years old. The 2011 Census estimated that 31.3%
were from Black, Asian and Minority Ethnicity groups as opposed to 42% within
Birmingham as a whole and 15% nationally.

During 2013 to 2017 Birmingham saw just over 102,000 migrants register with GPs across
the city; of these 13.5% registered at practices based in Edgbaston constituency.

                                                                                 4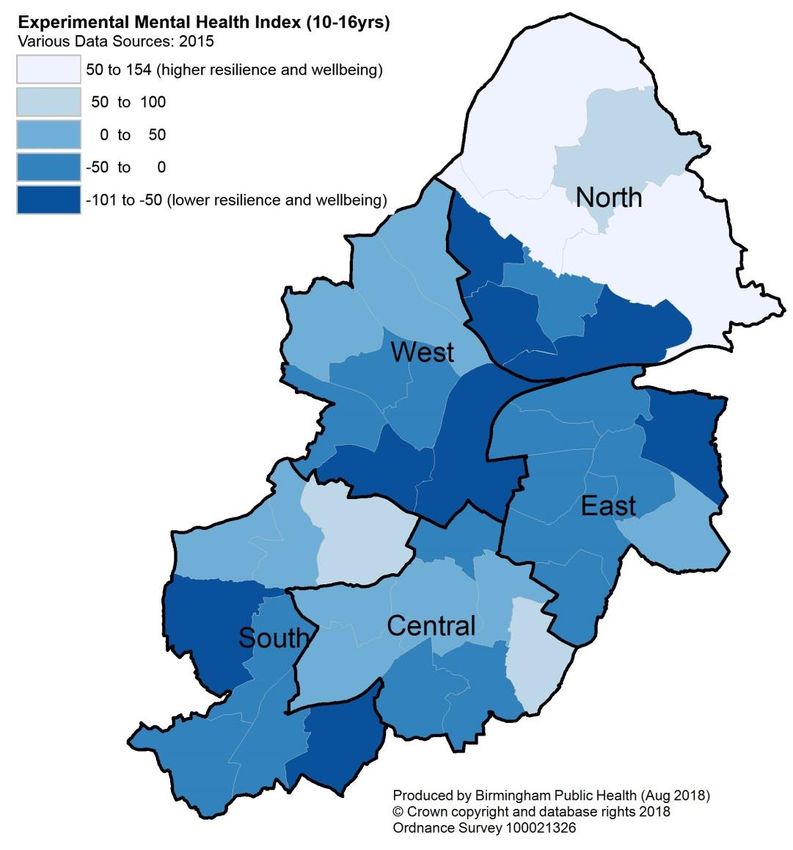
Life Expectancy
Life expectancy in Birmingham is lower than the national average. For males life
expectancy at birth is 77.2 years (England 79.5) and females 81.9 years (England 83.1).

  Figure 3 - Life expectancy forEdgbaston constituency compared to Birmingham and England. Source: ONS
                                                   Deaths

Life expectancy has increased in Edgbaston constituency over the last 10 years however it
is higher than the Birmingham but lower than England average for both males and
females.

Causes of early death
The major health conditions contributing to premature mortality can be identified by the
number of years of life lost due to people dying before the age of 75. The biggest single
contributor to excess years of life lost is infant mortality, this is discussed later in this
report, the other main causes of early death in Birmingham are coronary heart disease,
lung cancer and alcoholic liver disease.

                                                                                                 5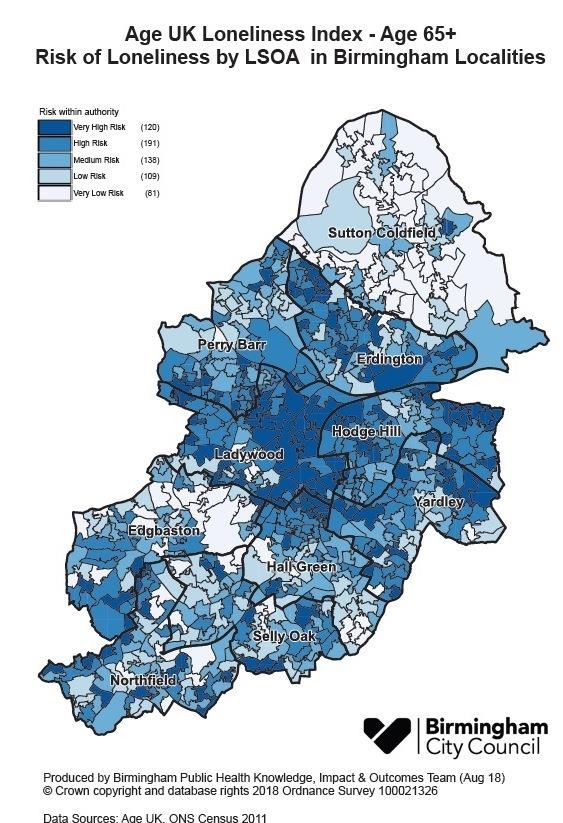
Figure 4 - Excess years of life lost in Birmingham excluding infant mortality. Source: ONS Deaths

For the three main conditions contributing to early death in Birmingham, we have
calculated the excess years of life lost for each constituency. In Edgbaston constituency
coronary heart disease is the main cause of early death with almost 1,016 excess years of
life lost between 2014-2016.
     Table 1 - Excess years of life lost for main conditions by constituency. Source: ONS Deaths 2014-16

                                            Excess Years Life Lost 2014-16
                      Constituency       Coronary                    Alcoholic
                      in South            Heart         Lung           Liver
                      locality           Disease       Cancer         Disease
                      Edgbaston               1,016           445            574
                      Northfield              1,334           904            574

                                                                                                          6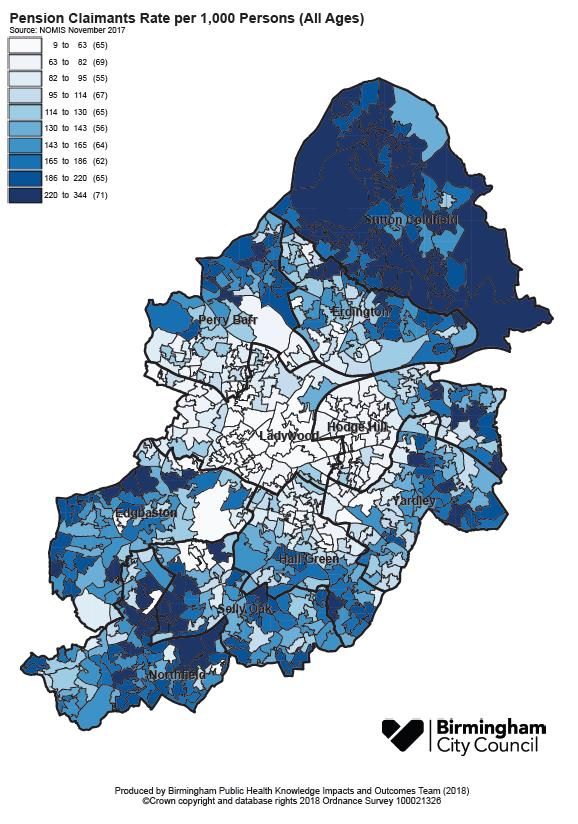
Child Health
Infant mortality
Birmingham has the worst infant mortality rate of all the local authorities in the country –
7.9 per 1,000 live births (England 3.9) (2014-2016). The rate for Edgbaston constituency
is lower than for Birmingham at 4.2 per 1,000 live births.

                Figure 5 - Infant Mortality Rate 2014-16 by ward map. Source: ONS Births

The map shows that most wards are similar to the Birmingham average which is much
higher than England. Bordesley Green, Heartlands and Ladywood wards shown in red
have a higher infant mortality rate compared to the Birmingham average.

                                                                                           7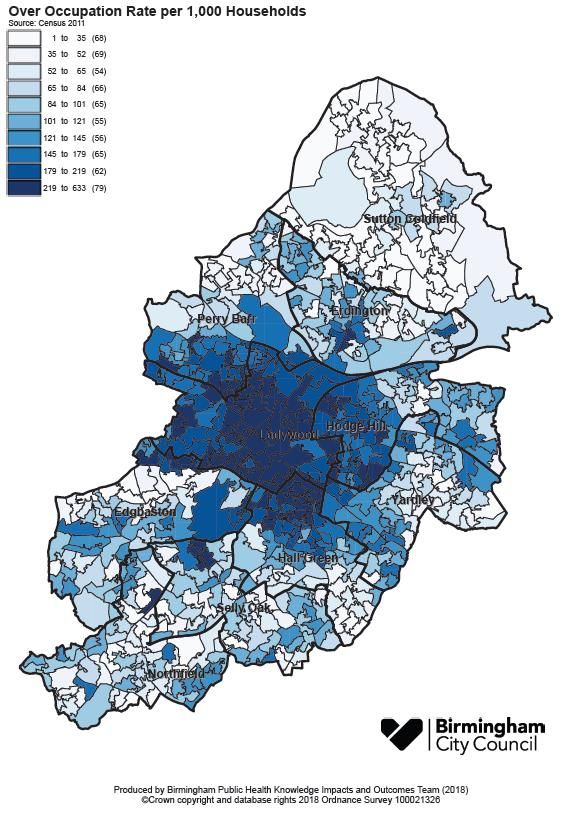
Child obesity
Birmingham has a higher prevalence of child obesity. More than one in ten 4-5 year olds
are obese (11.5%) and a quarter of all 10-11 year olds (25.5%)

        Figure 6 - Childhood obesity 4-5 year olds by constituency. Source NCMP 2015/16-2017/18

The prevalence of obesity in Edgbaston constituency is higher than the Birmingham
average for 4-5 year olds (12.8%) but lower for 10-11 year olds (23.9%).

        Figure 7- Childhood obesity 10-11 year olds by constituency. Source NCMP 201516-2017/18

                                                                                                  8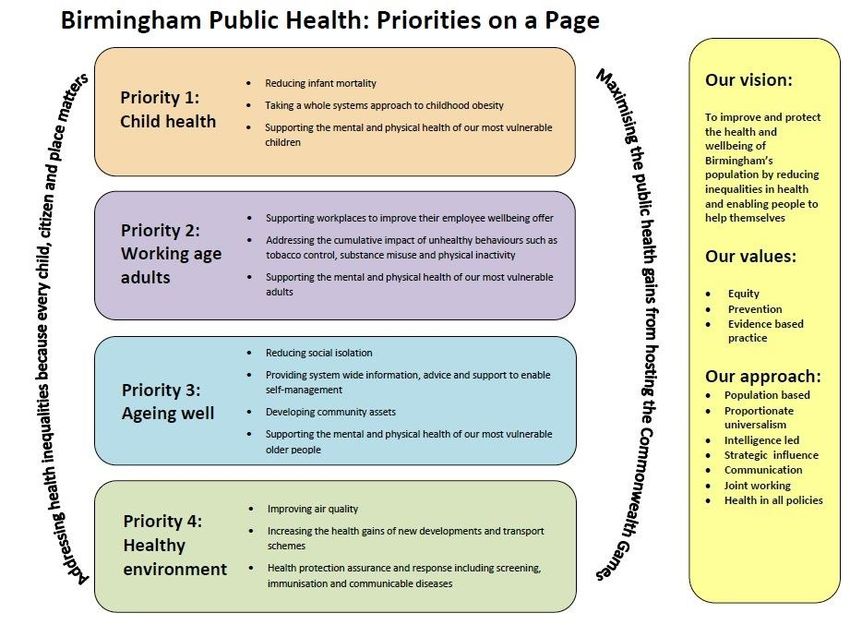
Educational attainment
Figure 8 shows the percentage of children achieving a good level of development during
their foundation year. Achievement in Edgbaston constituency is lower than England but
similar to the Birmingham average.

                      Figure 8 – Reception Year 2016/17 Attainment Percentage

Figure 9 shows the percentage of children by constituency achieving 5 or more A-C
Grades at GCSE during 2016/17. Achievement in Edgbaston constituency is similar to
both the England and Birmingham averages.

               Figure 9 – KS4 GCSE result Grades A to C 2016/17 Attainment Percentage

                                                                                        9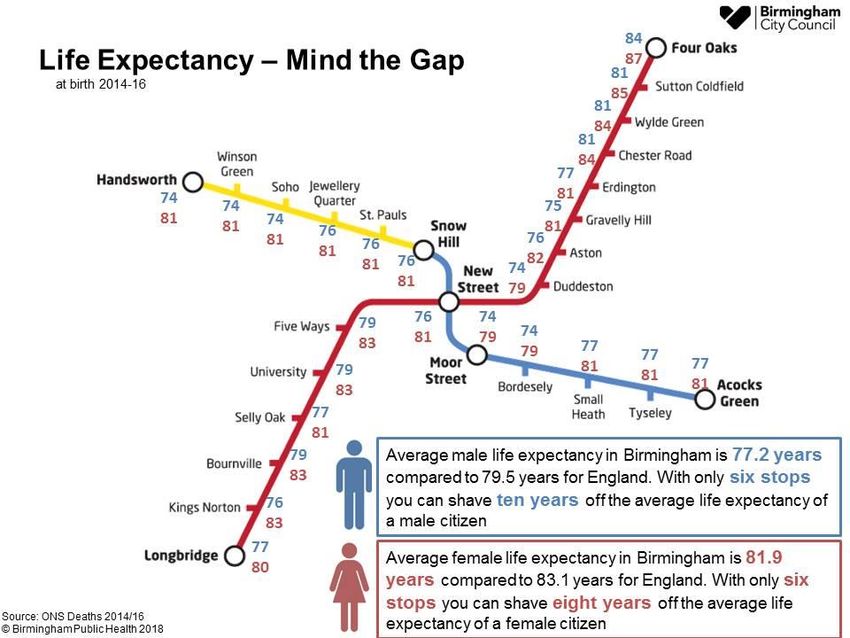
Child protection
The figures below show the numbers of children in with a child protection plan (CPP) and
those in the care of the local authority (CIC). These charts do not include those children
whose place of residence cannot be identified (for child protection reasons) which are 21%
of CIC and 7% of those with a CPP.

                                                                                             1
                   Figure 10 – Number of children under Child Protection Order August 2018

Children in care

                                                                                        2
                        Figure 11 – Number of children identified in care August 2018

1
    Sourced from Birmingham CYPF data strategy team

                                                                                                 10
Child mental health
As part of the HeadStart Phase 3 bid an experimental mental health index was created
using 30 indicators grouped into 5 sections (children and families, crime, economics,
hospital activity and education).3 An overall score was created to give an indication of
resilience and mental wellbeing. Those areas with the lowest scores (shaded darkest on
the map) are potentially more likely to have lower resilience and poorer mental wellbeing.
In Edgbaston constituency Bartley Green has low scores on the index.
Figure 12 : Experimental Mental Health Index (10-16yrs). Source: HeadStart Strategy 2015
2
Sourced from Birmingham CYPF data strategy team
3
HeadStart Strategy Stage 3 2015 available online
https://www.childrenssociety.org.uk/sites/default/files/HeadStart_Strategy_Stage_3%20_xfinal.pdf
11Working Age Adults
A Birmingham Public Health priority for working age adults is to address the cumulative
impact of unhealthy behaviours e.g. smoking and substance misuse.
Smoking
Smoking attributable deaths account for around half of all deaths across Birmingham each
year. The chart shows the number of these deaths for each Birmingham constituency over
3 year rolling trends from 2010-2016. During this period there were a total of 21,288
deaths in the city that could be attributed to smoking. Edgbaston constituency total was
1,849 deaths which is one of the smaller totals across the ten constituencies that make up
Birmingham.
Figure 13- Attributed smoking deaths. Source: ONS Death
Alcohol
Alcohol related deaths account for approximately 16% of all deaths within the 25 to 64
year age group each year across Birmingham.
Numbers of deaths from this cause have increased year on year since 2010 within
Edgbaston constituency. Edgbaston constituency accounted for 10% of all alcohol related
deaths across Birmingham during the last six years since 2010. However, this
constituency has seen a slow decline in the number of deaths 2012/14.
12Figure 14- Chart showing alcohol related deaths 25-64. Source: ONS Deaths 2010-2016
Hospital admission rates for alcohol related admissions rates in 2017/18 for Edgbaston
constituency between the ages of 25-64 are lower than Birmingham. The chart below
shows that they were lower than the Birmingham average but similar to England.
Figure 15- Chart of alcohol admission rates. Source: NHS Digital 2017/18
13Substance misuse
Drug misuse is a significant cause of premature mortality in the UK. Analysis of the Global
Burden of Disease Survey 2013 shows that drug use disorders are now the third ranked
cause of death in the 15–49 age group in England. Birmingham Public Health commission
drug treatment services for the city. The chart below shows the number of deaths
between 2014/16 for each Birmingham constituency that are specifically related to drugs
(not including alcohol). Intentional and unintentional deaths are included.
Figure 16 – Number of deaths from drugs. Source: ONS Deaths
Hospital admission rates for substance misuse for 25 to 64 year olds are shown below.
Broken down by constituency, these are inpatient admissions for mental and behavioural
disorders, toxic effects and poisoning.
Figure 17 - Chart of DSRs for substance misuse. Source: NHS Digital HES 2013-2018
14Learning disability and employment
The proportion of supported working age adults with learning disability in paid employment
is an indicator in the Adults Social Care Outcomes Framework. Birmingham has one of
lowest proportions in the country with less than 1% in employment during 2017/18.
Nationally approximately 6% of people with learning disability have paid employment
(ASCOF 2016-17).
Figure 18 - Adults with LD in paid employment by constituency. Source: Adults Social Care data 2017/18
15Older Adults
Social isolation
People who feel socially isolated have a 30% higher risk of early death.4 The map below
shows the relative risk of loneliness based on Census 2011 information on marital status,
health status, age and household size.
Figure 19: Loneliness Index age 65+ by Birmingham LSOA. Source: Age UK
Edgbaston constituency contains a large number of areas where there is a risk of
loneliness amongst older adults.
4
Holt-Lunstad J, Smith TB, Baker M, et al. Loneliness and Social Isolation as Risk Factors for Mortality - A
Meta-Analytic Review, Perspectives on Psychology. Published online March 11 2015
16Pension claimants
Figure 20: Pension Claimants per 1,000 2017. Source: NOMIS
Edgbaston contains several areas who were claiming a pension during 2017 indicating
there are large pockets of elderly residents and pockets of those with disabilities located in
this area.
17Admissions for falls
Figure 21: Number of Falls Admissions 65+ Source: NHS Digital HES
Between April 2013 and March 2018 there were approximately of 23,350 admissions
across Birmingham for falls related conditions. 9.3% of these where in Edgbaston
Figure 22: Number of mental health Admissions 65+ (excluding Dementia) Source: NHS Digital HES
Between April 2013 and March 2018 there were approximately of 45,000 admissions
across Birmingham for mental health conditions excluding dementia. 9% of these
admissions were from Edgbaston constituency,
18End of life care
The majority of residents who die in Birmingham in any given year are in the 65+ age
group. Our biggest killers are cancers and cardiovascular diseases; it is therefore
important that patients are permitted to die in their own chosen place and receive high
quality palliative care in their last twelve months of life. There is no data available on
whether patients are receiving end of life care (EOLC) in their preferred place. The figure
below shows the place of death for residents in Edgbaston constituency.
Figure 23: Percentage of Place of Death 2016 Source: ONS Deaths
During 2016 there were a total of 6,776 deaths in Birmingham in the 65+ age group. Of
these 616 are Edgbaston residents. 51% of deaths in Edgbaston constituency for this age
group took place in hospital (54.6% for Birmingham). Nationally, the main measurement
relating to EOLC are those deaths taking place at home or in a hospice. Edgbaston had
33.9% of deaths occurring at home (Birmingham 32.2%) and 10.2% in a hospice
(Birmingham 6.8%). This indicates that more people aged over 65 die at home and a
hospice in Edgbaston than across the rest of Birmingham.
19Healthy Environment
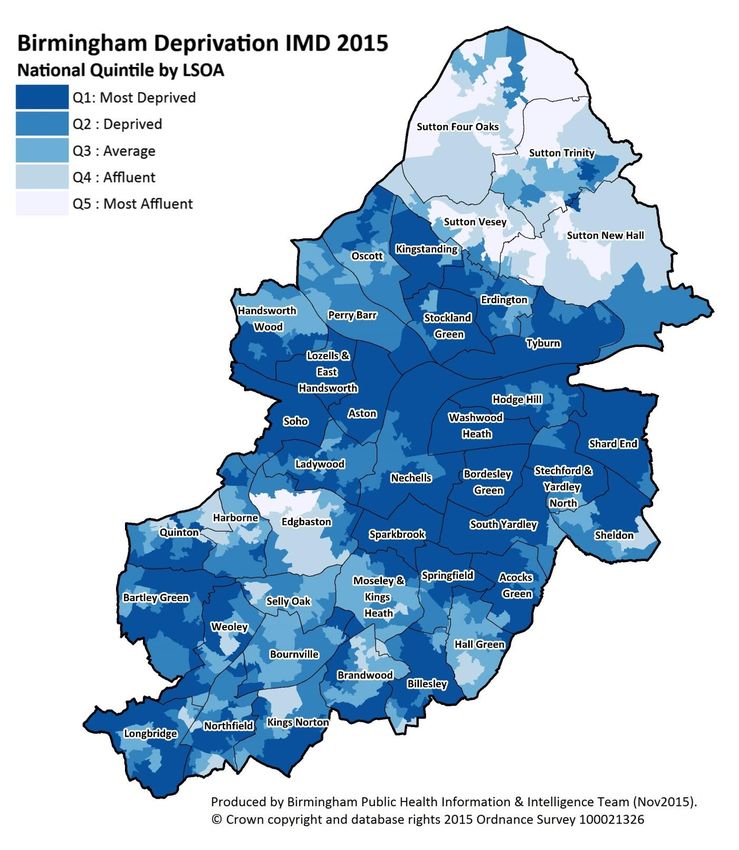
Deprivation
The Index of Multiple Deprivation (IMD) is a measure of the relative levels of deprivation at
small area levels. Birmingham as a whole has high levels of deprivation with 40% of the
population living in the 10% most deprived areas of England. The figure below shows the
local areas by their national rank, the darkest shading being the most deprived. Many
areas within Edgbaston constituency have some the most deprived in the country.
Figure 24 - Deprivation map by Birmingham ward. Source: IMD 2015
20Life expectancy inequality
Life expectancy in Birmingham is lower than the national average. However within the city
there is great variation between areas. The train and metro map shows life expectancy for
males and females around areas of the city. With only six stops on the train life
expectancy varies by 10 years for males and 8 years for females.
Figure 25 - Life Expectancy Inequalities Across Birmingham Source: ONS Births / Deaths
21Air quality
In Birmingham it is likely that air pollution is second only to tobacco smoke in causing
premature death (deaths before the age of 75). In the UK it is estimated that each year
there are 40,000-50,000 deaths attributable to air pollution; in Birmingham based on
current mortality, this equates to almost 900 deaths a year. Heart disease and stroke are
the most common reasons for premature death attributable to air pollution, responsible for
80% of cases of premature death; lung diseases and lung cancer follow.
Figure 26: Map showing Nitrogen Dioxide levels. Source: DEFRA 2016
These two maps have been created using Public Health England’s SHAPE tool5 and
show Nitrogen Dioxide NO2 and PM10 Particulate Matter levels for Birmingham.
5
Strategic Heath Asset Planning and Evaluation https://shapeatlas.net/
22Figure 27: Particulate Matter levels. Source: DEFRA 2016
Edgbaston constituency has some low levels of both NO2 and PM10 which will contribute
to the experience of poor health and early death in the city.
23Becoming a food smart city
Prevalence of childhood obesity is higher in children from poorer neighbourhoods. Within
these areas there are more fast food outlets.6 Birmingham has a higher than the national
average prevalence of child obesity. The map shows the location of takeaway and
sandwich shops in the city with the obesity prevalence for 10-11 year olds. Edgbaston
constituency has similar numbers of takeaways and sandwich shops to the rest of
Birmingham.
Figure 28: Birmingham takeaway/sandwich shops locations and childhood obesity prevalence age 10-11yrs.
Source: Foods Standards Agency and NCMP
6
Public Health England, Obesity and the environment briefing online available at:
https://www.gov.uk/government/publications/obesity-and-the-environment-briefing-regulating-the-growth-of-
fast-food-outlets
24Fuel Poverty
Fuel poverty is defined as households with a low income but with high energy costs. The
map below shows that there are pockets in the population living in the north of Edgbaston
constituency who may be struggling to pay high energy costs with low incomes. Living in a
poorly heated home is strongly linked to poor health outcomes.
Figure 29: 2016 Fuel Poverty by LSOA within constituency
https://www.gov.uk/government/collections/fuel-poverty-sub-regional-statistics.
25Overcrowding
In Birmingham 9.1% of households were overcrowded (Census 2011). These households
have at least one bedroom too few for the number of people living in the household.
People living in challenging housing conditions are more likely to experience poor health.
Figure 30: Overcrowding across Birmingham 2011 Census
https://www.ons.gov.uk/search?q=census+2011
26A&E Hospital Attendances
Figure 31 - A&E attendances by constituency 2012-2018
A&E attendances have steadily increased across Birmingham over the last five years.
Attendances within Edgbaston have also risen but have recently reached a plateau and
are one of the lowest across the city.
27Disease Breakdowns
Cardiovascular disease (CVD) is a general term for conditions affecting the heart or
blood vessels. CVD is one of the main causes of death and disability in the UK, but it can
often largely be prevented with a healthy lifestyle.7
A specific QOF no longer exists for CVD as a whole but to give a broader picture here are
some of the main heart related diseases that come under CVD.
Coronary Heart Disease (CHD)
CHD is the term that describes what happens when the heart's blood supply is blocked or
interrupted by a build-up of fatty substances in the coronary arteries.
Figure 32 - CHD prevalence. Source: QOF 2017-18
A proxy has been developed to calculate constituency prevalence based on the overall
spread of populations within each practice. Using this method it can be estimated around
2.4% of the population of Edgbaston constituency is on the CHD register; this compares to
3.1% nationally, and 2.7% across Birmingham.
Stroke
There are two main causes of strokes: ischaemic – where the blood supply is stopped
because of a blood clot, accounting for 85% of all cases and haemorrhagic – where a
weakened blood vessel supplying the brain bursts.
7 nd
Sourced from NHS Choices Website 22 August 2018
28Figure 33- Stroke prevalence. Source: QOF 2017-18
It is estimated that Edgbaston constituency has around 1.5% of its registered population
on the stroke register; this compares to 1.8% nationally, and 1.4% across Birmingham.
Hypertension
High blood pressure, or hypertension, can if untreated, increase the risk of serious
problems such as heart attacks and strokes.
Figure 34- Hypertension prevalence. Source: QOF 2017-18
29It is estimated that Edgbaston constituency has around 12.0% of its registered population
on this register; this compares to 13.9% nationally, and 12.0% across Birmingham.
Heart failure
Heart failure means that the heart is unable to pump blood around the body properly. It
usually occurs because the heart has become too weak or stiff.
Figure 35 - Heart Failure prevalence. Source: QOF 2017-18
It is estimated that Edgbaston constituency has around 0.6% of its registered population
on this register; this compares to 0.8% nationally, and 0.6% across Birmingham.
Atrial fibrillation (AF)
AF is a heart condition that causes an irregular and often abnormally fast heart rate.
30Figure 36 - Atrial Fibrillation prevalence. Source: QOF 2017-18
It is estimated that Edgbaston constituency has around 1.4% of its registered population
on this register; this compares to 1.9% nationally, and 1.3% across Birmingham.
CVD – hospital inpatient admissions
31Figure 37 - CVD inpatient admissions. Source: NHS Digital HES 2012-2018
Over the last 6 years CVD inpatients admissions in Edgbaston have slowly increased; the
constituency has a similar number of elective and non-elective admissions
CVD deaths
Figure 38 - Chart of CVD Directly Standardised Rates. Source: ONS 2014-16
Death rates are calculated per 100,000 of the population; for the 3 year period 2014-16
Edgbaston’s directly standardised rate (DSR) at 248.1per 100,000 is lower than both
32England 252.7 and Birmingham 274.8. Further analysis highlights that the majority of
deaths are in the 65+ age group. This was consistent across the whole city.
Diabetes – is a lifelong disease that causes a patient blood sugar levels to be too high.
There are 2 main types of diabetes:
type 1 diabetes – where the body's immune system attacks and destroys the cells
that produce insulin
type 2 diabetes – where the body doesn't produce enough insulin, or the body's
cells don't react to insulin
Type 2 diabetes is far more common than type 1. In the UK, around 90% of all adults with
diabetes have type 2.8
Diabetes prevalence (age 17 and over)
Figure 39: chart of diabetes prevalence. Source: QOF 2017/18
We are not given exact numbers by lower areas a proxy has been developed based on
overall spread of populations within each practice. Using this method it can be estimated
that Edgbaston constituency during 2017/18 had around 6.2% of its registered population
on this register; this compares to 6.8% nationally, and 8.6% across Birmingham.
8 nd
Sourced from NHS Choices Website 22 August 2018
33Diabetes – hospital admissions
Figure 40: chart of diabetes inpatients. Source: NHS Digital HES 2012 to 2018
Admissions for all types of diabetes has risen year on year since 2012/13 until 2016/17 in
Edgbaston constituency. Interestingly the gap between elective and non-elective
admissions would appear to be opening with a sharper rise in elected admissions
Diabetes deaths
Figure 41: chart of diabetes DSRs. Source: ONS Deaths 2014/16
34The death rate for diabetes compared to other conditions remains low across Birmingham,
with diabetes very rarely being recorded as the underlying cause of death. Edgbaston
constituency has a rate at 11.8 per 100,000 (Birmingham 16.2, England 10.3). The
majority of deaths are in the 75+ age group and predominantly male.
Cancer is a condition where cells in a specific part of the body grow and reproduce
uncontrollably. The cancerous cells can invade and destroy surrounding healthy tissue,
including organs. Cancer sometimes begins in one part of the body before spreading to
other areas. This process is known as metastasis.
More than one in three people will develop some form of cancer during their lifetime. In the
UK, the four most common types of cancer are:
breast cancer
lung cancer
prostate cancer
bowel cancer
Although, there are anything up to 200 known cancers.9
Cancer prevalence
Figure 42: chart showing cancer prevalence by Birmingham constituencies. Source: QOF 2017/18
9 nd
Sourced from NHS Choices Website 22 August 2018
35We are not given exact numbers by lower areas a proxy has been developed based on
overall spread of populations within each practice. Using this method it can be estimated
that Edgbaston constituency during 2017/18 had around 1.8% of its registered population
on this register; this compares to 2.7% nationally, and 1.9% across Birmingham.
Cancer – hospital admissions
Figure 43: chart of cancer inpatients. Source: NHS Digital HES 2012-2018
The treatment of cancer requires a regular attendance as either an outpatient or inpatient
facility to receive necessary drugs; as such numbers of admissions are high. 7.4% of all
admissions came from residents of Edgbaston constituency during 2017/18. Around 70%
of those were elective admissions.
Cancer deaths
Figure 44: - chart showing cancer DSRs. Source: ONS Deaths 2014-16
36During 2014/16 cancer across all ages accounted for around 6,800 (26.5%) deaths across
Birmingham. For those three years the disease was the city’s biggest killer. Edgbaston
constituency had a rate of 269.0 per 100,000 of the population (Birmingham 288.2,
England 270.9). During the three years Edgbaston constituency had 623 deaths or 9% of
all cancer deaths in Birmingham
Respiratory - this wide area covers those diseases that affect the respiratory areas of the
body (lungs) and affect breathing. The majority of these which cause distress and require
constant medical attention are mainly:
Chronic obstructive pulmonary disease (COPD) is the name for a group of lung
conditions that cause breathing difficulties.
It includes:
emphysema – damage to the air sacs in the lungs
chronic bronchitis – long-term inflammation of the airways
COPD is a common condition that mainly affects middle-aged or older adults who smoke.
The breathing problems tend to get gradually worse over time and can limit your normal
activities, although treatment can help keep the condition under control.
Asthma is a common lung condition that causes occasional breathing difficulties.10
COPD prevalence
Figure 45 - COPD prevalence. Source: QOF 2017/18
10 nd
Sourced from NHS Choices website 22 August 2018
37It can be estimated that Edgbaston constituency during 2017/18 had around 1.4% of its
registered population on this register; this compares to 1.9% nationally, and 1.5% across
Birmingham.
Asthma prevalence
Figure 46: Asthma prevalence. Source: QOF 2017/18
It can be estimated that Edgbaston constituency during 2017/18 had around 6.1% of its
registered population on this register; this compares to 5.9% nationally and 6.0% across
Birmingham.
Respiratory hospital admissions
Figure 47- Respiratory inpatient admissions. Source: NHS Digital 2012-18
38Since 2012/13 Edgbaston constituency has seen a rise in the numbers of inpatients for
respiratory related conditions. Equally, consistent with the other constituencies they are
predominantly for non-elective admissions (approximately 67% of all respiratory
admissions during 2017/18).
Respiratory deaths
Figure 48 - Respiratory DSRs. Source: ONS Deaths 2014-16
The death rate for respiratory diseases within Edgbaston constituency is similar to local
and national rates at 137.4 per 100,000 of the population (Birmingham 150.0, England
132.8). The rates are for all ages but the majority of deaths from respiratory diseases are
for those patients 75+. Many of the respiratory diseases last for the majority of your life
meaning as the disease progresses your quality of life diminishes.
For more information please contact:
Birmingham Public Health
Birmingham City Council
Post: PO Box 16732 Birmingham B2 2GF
Email: publichealth@birmingham.gov.uk
Twitter: @healthybrum
www.birmingham.gov.uk/publichealth
February 2019
V0.3
39You can also read