COVID-19 Lockdowns and Decline in Traffic Related Deaths and Injuries - IZA DP No. 13278 MAY 2020
←
→
Page content transcription
If your browser does not render page correctly, please read the page content below
DISCUSSION PAPER SERIES

IZA DP No. 13278

COVID-19 Lockdowns and Decline in
Traffic Related Deaths and Injuries

Umut Oguzoglu

MAY 2020
DISCUSSION PAPER SERIES

IZA DP No. 13278

COVID-19 Lockdowns and Decline in
Traffic Related Deaths and Injuries

Umut Oguzoglu
University of Manitoba and IZA

MAY 2020

Any opinions expressed in this paper are those of the author(s) and not those of IZA. Research published in this series may
include views on policy, but IZA takes no institutional policy positions. The IZA research network is committed to the IZA
Guiding Principles of Research Integrity.
The IZA Institute of Labor Economics is an independent economic research institute that conducts research in labor economics
and offers evidence-based policy advice on labor market issues. Supported by the Deutsche Post Foundation, IZA runs the
world’s largest network of economists, whose research aims to provide answers to the global labor market challenges of our
time. Our key objective is to build bridges between academic research, policymakers and society.
IZA Discussion Papers often represent preliminary work and are circulated to encourage discussion. Citation of such a paper
should account for its provisional character. A revised version may be available directly from the author.

                                                     ISSN: 2365-9793

                                           IZA – Institute of Labor Economics
Schaumburg-Lippe-Straße 5–9                      Phone: +49-228-3894-0
53113 Bonn, Germany                             Email: publications@iza.org                                    www.iza.org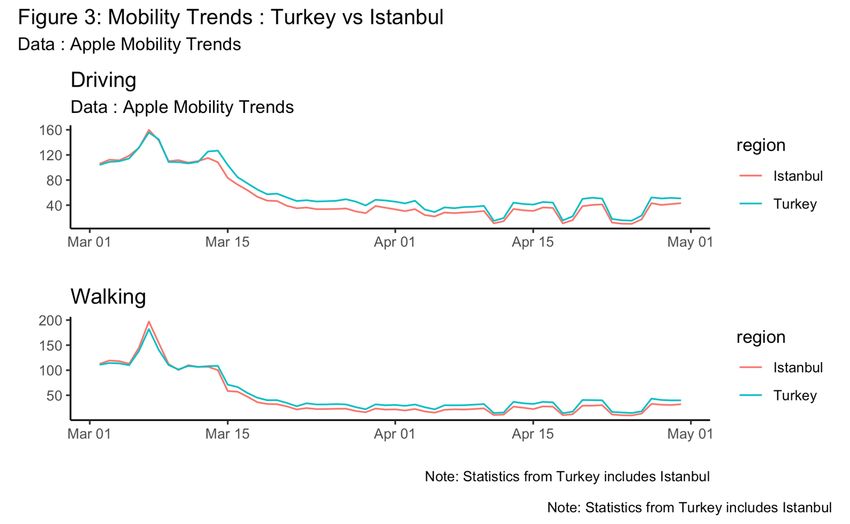
IZA DP No. 13278                                                                                                               MAY 2020

            ABSTRACT
            COVID-19 Lockdowns and Decline in
            Traffic Related Deaths and Injuries*
            This paper investigates the decline in traffic accidents, fatalities and injuries during the
            months that COVID-19 stay-at-home orders implemented in Turkey. Taking into account
            the decline in accidents in March and April together, these rates roughly translate to 200
            traffic related deaths and 17,600 injuries avoided during the months that stay-at-home
            orders were in place. The Difference in Difference estimates that exploit variation in
            quarantine orders among small cities, I also show that stricter rules in April are responsible
            for the decline of accidents with death or injury by 35 percent, death by 72 percent and
            injuries by 19 percent.

            JEL Classification:             P48, Q53, Q58
            Keywords:                       COVID-19, safer-at-home, lockdowns, traffic accidents, fatality,
                                            injury, Turkey

            Corresponding author:
            Umut Oguzoglu
            Department of Economics
            University of Manitoba
            647 Fletcher Argue Bld.
            Winnipeg Manitoba
            Canada
            E-mail: umut.oguzoglu@umanitoba.ca

            * I thank Julia Witt, Serkan Ozbeklik, Resul Cesur, Soodeh Saberian and Ryan Godwin for the valuable comments. I
            am grateful for Sidra Hameed for excellent research assistantship. All mistakes are my own.
Introduction
The decline in traffic accidents during COVID-19 lockdowns have been noted across the world in
academic articles (see among others for Spain (Aloi et al 2020) , Brazil (Statista, 2020), India
(Sarla, 2020), the US (Brodeur et al, 2020; Shilling and Watjen, 2020)), and in the media. In
addition to decreasing the number of fatalities and injuries directly, the decline in traffic accidents
also indirectly helped hospitals cope with the pandemic more effectively by freeing up resources.
Chilet et al (2020) found that in Chile, the decline in mobility had a significant impact on non-
respiratory emergency room visits, especially for visits related to trauma that could be traffic
related. Moreover, given that up to 3% of developing countries’ GDP is spent on emergency
response and health care due to traffic accidents (WHO, 2018), in addition to productivity gain
due to missing disabilities and loss of life, the decline in traffic accidents will make available much
needed financial resources that can be allocated to fight post-pandemic recessions1.
In this paper, I quantify the decline in traffic accidents, fatalities and injuries in Turkey using city-
level accident reports from December 2018 to April 2020, and monthly country-level reports since
January 2013. In response to a sharp increase in COVID-19 cases, Turkey imposed very strict stay-
at-home orders since the middle of March which, among other measures, include travel
restrictions, school and non-essential service closures, permanent quarantine for under 20 and over
65 year olds and individuals with co-morbidities, and curfews on weekends that apply to everyone
in 31 cities. The decline in mobility in Turkey, especially in Istanbul, one of the most traffic-
congested cities in the world (ranked 9 out of 4162), has been comparable to regions with severe
outbreaks.
According to results using the entire sample of cities, the incidence rate of accidents that involve
death or injuries, and accidents with material loss are estimated to have declined by 60 and 46
percent respectively in April. The average estimated decrease in incidence rates of injuries and
deaths in April was 43 and 65 percent respectively. Taking into account the decline in accidents in
March and April together, these rates roughly translate to 200 traffic related deaths and 17,600
injuries avoided during the months that stay-at-home orders were in place. The Difference in
Difference estimates that exploit variation in quarantine orders among small cities, I also show
that stricter rules in April are responsible for the decline of accidents with death or injury by 35
percent, death by 72 percent and injuries by 19 percent.
Brief Chronology of COVID-19 measures in Turkey
After the first case of COVID-19 infection was announced on March 11, the Turkish government
implemented a series of measures restricting mobility. On March 12, all schools including
universities seized operation. Shortly after, bars, night clubs, museums and picnic areas closed
down, various sports leagues were suspended. On March 21, a curfew was imposed on persons
1
For, the US, Brodeur et al estimate that benefits from avoided traffic accidents range from $7 billion to $24 billion.
2
Other Turkish cities in global congestion rankings include Ankara (ranked 100), Izmir (133), Antalya (144), Adana
(181), Bursa (208), Gaziantep (236), Mersin (246), Konya (329). For congestion rankings see:
https://www.tomtom.com/en_gb/traffic-index/ranking/
2age 65 and older and persons with chronic illnesses. Also, non-essential services such as
hairdressers, barbershops and beauty salons were closed. Since March 27, individuals require
travel permission for intercity bus travels. On March 30, the number of taxis allowed in traffic was
limited. On April 3, the interior ministry quarantined 30 metropolitan cities and the city of
Zonguldak. A curfew imposed on persons younger than 20 in the quarantined cities in addition to
the curfew on persons 65 and older that was already in place3. On April 10, a 48 hours curfew
imposed on everyone. Curfews were periodically re-introduced since then.
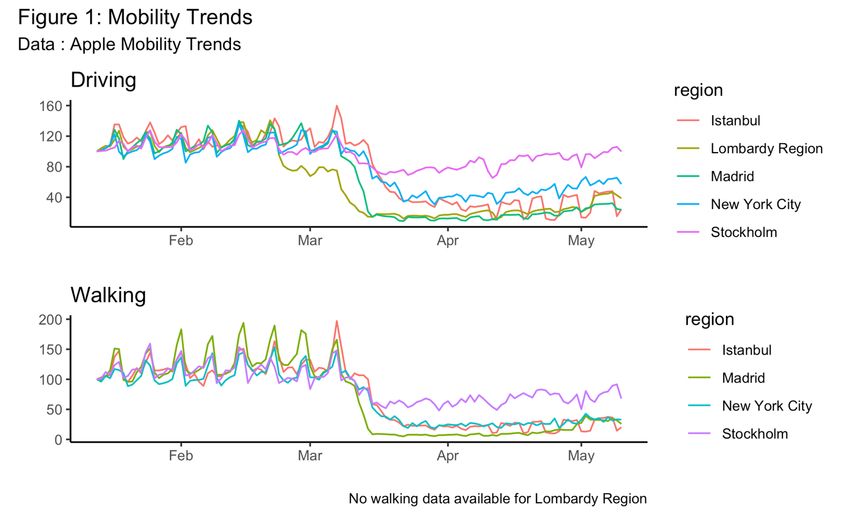
These rules have had a profound impact on the mobility patterns throughout the country. The rate
of driving and walking dropped sharply in Istanbul, almost at a comparable magnitude to
international regions with severe outbreaks such as Lombardy Region in Italy, New York City and
Madrid (see Figure 1).
3
For a more extensive coverage of COVID-19 measures see : https://www.duvarenglish.com/health-
2/coronavirus/2020/04/09/ankara-vs-covid-19-chronology-of-turkeys-coronavirus-battle/
3Data
Two data sources were used for the analysis that is presented in the next section. The first is the
summary reports from the Ministry of Transport and Infrastructure (MTI) which provide monthly
data on all accidents, fatalities and injuries starting from 2013 for the whole country4. The second
data source is the monthly city-level traffic accident reports published on the Turkish General
Directorate of Security’s (TGS) website from December 2018 to April 20205. The information
included at the city level are city and month of the accidents, number of accidents broken down by
type (accident with death or injury, accident with material loss), number of deaths and number of
injured. Further details such as who was at fault (driver, pedestrian, vehicle, road), number of
vehicles involved in the accident, type of crash…etc are also available, however, this information
is provided for the whole country, not for individual cities. Reports do not include demographic
information. Note that city-level reports only record deaths that occurred at the scene of the
accident, while MTI reports include fatalities both at and after crash since 2015.
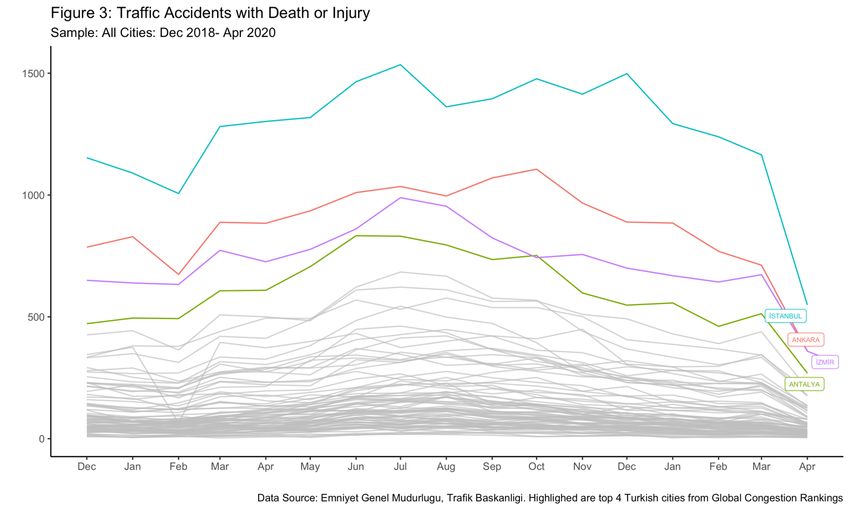
In 2019, 174,590 accidents with deaths or injuries occurred in Turkey where 285,638 people were
injured, and 2524 people died at the crash scene which reflects only half of the fatalities that usually
occur within 30 days of a crash. The per-city average for each month between December 2018 and
February 2020 was 2.3 deaths at the crash scene and 260 injuries. There have been on average 150
accidents with deaths and/or injuries per city in a month and 232 accidents with material loss (see
Table 1). These numbers dramatically declined during the lockdowns. Percentage change in all
traffic accidents and accidents that involve injury or death compared to the previous year is
reported in Figure 2 for the 10 most populous cities in Turkey. There is a sharp contrast between
months where stay-at-home orders were in effect and months preceding them. Especially, the
sudden drop in April, the first full month that the lockdown measures were in effect, is striking.
Also, the effect has been more pronounced the more the city was congested (see Figure 3).
4
Reports are downloaded from: Turkish Statistical Institute’s Official Statistics Portal
http://www.resmiistatistik.gov.tr/. Report for 2018 can be downloaded from MTI’s website
https://www.kgm.gov.tr/Sayfalar/KGM/SiteTr/Trafik/TrafikKazalariOzeti.aspx
5
Reports in PDF format for 2020 can be downloaded from following link
http://trafik.gov.tr/istatistikler37. All past reports and full data used in the paper in csv format are
available from the Author.
45
Methodology

The simple model that describes the city level accident outcomes for city i at month m can be
characterised as follows:

                                !!" = ## $%&'()*'+" + -! + ." + .$ + /!"

where !!" is one of the following city level outcomes: number of accidents with death or injury,
number of accidents with material loss, number of deaths, and number of injuries. $%&'()*'+"
identifies months that social distancing rules were in effect (individual dummies for March and
April 2020), -! , ." , .$ are city, month and year fixed effects respectively.

Note that there has been no city level variation in the timing of initial stay-at-home rules6.
However, a quarantine was imposed on only 31 cities in April. According to Apple Mobility data,
declines in driving and walking in Istanbul (one of the quarantined cities) was more than the
decline for the whole country (see Figure 3).

One can exploit this variation in policies to identify the impact of stricter measures by estimating
a model with interaction for quarantined cities as in Brodeur et al (2020). However, 30 out of 31
cities that were quarantined are metropolitan municipalities. Since metropolitan city designation
is primarily a function of the population (more than 750,000) and given that metropolitan

6
 City level variation in implementation of the measures is likely but is not observable, this variation is partly
captured by city and month fixed effects.

                                                                                                                    6
municipalities are allocated more financial and administrative resources, they may not be directly
comparable to other cities in terms of pre-pandemic traffic congestion or in their ability to enforce
stay-at-home orders during the pandemic.
The only city that was in quarantine during April that is not a metropolitan municipality is
Zonguldak. The reason behind Zonguldak’s quarantine was not the population size but its high
prevalence of respiratory illnesses (Zonguldak is a major coal producer). Zonguldak has a
population of around 500,000 and is more likely to be a representative of non-metropolitan cities
in the sample. Using this variation, it is possible to obtain a more accurate picture of the effect of
the quarantine. I restrict the sample to only non-Metropolitan cities and estimate a Diff-in-Diff
model with the interaction for Zonguldak for the month of April.
Results
Here, I focus only on the city level estimates that use data from December 2018 onwards. The
country-level estimates that use a longer time period are reported in the Appendix. All models are
estimated using Poisson models, coefficients presented in the tables are incidence rate-ratios (a
value below one means a decrease in the incidence of the outcome variable).
According to Table 2, in March and April 2020, traffic accidents with death or injury declined
approximately by 20 percent and 60 percent respectively, compared to the same months last year.
The decline in accidents with material loss are 13 and 46 percent. This resulted in a decline in
reported injuries by 13 and 75 percent. The decline in deaths at crash scenes are only in April, by
15 percent, and it is imprecisely estimated.
Next, I focus on the Diff-in-Diff estimates that use the city of Zonguldak as the treated group and
the rest of the non-metropolitan cities as the control group. According to the results in Table 3, the
decrease that can be attributed to the stricter measures in April are approximately 35 percent in
accidents with death or injury, 32 percent in accidents with material loss and 19 percent in injuries.
There has not been a significant decline in deaths at the crash scene due to stricter measures.
Adjusted Deaths and Injuries
The estimated decline in traffic fatalities reported above most likely to underrepresent the actual
decline in lives lost due to traffic accidents. Since city-level reports only record deaths at the crash
scene, the fatalities should be adjusted to reflect the actual traffic accident deaths. According to
the latest available statistics in MTI reports, in 2018, 3368 people died at the scene of the accident
while 3307 died within 30 days due to injuries caused by the accidents. Therefore, the actual
number of deaths is likely to be twice the numbers that are available in the monthly reports. One
possibility to adjust the fatalities is to re-classify a portion of the reported injuries as death. Using
hospital-level administrative data from Turkey, Demiral et al. (2010) estimate that 3.9% of
individuals who were admitted to hospitals with traffic injuries die within 30 days. This, however
most likely not to reflect the fatality rate for all injured since only severe cases would be admitted
to the hospital. Another possibility, which I implement for the country-level regressions, is to use
7the ratio of all fatalities to fatalities at the crash scene to calculate an adjustment ratio. These statics
are available in MTI reports since 2015 which gives a median adjustment rate of 2.027.
For the city-level analysis, I adjusted both fatalities and injuries. Comparing the total of monthly
injuries for 2018 from the city level reports (310,109) which does not take into account post-crash
deaths and one that does from MTI for the same year (307,071), I chose a post-crash fatality rate
for injured as 1% and increased(decreased) monthly deaths(injuries) by 1%8.
The estimated results for adjusted deaths and injuries for the whole sample and the smaller Diff-
in-Diff sample are reported in Table 4. The estimated decline in traffic accident-related deaths is
43 percent in April, and the estimated decline in injuries is around 65 percent. According to Diff-
in-Diff results, deaths decline by 72 percent due to stricter measures, and injuries by 19 percent.
Check for Pre-Trend
I re-estimate the models by including indicators for months from December 2019 to April 2020,
the results are presented in Table 5 for the whole sample and in Table 6 for the Diff-in-Diff sample.
According to results, the traffic accident outcomes were slightly higher compare previous year
until the stay-at-home rules were implemented.
Discussion
Every year 1.35 million people die and up to 50 million are injured in traffic accidents. 90% of
these losses occur in low- and middle-income countries (WHO, 2018; Puvanachandra et al. 2012).
High population density and road congestion are major factors (Ashraf et al. (2019); Golob and
Recker (2003); Jones et al. (2003)). In 2019, 174.590 accidents with deaths or injuries happened
in Turkey where 285,638 people were injured, and 2524 people died at the crash scene which
reflects only half of the fatalities that occur within 30 days of a crash. In addition to the
unmeasurable personal loss to the individuals and their families, these traffic accidents take an
immense toll on the economy in terms of cost of emergency response, health care and loss of
productivity.
This paper examines the decline in traffic accidents and related injuries and fatalities as a result of
the stay-at-home rules that were introduced to fight rapidly increasing COVID-19 cases in Turkey.
The results suggest that during April when the strictest measures were in place for the entire month,
traffic accidents dropped approximately by 60 percent, deaths declined by 43 percent and injuries
declined by 64 percent compared to April of last year. This is in addition to declines in March
when relatively milder rules were in effect during half of the month. Applying these estimates to
statistics from March and April 2019, the estimates imply that approximately 21,000 accidents,
17,6000 injuries and 200 deaths avoided in only one and a half months that the stay-at-home
7
I simply compute ratio of total fatalities to fatalities at the crash scene for each month. The median is 2.02.
8
Also, the number of individuals who died after the crash is roughly one percent of the reported injuries. Note that
this is roughly equivalent to using the adjustment rate.
8policies were in place9, more than half of these individuals who had otherwise died or injured are
likely to have been between 24 and 64 year old (see Table 8 in Appendix). In contrast, there were
3174 official deaths attributed to COVID-19 between March 10 and April 30 in Turkey10.
9
Total accidents in March and April 2019 were 32,401 and 31,761 respectively. Adjusted number of deaths were
319 and 393, injuries were 20,102 and 20,552. I multiplied these numbers with the estimates from Table 2 and
Table 4.
10
See: https://covid19.saglik.gov.tr/
9References:
Ashraf I, Hur S, Shafiq M, Park Y (2019) Catastrophic factors involved in road accidents:
Underlying causes and descriptive analysis. PLoS ONE 14 (10)
Brodeur, Abel, Nikolai Cook, and Taylor Wright. On the Effects of COVID-19 Safer-At-Home
Policies on Social Distancing, Car Crashes and Pollution. No. 13255. Institute of Labor
Economics (IZA), 2020.
Demirel, B., Demircan, A., Akar, T., Keleş, A., & Bildik, F. (2010). Ülkemizde Trafik Kazalarında
Ölenlerin Gerçek Sayısı Nedir?. Pamukkale Tıp Dergisi, (2), 70-76.
Fraser Shilling and David Waetjen. Special Report (Update): Impact of COVID19 Mitigation on
Numbers and Costs of California Traffic Crashes. Available online:
https://roadecology.ucdavis.edu/files/content/projects/COVID_CHIPs_Impacts_updated_415.pdf
Golob, Thomas F., and Wilfred W. Recker. "Relationships among urban freeway accidents, traffic
flow, weather, and lighting conditions." Journal of transportation engineering 129.4 (2003): 342-
353.
Jones, A. P., Haynes, R., Kennedy, V., Harvey, I. M., Jewell, T., & Lea, D. (2008). Geographical
variations in mortality and morbidity from road traffic accidents in England and Wales. Health &
place, 14(3), 519-535.
Naci, Huseyin, and Timothy D. Baker. "Productivity losses from road traffic deaths in
Turkey." International Journal of Injury Control & Safety Promotion 15.1 (2008): 19-24.
Puvanachandra, P., Hoe, C., Özkan, T., & Lajunen, T. (2012). Burden of road traffic injuries in
Turkey. Traffic injury prevention, 13(sup1), 64-75.
Sarla. G. COVID Dairies: An Indian Perspective. J Medical Research and Surgery 2020.1(3): 1-
4.
Wesson, H. K., Boikhutso, N., Bachani, A. M., Hofman, K. J., & Hyder, A. A. (2014). The cost of
injury and trauma care in low-and middle-income countries: a review of economic
evidence. Health policy and planning, 29(6), 795-808.
World Health Organization. “Road Traffic Injuries”. https://www.who.int/health-topics/road-
safety#tab=tab_1
World Health Organization. Global status report on road safety 2018. World Health Organization,
2018.
10Table 1: Summary Statistics of Accident Outcomes:
From Dec 2018 to February 2020
mean sd min max
Accidents w. 159.8562 208.2115 3 1535
Death/Injury
Accidents w. 232.358 515.2163 5 4367
Material Loss
Deaths 2.342048 2.93979 0 19
Injuries 259.2876 304.9861 5 2256
March 2020
mean sd min max
Accidents w. 131.0494 179.2897 7 1165
Death/Injury
Accidents w. 202.7901 449.7379 6 3128
Material Loss
Deaths 1.802469 2.282651 0 9
Injuries 202.9259 250.1352 10 1593
April 2020
mean sd min max
Accidents w. 68.81481 88.58712 4 549
Death/Injury
Accidents w. 118.9877 259.7534 7 1775
Material Loss
Deaths 1.753086 2.244609 0 10
Injuries 95.64198 116.8268 5 727
11Table 2: Panel Poisson Models with City Fixed Effects
(1) (2) (3) (4)
Accidents w. Accidents w. Deaths Injuries
Death/Injury Material Loss
Mar-2020 0.786*** 0.874*** 1.086 0.778***
(0.0128) (0.0112) (0.158) (0.0101)
Apr-2020 0.407*** 0.534*** 0.856 0.359***
(0.00763) (0.00771) (0.122) (0.00552)
Observations 1377 1377 1377 1377
Exponentiated coefficients; Standard errors in parentheses
Models include month, year and city fixed effects
*
p < 0.10, ** p < 0.05, *** p < 0.01
Table 3: Poisson Diff-in-Diff Estimates
(1) (2) (3) (4)
Accidents w. Accidents w. Deaths Injuries
Death/Injury Material Loss
Apr-2020 0.469*** 0.605*** 0.760 0.396***
(0.0181) (0.0217) (0.183) (0.0179)
Zonguldak 1.292*** 1.359*** 1.100 1.220***
(0.0957) (0.114) (0.0968) (0.0891)
Apr-2020 # 0.754*** 0.684*** 0.00000306*** 0.812***
Zonguldak
(0.0216) (0.0200) (0.00000315) (0.0303)
Constant 48.12*** 78.24*** 0.448*** 90.19***
(4.014) (7.082) (0.112) (7.757)
Observations 867 867 867 867
Exponentiated coefficients; Standard errors in parentheses
Sample: non-metropolitan cities
Models include month, year fixed effects, Std Errors are clustered at city level
*
p < 0.10, ** p < 0.05, *** p < 0.01
12Table 4: Panel Poisson Models with City Fixed Effects - Adjusted Death and Injury
(1) (2) (3) (4)
Deaths Injured Deaths Injured
0.796 0.790***
Mar-2020 0.902 0.778*** (0.117) (0.0366)
(0.0875) (0.0102)
Apr-2020 0.574*** 0.359*** 0.546*** 0.365***
(0.0587) (0.00554) (0.0854) (0.0183)
Zonguldak 1.125 1.219***
(0.0856) (0.0886)
Mar-2020 # 1.742*** 1.019
Zonguldak
(0.136) (0.0326)
Apr-2020 # 0.286*** 0.813***
Zonguldak
(0.0359) (0.0307)
Constant 1.228 85.74***
(0.170) (7.409)
Observations 1377 1377 867 867
Exponentiated coefficients; Standard errors in parentheses
Models in columns 1 and 2 are estimated with Panel Poisson with city fixed effects and include month, year and city
fixed effects. Models in (3) and (4) include month and year fixed effects and clustered standard errors at city level.
*
p < 0.10, ** p < 0.05, *** p < 0.01
13Table 5: Pre-Trend Poisson with Fixed Effects
(1) (2) (3) (4)
Accidents w. Accidents w. Deaths Injuries
Death/Injury Material Loss (Adjusted) (Adjusted)
Dec-2019 1.100*** 1.010 1.111 1.058***
(0.0142) (0.00988) (0.0828) (0.0109)
Jan-2020 1.070*** 0.898*** 0.901 1.067***
(0.0143) (0.00875) (0.0715) (0.0113)
Feb-2020 1.056*** 1.025** 1.111 1.033***
(0.0148) (0.0109) (0.0927) (0.0116)
Mar-2020 0.836*** 0.834*** 0.897 0.818***
(0.0110) (0.00881) (0.0701) (0.00864)
Apr-2020 0.433*** 0.510*** 0.571*** 0.377***
(0.00695) (0.00638) (0.0483) (0.00505)
Observations 1377 1377 1377 1377
Exponentiated coefficients; Standard errors in parentheses
Models include month, year and city fixed effects
*
p < 0.10, ** p < 0.05, *** p < 0.01
14Table 6: Pre-Trend Poisson Diff-in-Diff Estimates
(1) (2) (3) (4)
Accidents w. Accidents w. Deaths Injuries
Death/Injury Material Loss (Adjusted) (Adjusted)
Dec-2019 1.056* 0.954 1.305** 1.017
(0.0347) (0.0359) (0.140) (0.0450)
Zonguldak 1.259*** 1.340*** 1.127 1.160**
(0.0933) (0.113) (0.0852) (0.0847)
Dec-2019 #
1.061** 1.163*** 0.900 1.195***
Zonguldak
(0.0274) (0.0264) (0.0801) (0.0392)
Feb-2020 0.973 1.146*** 1.047 0.946
(0.0284) (0.0517) (0.129) (0.0385)
Feb-2020 #
1.178*** 1.067* 0.693*** 1.285***
Zonguldak
(0.0345) (0.0353) (0.0616) (0.0486)
Jan-2020 1.104*** 0.898*** 1.108 1.135***
(0.0316) (0.0288) (0.153) (0.0366)
Jan-2020 #
1.214*** 1.073*** 1.372*** 1.518***
Zonguldak
(0.0320) (0.0234) (0.128) (0.0390)
Mar-2020 0.831*** 0.876*** 0.860 0.829***
(0.0255) (0.0412) (0.0950) (0.0348)
Mar-2020 #
1.094*** 0.900*** 1.739*** 1.071**
Zonguldak
(0.0275) (0.0237) (0.142) (0.0352)
Apr-2020 0.451*** 0.583*** 0.590*** 0.384***
(0.0155) (0.0212) (0.0872) (0.0170)
Apr-2020 #
0.774*** 0.694*** 0.285*** 0.854***
Zonguldak
(0.0219) (0.0213) (0.0360) (0.0328)
Constant 47.41*** 77.50*** 1.570*** 83.73***
(3.534) (5.931) (0.160) (6.257)
Observations 867 867 867 867
Exponentiated coefficients; Standard errors in parentheses
Sample: non-metropolitan cities
Models include month, year fixed effects, Std Errors are clustered at city level
*
p < 0.10, ** p < 0.05, *** p < 0.01
15APPENDIX:
Table 7: Panel Poisson Models – Country Level Results
(1) (2) (3) (4)
Deaths
All Accidents Injured Deaths
(Adjusted)
Mar-2020 0.784*** 0.817*** 1.018 1.005
(0.00647) (0.00820) (0.110) (0.0788)
Apr-2020 0.404*** 0.343*** 0.896 0.831**
(0.00396) (0.00444) (0.0978) (0.0653)
Constant 10830.3*** 16986.8*** 219.5*** 428.1***
(41.20) (55.18) (6.590) (11.04)
Observations 88 88 88 52
Exponentiated coefficients; Standard errors in parentheses. Adjusted deaths estimates use data from 2015 onwards.
Adjustment was applied to years 2019 and 2020 where number of deaths after the crash is not available.
Models include month, year fixed effects
*
p < 0.10, ** p < 0.05, *** p < 0.01
16Table 8: Traffic Accident Deaths and Injuries by Age Groups
Age groups
0-9 10 - 14 15 - 17 18 - 20
Year Killed persons Injured persons Killed persons Injured persons Killed persons Injured persons Killed persons Injured persons
2013 202 19 303 95 13 405 116 15 599 187 23 540
2014 181 20 920 97 14 083 113 16 847 195 25 253
2015 387 22 738 186 14 585 291 17 875 436 27 191
2016 339 22 530 159 14 320 262 17 709 424 26 615
2017 331 22 342 175 14 634 281 16 894 388 25 247
2018 309 23 765 156 15 524 200 16 322 369 25 995
Age groups
21 - 24 25 - 64 65 + Unknown
Year Killed persons Injured persons Killed persons Injured persons Killed persons Injured persons Killed persons Injured persons
2013 224 29 031 2 354 157 301 488 15 060 19 1 590
2014 274 31 193 2 189 159 177 452 16 585 23 1 001
2015 522 34 059 4 205 169 498 1 474 17 656 29 819
2016 492 33 081 4 212 170 300 1 365 18 411 47 846
2017 533 32 264 4 266 169 375 1 272 17 898 181 1 729
2018 490 32 515 3 771 172 077 1 349 20 031 31 842
Source: General Directorate of Public Security and General Command of Gendarmerie
Note: Table was retrieved from Turkish Statistical Institute Website
17You can also read