DESTINATIONS EDITION THE STATE OF THE AMERICAN TRAVELER: JANUARY 28, 2021

Page created by Rick Barnes
 
CONTINUE READING
DESTINATIONS EDITION THE STATE OF THE AMERICAN TRAVELER: JANUARY 28, 2021
THE STATE OF THE AMERICAN TRAVELER:

DESTINATIONS
EDITION
 JANUARY 28, 2021
DESTINATIONS EDITION THE STATE OF THE AMERICAN TRAVELER: JANUARY 28, 2021
With You
                Chris Adams                    Dave Bratton                Laura Libby
           Head of Research and Insights   Founder & Managing Director   Senior Vice President
                Miles Partnership              Destination Analysts       Miles Partnership
DESTINATIONS EDITION THE STATE OF THE AMERICAN TRAVELER: JANUARY 28, 2021
Panelists
                  Jillian Simpson                     Lynn Bruni-Perkins
                      Vice President             VP, Global Marketing Communications
            Alaska Travel Industry Association            San Francisco Travel
DESTINATIONS EDITION THE STATE OF THE AMERICAN TRAVELER: JANUARY 28, 2021
THE STATE OF THE AMERICAN TRAVELER: DESTINATIONS EDITION

Research, slides and other
resources will be available at
www.milespartnership.com/SAT
www.destinationanalysts.com
DESTINATIONS EDITION THE STATE OF THE AMERICAN TRAVELER: JANUARY 28, 2021
1. Current Traveler Sentiment
         2. Destinations Edition Research

Agenda   3. Panelist Discussion
         4. Additional Resources
         5. Q&A
DESTINATIONS EDITION THE STATE OF THE AMERICAN TRAVELER: JANUARY 28, 2021
THE STATE OF THE AMERICAN TRAVELER
Destinations Edition, 2021
DESTINATIONS EDITION THE STATE OF THE AMERICAN TRAVELER: JANUARY 28, 2021
The State of the American Traveler
                                                                                   o Quarterly online survey conducted since 2006

                                                                                   o Data collected in mid-January

                                                                                   o Examines traveler sentiment, motivations &
                                                                                     behaviors

                                                                                   o Survey invitation sent to a nationally
                                                                                     representative sample of US adults

                                                                                   o Total sample of 2,000 American leisure travelers

The State of the American Traveler, Destinations Edition, Destination Analysts, Inc. Winter 2021
DESTINATIONS EDITION THE STATE OF THE AMERICAN TRAVELER: JANUARY 28, 2021
MONTHS TRIPS WERE TAKEN IN 2020

Question: In which                              35%
                                                                                                                                       78.8%
month(s) of 2020 did                                  29.4%                                                                             Traveled
                                                30%
you travel for any                                            27.4%

reason? (Select all the                         25%
                                                                                                     23.3%
                                                                      21.5%
months you traveled)                                                                                         19.2%   19.4%
                                                                                                                                                     21.2%

                                                20%                                          18.9%                                           17.4%
                                                                                                                             17.4%   17.0%

(Base: Coronavirus Travel Sentiment Survey,
                                                15%
Destination Analysts, Inc. Waves 43 data. All
respondents, 1,206 completed surveys. Data                                           11.6%
collected January 1-3, 2021)                                                  9.2%
                                                10%

                                                5%

                                                0%

                                                                                                                                                        PAGE 8
DESTINATIONS EDITION THE STATE OF THE AMERICAN TRAVELER: JANUARY 28, 2021
• Current Traveler
  Sentiment
• Destination Travel
  Plans, 2021
• Desired Experiences
• Travel Planning
  Resources

• Travel Aspirations

• Special Section:
  Destination
  Performance
  Benchmarking
DESTINATIONS EDITION THE STATE OF THE AMERICAN TRAVELER: JANUARY 28, 2021
CURRENT TRAVELER SENTIMENT
Question: In the past twelve (12) months, how many trips have
you taken of more than 50 miles one-way for purely leisure or
personal reasons?
LEISURE TRIPS IN THE PAST 12 MONTHS
Question: In the past twelve (12) months, how many trips have you taken of more than 50 miles one-
way for purely leisure or personal reasons?

       6
                                                                                     4.88
       5

       4                                                                                    4.07
                                                                                                     3.46
       3                                                                                      3.35

       2

       1

       0

                                                                                                       PAGE 12
LEISURE TRIPS IN THE PAST 12 MONTHS
Question: In the past twelve (12) months, how many trips have you taken of more than 50 miles one-
way for purely leisure or personal reasons?

       6                                                                          31.5%
                                                                                 Day Trip
       5

       4

       3
                                                                                               51.0%
       2                                                                                      Day Trip
       1

       0

                                                                                                     PAGE 13
LEISURE TRIPS IN THE PAST 12 MONTHS
Question: In the past twelve (12) months, how many trips have you taken of more than 50 miles one-
way for purely leisure or personal reasons?

       6                                                                         56.0%
                                                                                Road trips
       5

       4

       3
                                                                                              76.6%
       2                                                                                     Road trips
       1

       0

                                                                                                     PAGE 14
Question: In the next 12 months, do you expect to travel
more or less for leisure than you did in the most recent
12-month period?
TRAVEL IN THE NEXT TWELVE MONTHS: TRIPS

Question: In the next 12
months, do you expect to       I expect to
                              travel more
travel more or less for        for leisure,
                                  44.9%                            I expect to
leisure than you did in the                                       travel about
most recent 12-month                                              the same for
                                                                 leisure, 39.9%
period? (Select one)

                                                 I expect to
                                               travel less for
                                              leisure, 15.3%

                                                                                  PAGE 16
TRAVEL IN THE NEXT TWELVE MONTHS: TRIPS

        I expect to travel more for leisure            I expect to travel about the same for leisure               I expect to travel less for leisure
70.0%                                                                                                                     Pandemic begins

60.0%

50.0%

40.0%

30.0%

20.0%

10.0%

 0.0%

          Question: In the next 12 months, do you expect to travel more or less for leisure than you did in the most recent 12-month period? (Select one)

                                                                                                                                                            PAGE 17
FUTURE TRAVEL EXPECTATIONS

Question: Please tell us how you're                  I will travel more to make up for
looking at the future right now. Which                             lost time                         22.2%
best describes how you will approach
leisure travel as life returns to normalcy
(or near normalcy) after the COVID-19
pandemic?                                            I will travel like I did before the
                                                                  pandemic                                     50.9%

                                                     I will travel less than before the
                                                                  pandemic                       13.9%

S O U RC E : C O RO N AV I R U S T R AV E L
S E N T I M E N T I N D E X , D E S T I N AT I O N
A N A LY S T S, J A N U A RY 2 0 2 1
                                                           I don't know / I'm not sure           13.0%

                                                                                           0% 10% 20% 30% 40% 50% 60%

                                                                                                                        PAGE 18
Question: In the next 12 months, do you expect to spend
more or less for leisure travel than you did in the most
recent 12-month period?
TRAVEL IN THE NEXT TWELVE MONTHS: SPENDING

Question: In the next 12
months, do you expect to
                                    I expect to                       I expect to
spend more or less for leisure
                                   spend more                        spend about
travel than you did in the most      on leisure                      the same on
                                  travel, 42.1%                     leisure travel,
recent 12-month period?                                                  41.0%

                                                    I expect to
                                                  spend less on
                                                  leisure travel,
                                                       17.0%

                                                                                      PAGE 20
TRAVEL IN THE NEXT TWELVE MONTHS: SPENDING

         I expect to spend more on leisure travel       I expect to spend about the same on leisure travel        I expect to spend less on leisure travel
 70.0%
                                                                                                                               Pandemic begins
 60.0%

 50.0%

 40.0%

 30.0%

 20.0%

 10.0%

  0.0%

           Question: In the next 12 months, do you expect to spend more or less for leisure travel than you did in the most recent 12-month period?

                                                                                                                                                         PAGE 21
Thinking carefully about how you expect to spend your income in
the NEXT 12 MONTHS, please use the scale below to describe your
spending priorities in next year.

                                                                  PAGE 22
LEISURE TRAVEL AS A SPENDING PRIORITY
Question: Thinking carefully
about how you expect to spend                       Extremely high priority                       11.8%
your income in the NEXT 12                                                                                          27.7%
MONTHS, please use the scale
                                                              High priority                               15.9%
below to describe your spending
priorities in next year.
                                                   Somewhat high priority                                          24.1%
Leisure travel will be a _________

                                     Neutral - neither high nor low priority                                                 30.3%

                                                    Somewhat low priority                7.8%

                                                               Low Priority          5.2%
                                                                                                    10.1%
                                                    Extremely low priority           4.9%

                                                                               0%   5%      10%     15%      20%   25%     30%   35%

                                                                                                                                       PAGE 23
LEISURE TRAVEL AS A SPENDING PRIORITY
               Top 3-Box Score (High Priority - Any level)        Bottom 3-Box Score (Low priority - Any level)
                                                                       Pandemic begins
 80%
 70%
 60%                                                                  70.6%                                       51.7%
 50%                                                                                                44.8%
                                                                                       35.4%
 40%
 30%
 20%
 10%
  0%
       Winter 2018 Spring 2018    Fall 2018   Winter 2019    Summer   Winter 2020    Summer        Fall 2020   Winter 2021
                                                              2019                    2020

              Question: Thinking carefully about how you expect to spend your income in the NEXT 12 MONTHS,
              please use the scale below to describe your spending priorities in next year.

                                                                                                                             PAGE 24
How much IN TOTAL is the
maximum you will spend on
leisure travel (including
airfare, accommodations and
all other trip related
spending) during the NEXT
TWELVE (12) MONTHS?
MAXIMUM LEISURE TRAVEL BUDGET
                                                                                                           2.8%
Question: How much IN TOTAL is          Over $4000                                                 27.7%    July
the maximum you will spend on
leisure travel (including airfare,   $3501 to $4000      4.1%
accommodations and all other trip
related spending) during the         $3001 to $3500              7.0%
NEXT TWELVE (12) MONTHS?
                                     $2501 to $3000             6.3%
                                                                                    Mean= $3,865
                                     $2001 to $2500       4.1%

                                     $1501 to $2000                8.8%

                                     $1001 to $1500             6.7%

                                      $501 to $1000                        13.9%

                                       Zero to $500                                   20.7%

                                                  0.0%   5.0%     10.0%   15.0%    20.0%   25.0%   30.0%

                                                                                                                   PAGE 26
MAXIMUM LEISURE TRAVEL BUDGET (MEAN)

$4,500    Pre-pandemic average = $3,499
                                                                                                                    $4,180

$4,000                                                             $3,865                                                        $3,847
                                        $3,643                                                                                            $3,865
                                                                                             $3,649
                                                       $3,544               $3,698                      $3,642
                  $3,445
$3,500                         $3,381
                                              $3,632
                      $3,453                                                              $3,232              $3,212
         $3,362
$3,000                            $3,261                     $3,147             $3,133
                                                                                                                             $2,929

$2,500
                                                                                                                       Pandemic
                                                                                                                       begins
$2,000

                           Question: How much IN TOTAL is the maximum you will spend on leisure travel (including airfare,
                           accommodations and all other trip related spending) during the NEXT TWELVE (12) MONTHS?
                                                                                                                                             PAGE 27
Destination Travel Plans for 2021
                                    PAGE 28
EXPECTATIONS TO VISIT DESTINATION TYPES, 2021

                                                                                          Percent taking at least one trip
Question: In the NEXT TWELVE
                                                     Cities or metropolitan areas                                                59.4%
MONTHS, how many trips will you
take that will include each of the                     Beach destinations/resorts                                              55.8%

following types of leisure                          Small towns, villages or rural
                                                                                                                             52.2%
                                                      destinations/attractions
destinations?                        State, county or regional parks or recreation
                                                                                                               36.3%
                                                         areas

                                                              U.S. National Parks                             34.7%

                                                     Mountain destinations/resort                           30.7%

                                                      Theme or amusement parks                           27.7%

                                                      Desert destinations/resorts                   20.3%

                                                                                     0%    10%   20%    30%    40%     50%     60%     70%
                                                                                                                                         PAGE 29
EXPECTATIONS TO VISIT DESTINATION TYPES, 2016-2021

                                        80%
   Cities or metropolitan areas
                                        70%
   Small towns, villages or rural
   destinations/attractions
                                        60%
   Beach destinations/resorts

                                        50%
   Mountain destinations/resort

                                        40%
   Desert destinations/resorts

                                        30%
   Theme or amusement parks

                                        20%
   U.S. National Parks

                                        10%
   State, county or regional parks or
   recreation areas
                                        0%
                                              Winter 2016 January 2017 Winter 2018 Winter 2019 Winter 2020 Winter 2021

                                                                                                                         PAGE 30
NUMBER OF TRIPS EXPECTED IN 2021

                                                                                           Number of Trips Expected
Question: In the NEXT TWELVE
                                                     Cities or metropolitan areas                                                59.4%          1.42
MONTHS, how many trips will you
                                                    Small towns, villages or rural
take that will include each of the                    destinations/attractions                                          55.8%          1.19

following types of leisure                             Beach destinations/resorts                                52.2%          1.04

destinations?                        State, county or regional parks or recreation
                                                                                                         36.3%         0.83
                                                         areas

                                                              U.S. National Parks                  34.7%        0.65

                                                     Mountain destinations/resort                 30.7%    0.60

                                                      Theme or amusement parks               27.7%       0.51

                                                      Desert destinations/resorts          20.3%    0.40

                                                                                     0.0    0.2    0.4    0.6     0.8     1.0     1.2         1.4   1.6

                                                                                                                                                       PAGE 31
TRIPS EXPECTED IN 2021
                                                                    Number of Trips Expected

                                        2.00
   Cities or metropolitan areas
                                        1.80
   Small towns, villages or rural
                                        1.60
   destinations/attractions
   Beach destinations/resorts           1.40

                                        1.20
   Mountain destinations/resort
                                        1.00
   Desert destinations/resorts          0.80

                                        0.60
   Theme or amusement parks
                                        0.40
   U.S. National Parks                  0.20

                                        0.00
   State, county or regional parks or
   recreation areas                            Winter 2016   January 2017   Winter 2018   Winter 2019   Winter 2020   Winter 2021

                                                                                                                                PAGE 32
DESTINATION EXCITEMENT
                                                                    Top 3 Box Score (8-10)
Question: Thinking carefully
                                     Beach destinations/resorts                                       52.3%
about THE NEXT TWELVE (12)
MONTHS. Use the 10-point                   U.S. National Parks                                39.4%
scale where 10 = "Very excited"
                                   Cities or metropolitan areas                               39.0%
and 1 = "Not at all excited" to
                                  Small towns, villages or rural
state how generally excited you                                                              38.5%
                                    destinations/attractions
are to visit each in the          Mountain destinations/resorts                              36.1%
upcoming year?
                                    Theme or amusement parks                          29.6%

                                    Desert destinations/resorts                    25.8%

                                                                   0% 10% 20% 30% 40% 50% 60%

                                                                                                              PAGE 33
DESTINATION EXCITEMENT
       Cities & Metropolitan Areas                                 Beach Destinations & Resorts
                 Top 3 Box Score (8-10)                                       Top 3 Box Score (8-10)

 70%                                                         70%
                                                                            60.4%    60.7%    59.0%    60.8%
 60%                                                         60%   57.0%
       53.2%                               54.1%
                         49.6%                                                                                  52.3%
                49.2%
 50%                              47.1%                      50%

 40%                                                39.0%
                                                             40%

 30%                                                         30%

 20%                                                         20%

 10%                                                         10%

  0%                                                         0%
       Winter   Winter   Winter   Winter   Winter   Winter         Winter   Winter   Winter   Winter   Winter   Winter
       2016     2017     2018     2019     2020     2021           2016     2017     2018     2019     2020     2021

                                                                                                                         PAGE 34
DESTINATION EXCITEMENT
       Small towns, villages or rural                                          Theme Parks
         destinations/attractions                                             Top 3 Box Score (8-10)
                  Top 3 Box Score (8-10)
 70%                                                         70%

 60%                                                         60%

 50%            45.7%    45.3%                               50%
       42.1%                      42.4%                                     42.2%    42.7%
                                           40.1%    38.5%          39.6%                      40.8%
 40%                                                         40%
                                                                                                       34.3%
 30%                                                                                                            29.6%
                                                             30%

 20%                                                         20%

 10%                                                         10%

  0%                                                         0%
       Winter   Winter   Winter   Winter   Winter   Winter         Winter   Winter   Winter   Winter   Winter   Winter
       2016     2017     2018     2019     2020     2021           2016     2017     2018     2019     2020     2021

                                                                                                                         PAGE 35
DESTINATION EXCITEMENT

       Mountain Destinations & Resorts                                       U.S. National Parks
                   Top 3 Box Score (8-10)                                      Top 3 Box Score (8-10)

 70%                                                          60%

 60%                                                                         49.0%
                                                              50%
                                                                                      45.8%
 50%                                                                                           42.8%    42.2%
                                                                    40.4%                                        39.4%
                          42.0%                               40%
         39.5%   40.0%             40.8%
 40%                                        37.1%    36.1%
                                                              30%
 30%
                                                              20%
 20%

 10%                                                          10%

  0%                                                          0%
        Winter   Winter   Winter   Winter   Winter   Winter         Winter   Winter   Winter   Winter   Winter   Winter
        2016     2017     2018     2019     2020     2021           2016     2017     2018     2019     2020     2021

                                                                                                                          PAGE 36
INABILITY TO FULLY ENJOY TRAVEL RIGHT NOW
How much do you agree with the following statement?
Statement: If I were to travel now for leisure, I would not be able to fully enjoy it.

                                                                                               Historical data
                                                  Agree, 38.2%
                                                                                                                 Agree or Strongly Agree   Disagree or Strongly Disagree
                                                                                                 70%
                                                                                                       60.5%                                                               65.2%
                                                                                                 60%
    Strongly
  agree, 27.0%                                                                                   50%
                                                                                                 40%

                                                             Neutral (neither                    30%
                                                                agree nor                        20%                                                                       19.0%
                                                               disagree),                              19.2%
                                                                                                 10%
      Strongly disagree,                                         15.9%
            6.8%                                 Disagree, 12.2%                                  0%

(Base: Base: Coronavirus Travel Sentiment Survey, Destination Analysts, Inc. Waves 20, 28-46
data. All respondents, 1,206, 1,200, 1,205, 1,203, 1,203, 1,204, 1,203, 1,203, 1,205,
1,206, 1,205, 1,205, 1,204, 1,206, 1,201, 1,207, 1,206, 1,225, 1,205 and 1,206
completed surveys.)

                                                                                                                                                                           PAGE 37
DESIRED EXPEREINCES
INTEREST IN TRIP EXPERIENCES

Question: In general, how                                      Enjoying scenic beauty                                                          69.8%
                                                   Outdoor activities (warm weather)                                                         65.9%
interested are you in taking                                          Take Road Trips                                                   61.6%
                                                Visits to beach destinations or resorts                                                 61.6%
LEISURE TRIPS which would                                     Visit U.S. National Parks                                              56.5%
                                                          Visiting historical attractions                                           55.3%
include the following:                                  Cuisine and food experiences                                               52.8%
                                                   Visit State, local or regional parks                                         51.9%
                               Small towns, villages or rural destinations/attractions                                        50.1%
                                                                  Big city experiences                                     44.2%
                                                             Visits to foreign countries                                   43.5%
                                                                         Arts & culture                                 42.2%
                         Visits to mountain destinations/resorts (including ski resorts)                                42.1%
                                                  Attend Festivals and Special Events                                 38.3%
                                                Visits to desert destinations or resorts                             36.6%
INTERESTED OR                                             Theme or amusement parks                                   36.4%
VERY INTERESTED                                             Outdoor activities (winter)                      26.0%
                                                                                            0%   10%   20%   30%     40%     50%    60%      70%     80%

                                                                                                                                                     PAGE 39
INTEREST IN TRIP EXPERIENCES

Question: Tell us about your                                Have fun                                              79.5%
                                                               Relax                                          71.3%
TYPICAL PRIORITIES when                               Find happiness                                      64.3%
                                              Spend time with family                                      64.2%
traveling for leisure. However    Spend time with my spouse/partner                                      62.9%
                                                        Escape stress                                  60.0%
you personally define each, use        Have brand new experiences                                   53.9%
                                           Excitement of exploration                              50.3%
the scale provided to indicate                      Escape boredom                                50.0%
                                                 Connect with nature                           44.3%
how important each is to you              Food/culinary experiences                           43.8%
                                                  Outdoor recreation                         42.2%
when traveling for leisure.                     Cultural expereinces                        39.1%
                                                 Learning/education                    29.3%
HIGH IMPORTANCE                             Attend festivals & events              22.6%
                                                Meeting new people                 21.9%
OR CRITICAL                                   Attend sporting events             18.4%
IMPORTANCE                                           Bragging rights          12.6%
                                                                        0% 10% 20% 30% 40% 50% 60% 70% 80% 90%

                                                                                                                          PAGE 40
TRAVEL GUILT
How much do you agree with the following statement?

Statement: I would feel guilty traveling right now.
                                                                                      Historical data
                                    Agree, 27.9%
                                                                                                        Agree or Strongly Agree        Disagree or Strongly Disagree
                                                                                        70%
                                                                                        60%                                    54.6%        53.5%                         53.2%
                                                                                                        51.8%                       50.8%                         49.5%
    Strongly                                                    Neutral (neither                                46.8%    47.9%                      49.3% 50.5%
                                                                                        50%46.8%
  agree, 25.3%                                                    agree nor
                                                                  disagree),            40%
                                                                    20.0%               30%
                                                                                                              29.3%                               28.3% 28.5%
                                                                                        20% 27.5%        24.5%          24.6%   23.8% 23.6% 24.3%             25.3% 26.8%

                                                         Disagree, 15.5%                10%
        Strongly disagree,
             11.4%                                                                       0%

(Base: Waves 36-46 data. All respondents, 1,206, 1,205, 1,205, 1,204, 1,206, 1,201,
1,207, 1,206, 1,225, 1,205 and 1,206 completed surveys.)

                                                                                                                                                                          PAGE 41
Travel Planning Resources
                            PAGE 42
USE OF ONLINE VIDEO IN TRAVEL PLANNING

Question: In the PAST TWO (2)
YEARS, have you used ONLINE
VIDEO including visiting video                                     No, 66.3%
sharing websites (e.g. Youtube.com,
AOL Video or Google Video) to plan
any of your leisure trips?
                                      Yes, 29.6%

                                                   I don't know,
                                                       4.2%

                                                                               PAGE 43
FREQUENCY OF VIDEO USE IN TRAVEL PLANNING

Question: How often do
                             Always – I use videos for every trip I take                  22.0%
you use ONLINE VIDEOS                                                                                         54.0%
to plan your leisure trip?
                             Usually – I use videos for most of my trips                          32.0%
(Select one)

                              Sometimes – I use videos, but not usually                             35.7%

                             Rarely – I seldom use video often to plan
                                                                                  10.3%
                                             my travel

                                                                           0%   10%   20%   30%     40%     50%

                                                                                                                  PAGE 44
TRAVEL PLANNING TASKS DONE WITH ONLINE VIDEO

Question: In the PAST TWO              Things to see and do                                                           64.5%

(2) YEARS, which of these         Which destinations to visit                                                 54.1%

travel tasks have use used                    Places to stay                                       44.8%

ONLINE VIDEO to help with?
                                     Restaurants and dining                                        44.0%

(Select all that apply)
                              General travel advice or tips                                     39.1%

                                           Events and shows                             30.3%

                             Finding discounts and bargains                         24.2%

                                           NONE OF THESE             2.0%

                                                                0%      10%   20%    30%    40%         50%    60%     70%

                                                                                                                          PAGE 45
LENGTH OF TRAVEL VIDEOS USED

Question: Thinking of travel
                                  Very short: 20 seconds or less              14.5%

videos that influenced the                                                                      31.7%
                                          Short: 20-45 seconds                  17.2%
above decision(s) – what
length were these videos?      Medium: 45 seconds to 2 minutes                                    38.0%
                                                                                                                72.6%
(Select all that apply)
                                Medium to Long: 2 to 4 minutes                                  34.6%

                                              Long: 4-8 minutes                         26.0%
                                                                                                    40.3%
                               Ultra-Long: More than 8 minutes                14.3%

                                                                   0%   10%     20%     30%       40%     50%

                                                                                                                 PAGE 46
RECEPTIVITY TO MARKETING CHANNELS

Question: Please think about how                 Websites found via a search engine                                       35.8%
                                                                                    Email                         25.1%
travel destinations could best reach    Official local or state visitor guides (printed)                        23.4%
                                       Streaming video services (YouTube, Hulu, etc.)                           23.3%
you with their messages right now.
                                               Travel or lifestyle magazines (printed)                         22.7%
Where would you generally be                        Online content (articles and blogs)                       22.1%
                                                                              Facebook                        22.1%
MOST RECEPTIVE to learning about                                   Broadcast television                   17.7%
                                                                              Instagram                 16.2%
new destinations to visit? (Please                Newspaper travel sections (printed)                  14.9%
                                                        Advertisements on the Internet                13.9%
select all that apply)                                                            Twitter         9.7%
                                                                                Pinterest        9.1%
                                                                        Travel podcasts          9.0%
                                                             APPs on my mobile phone            7.9%
                                                                         Text messages          7.9%
                                                                                   TikTok     6.6%
                                          Digital influencers (online personalities with…    5.6%
                                                                      NONE OF THESE                  13.0%
                                                                                      0%    5% 10% 15% 20% 25% 30% 35% 40%

                                                                                                                              PAGE 47
RECEPTIVITY TO MARKETING CHANNELS

Question: Please think about how                 Websites found via a search engine                                       35.8%
                                                                                    Email                         25.1%
travel destinations could best reach    Official local or state visitor guides (printed)                        23.4%
                                       Streaming video services (YouTube, Hulu, etc.)                           23.3%
you with their messages right now.
                                               Travel or lifestyle magazines (printed)                         22.7%
Where would you generally be                        Online content (articles and blogs)                       22.1%
                                                                              Facebook                        22.1%
MOST RECEPTIVE to learning about                                   Broadcast television                   17.7%
                                                                              Instagram                 16.2%
new destinations to visit? (Please                Newspaper travel sections (printed)                  14.9%
                                                        Advertisements on the Internet                13.9%
select all that apply)                                                            Twitter         9.7%
                                                                                Pinterest        9.1%
                                                                        Travel podcasts          9.0%   Total Social Media
                                                             APPs on my mobile phone            7.9%
                                                                         Text messages          7.9%           36.8%
                                                                                   TikTok     6.6%
                                          Digital influencers (online personalities with…    5.6%
                                                                      NONE OF THESE                  13.0%
                                                                                      0%    5% 10% 15% 20% 25% 30% 35% 40%

                                                                                                                              PAGE 48
SINGLE MOST RECEPTIVE CHANNEL
Question: Which would be the
                                                                                 Email                                    18.1%
SINGLE BEST WAY a travel                      Websites found via a search engine                                  13.2%
                                                                           Facebook                       7.6%
destination could reach you right   Streaming video services (YouTube, Hulu, etc.)                      7.0%
                                     Official local or state visitor guides (printed)                5.6%
now? (Select one)                                Online content (articles and blogs)                 5.6%
                                            Travel or lifestyle magazines (printed)                  5.4%
                                                                Broadcast television               4.9%
                                                                           Instagram              4.3%
                                               Newspaper travel sections (printed)             3.2%
                                                                      Text messages           2.7%
                                                     Advertisements on the Internet          2.5%
                                                                               Twitter     1.7%
                                                          APPs on my mobile phone         1.3%
                                                                             Pinterest   1.2%
                                                                                TikTok   1.2%
                                                                     Travel podcasts     1.2%
                                       Digital influencers (online personalities with…   1.0%
                                                                   NONE OF THESE                                  12.8%
                                                                                   0%           5%          10%     15%    20%

                                                                                                                              PAGE 49
FREQUENCY OF USE

Question: In general, when                     Websites found via a search engine                                       44.9%
                                               Official websites of visitors bureaus                     25.0%
planning your travel which     Official websites of state or natl govt travel offices                    24.8%
                                    Streaming video services (YouTube, Hulu, etc.)                      23.9%
best describes how often you                     Online content (articles and blogs)                    23.8%
                                      Official local or state visitor guides (printed)                  22.8%
use each of the following?                                                 Facebook                   19.9%
                                                                Broadcast television                  19.5%
                                            Travel or lifestyle magazines (printed)               18.6%
                                                                           Instagram              17.2%

ALWAY S OR                                                APPs on my mobile phone                17.1%
                                               Newspaper travel sections (printed)              15.4%
FREQUENTLY USE                                                                Twitter          12.3%
                                                                            Pinterest         12.0%
                                 Digital influencers (online personalities with large…        11.6%
                                                                     Travel podcasts          10.9%
                                                                               TikTok         10.6%
                                                                          No Answer                           29.4%
                                                                                         0%      20%              40%           60%

                                                                                                                                PAGE 50
FREQUENCY OF USE

Question: In general, when                     Websites found via a search engine                                       44.9%
                                               Official websites of visitors bureaus                     25.0%
planning your travel which     Official websites of state or natl govt travel offices                    24.8%
                                    Streaming video services (YouTube, Hulu, etc.)                      23.9%
best describes how often you                     Online content (articles and blogs)                    23.8%
                                      Official local or state visitor guides (printed)                  22.8%
use each of the following?                                                 Facebook
                                                                Broadcast television
                                                                                                      19.9%
                                                                                                                 Total DMO
                                                                                                      19.5%
                                            Travel or lifestyle magazines (printed)               18.6%            37.1%
                                                                           Instagram              17.2%

ALWAY S OR                                                APPs on my mobile phone                17.1%
                                               Newspaper travel sections (printed)              15.4%
FREQUENTLY USE                                                                Twitter          12.3%
                                                                            Pinterest         12.0%
                                 Digital influencers (online personalities with large…        11.6%
                                                                     Travel podcasts          10.9%
                                                                               TikTok         10.6%
                                                                          No Answer                           29.4%
                                                                                         0%      20%              40%           60%

                                                                                                                                PAGE 51
TRAVEL ASPIRATIONS, 2021

                           PAGE 52
MOST DESIRED DOMESTIC DESTINATIONS
                                     New York City                                                     17.1%
Question: What are the                   Las Vegas                                             14.5%
                                            Florida                                    11.7%
five domestic destinations    Orlando/DisneyWorld                               9.7%
                                       Los Angeles                       7.3%
that you would most like                 California                     7.2%
                                            Hawaii                      7.0%
to visit in the upcoming                   Chicago               4.9%
                                             Miami               4.9%
                                             Texas              4.5%
year? (Write in up to five)            Yellowstone              4.5%
                                         San Diego              4.4%
                                           Arizona             4.1%
                                    Grand Canyon              3.8%
                                    Washngton DC              3.7%
                                      New Orleans             3.7%
                                             Boston           3.7%
                                          Colorado            3.7%
                                      San Francisco          3.4%
                                             Dallas        2.6%
                                      Myrtle Beach         2.4%
                                            Alaska         2.4%
                                                      0%      5%            10%            15%            20%

                                                                                                                PAGE 53
INTERNATIONAL ASPIRATIONS: NEXT 12 MONTHS

Question: How likely are you to
                                                      Very likely                 16.6%
travel outside the United States                                                                30.1%
for leisure in the NEXT TWELVE
                                                           Likely               13.5%
(12) MONTHS?
                             Neutral (neither likely nor unlikely)               15.2%

                                                         Unlikely               13.2%

                                                                                                              54.7%
                                                   Very unlikely                                   41.5%

                                                                     0%   10%     20%     30%    40%    50%

                                                                                                                PAGE 54
INTERNATIONAL ASPIRATIONS: NEXT 3 YEARS

Question: How likely are you to
                                                             Very likely                         30.6%
travel outside the United States
                                                                                                              47.1%
for leisure in the NEXT THREE (3)
                                                                  Likely                16.5%
YEARS?

                                    Neutral (neither likely nor unlikely)               15.2%

                                                                Unlikely         8.9%
                                                                                                              37.6%
                                                          Very unlikely                         28.7%

                                                                            0%           20%            40%

                                                                                                                 PAGE 55
INTERNATIONAL ASPIRATIONS: DESIRED REGIONS

Question: Which regions
                                                         Europe                                  30.6%
are you likely to visit in the
                                                        Canada                           24.4%
NEXT THREE (3) YEARS?
                                 Mexico, Central America and the
                                                                                       21.9%
                                           Caribbean

                                        Asia and the Middle East               11.0%

                                   Australia, New Zealand & the
                                                                          8.3%
                                           Pacific Islands

                                                  South America           7.7%

                                                          Africa        4.8%

                                                                   0% 5% 10% 15% 20% 25% 30% 35%

                                                                                                         PAGE 57
MOST DESIRED DESTINATIONS: EUROPE

                                                  Italy                                                      31.7%
Question: What destinations (if       United Kingdom                                           21.9%
                                                France                                         21.7%
any) in EUROPE would you most               Germany                                    16.5%
                                                 Spain                              14.4%
like to visit? (Write in as many as            Ireland                            13.1%
                                               London                             12.7%
three)                                            Paris                    9.2%
                                             Scotland                     8.7%
                                              Greece                     8.0%
                                          Netherlands                  6.5%
                                             Portugal                5.4%
                                               Austria             4.4%
                                          Switzerland             3.9%
                                                 Rome            3.3%
                                             Denmark           2.6%
                                                 Russia        2.5%
                                              Norway           2.5%
                                               Poland          2.3%
                                              Croatia          2.3%
                                                          0%     5%     10%       15%    20%    25%    30%    35%
                                                                                                                     PAGE 58
MOST DESIRED DESTINATIONS: CANADA

Question: What destinations                       Toronto                                                 28.9%
                                               Vancouver                                        20.1%
(if any) in CANADA would you                     Montreal                                     18.4%
                                          Niagara Falls                               11.9%
                                                  Quebec                             11.1%
most like to visit? (Write in as                  Ontario                     7.6%
                                        British Columbia                     7.2%
many as three)                      Banff National Park                    6.1%
                                                  Ottawa                4.1%
                                                  Victora              3.9%
                                             Nova Scotia               3.7%
                                            Quebec City              2.7%
                                                 Calgary            2.3%
                                                  Alberta          2.0%
                                                Edmonton           1.8%
                                   Prince Edward Island           1.4%
                                                   Yukon         1.2%
                                        New Foundland            1.2%
                                              Lake Louise        1.2%
                                           New Bruswick          1.0%
                                                            0%       5%      10%       15%    20%   25%   30%     35%

                                                                                                                   PAGE 59
MOST DESIRED DESTINATIONS: MEXICO/CENTRAL AM/CARIBBEAN

Question: What destinations (if               Cancún                                                14.4%
                                            Bahamas                                       10.3%
any) in MEXICO, CENTRAL                       Mexico                                     10.0%
                                               Aruba                                     10.0%
AMERICA & THE CARIBBEAN             Cabo San Lucas
                                             Jamaica
                                                                                     8.7%
                                                                                   8.2%
                                             Cozumel                               8.2%
would you most like to visit?             Costa Rica                            7.3%
                                         Mexico City                         6.4%
(Write in as many as three)               Puerto Rico                    5.0%
                                     Puerto Vallarta                  4.1%
                                          Caribbean                  3.9%
                                  Dominican Republic                3.7%
                                         St. Maarten               3.4%
                                       Virgin Islands             3.2%
                                               Belize             3.2%
                                    Cayman Islands               3.0%
                                                Tulum         2.1%
                                             Panama           2.1%
                                           Barbados          1.8%
                                                        0%   2%   4%    6%     8%    10%    12%   14%   16%

                                                                                                              PAGE 60
MOST DESIRED DESTINATIONS: ASIA & THE MIDDLE EAST

Question: What destinations              Japan                                                 37.4%
                                          China                                  16.9%
(if any) in ASIA & THE             South Korea                                14.6%
                                            India                     10.0%
                                      Thailand                       9.1%
MIDDLE EAST would you               Singapore                      7.8%
                                    Philippines                    7.8%
most like to visit? (Write in as    Hong Kong                     6.8%
                                           Israel                6.4%
many as three)                            Tokyo                 5.5%
                                       Vietnam                 5.0%
                                        Taiwan                 5.0%
                                          Dubai                5.0%
                                        Jordan                4.6%
                                             UAE            3.7%
                                         Turkey            2.7%
                                          Egypt            2.7%
                                     Malaysia             2.3%
                                    Cambodia              2.3%
                                     Indonesia           1.8%
                                                    0%            10%             20%    30%   40%

                                                                                                     PAGE 61
MOST DESIRED DESTINATIONS: AUSTRALIA/NEW ZEALAND/PACIFIC

Question: What destinations (if               Sydney                                                   31.9%
                                          Melbourne                     9.0%
                                            Auckland                 7.2%
any) in AUSTRALIA, NEW                  The Outback               4.8%
                                  Great Barrier Reef              4.8%
ZEALAND & THE PACIFIC ISLANDS                      Fiji           4.8%
                                                 Tahiti          4.2%
would you most like to visit?                Brisbane            4.2%
                                            Tasmania          2.4%
(Write in as many as three)                      Perth        2.4%
                                         Queensland          1.8%
                                              Hawaii         1.8%
                                    French Polynesia         1.8%
                                           Bora Bora         1.8%
                                          Wellington        1.2%
                                           Canberra         1.2%
                                          Ayers Rock        1.2%
                                                Cairns     0.6%
                                       Alice Springs       0.6%
                                            Adelaide       0.6%
                                                          0%   5%    10%       15%   20%   25%   30%    35%

                                                                                                               PAGE 62
MOST DESIRED DESTINATIONS: SOUTH AMERICA

Question: What destinations (if                    Brazil                                             29.9%
                                               Argentina                                           27.9%
any) in SOUTH AMERICA would                          Peru                                  21.4%
                                                Colombia                               18.8%
                                                     Chile                         15.6%
you most like to visit? (Write in as             Ecuador                5.2%
                                                 Uruguay              3.9%
many as three)                         Galápagos Islands             3.2%
                                            Machu Picchu            2.6%
                                          Rio de Janeiro           1.9%
                                               Patagonia           1.9%
                                         Falkland Islands          1.9%
                                            Buenos Aires           1.9%
                                                   Aruba           1.9%
                                               Paraguay           1.3%
                                             Montevideo           1.3%
                                                  Bolivia         1.3%
                                                  Bogota          1.3%
                                              Angel Falls         1.3%
                                       Amazon Rainforest          1.3%
                                                             0%      5%    10%   15%   20%   25%   30%    35%

                                                                                                              PAGE 63
MOST DESIRED DESTINATIONS: AFRICA

                                       South Africa                                               4.4%
Question: What destinations (if               Egypt                              2.0%
                                           Morocco                        1.3%
any) in AFRICA would you most                 Kenya                     1.1%
                                            Nigeria                   1.0%
like to visit? (Write in as many as    Madagascar                   0.8%
                                          Tanzania                0.7%
three)                                   Zimbabwe               0.5%
                                             Ghana              0.5%
                                            Zambia            0.3%
                                           Uganda             0.3%
                                             Tunisia          0.3%
                                             Congo            0.3%
                                               Togo         0.2%
                                              Sudan         0.2%
                                            Nairobi         0.2%
                                             Liberia        0.2%
                                      Johannesburg          0.2%
                                           Ethiopia         0.2%
                                        Cape Town           0.2%
                                          Botswana          0.2%
                                                       0%           1%           2%     3%   4%          5%

                                                                                                          PAGE 64
DESTINATION PERFORMANCE BENCHMARKS

                                     PAGE 65
TWO QUESTIONS
Question: I have          Question: I am likely to
traveled to (or within)   travel to (or within) in
in PAST THREE (3)         the NEXT THREE (3)
YEARS                     YEARS

                                                     PAGE 66
RECENT PAST - LIKELY FUTURE VISITATION: THE WEST
                        RECENT VISITATION (PAST 3 YEARS)                                                   LIKELY FUTURE VISITATION (NEXT 3 YEARS)
           Los Angeles, California                             28.9%                                       Las Vegas, Nevada                                                34.0%
              Las Vegas, Nevada                              25.5%                              Hawaii (anywhere in the state)                                           30.5%
         San Francisco, California                       21.0%                                         Grand Canyon, Arizona                                           28.0%
            San Diego, California                       19.0%                                         San Francisco, California                                       26.6%
                 Phoenix, Arizona                     17.4%                                             Los Angeles, California                                      26.3%
              Seattle, Washington                    15.2%                                                    Phoenix, Arizona                                      24.6%
 Anaheim/Disneyland, California                     15.0%                                                San Diego, California                                      24.4%
          Grand Canyon, Arizona                    13.9%                                                   Seattle, Washington                                     24.1%
   Hawaii (anywhere in the state)                  13.4%                                    Alaska (anywhere else in the state)                                    23.9%
         Napa Valley, California                   13.2%                                              Napa Valley, California                                      23.7%
                Portland, Oregon                  11.8%                                             Lake Tahoe area (CA/NV)                                       22.9%
      Sonoma County, California                   11.8%                                                     Anchorage, Alaska                                    21.5%
Santa Barbara County, California                 11.6%                                                       Portland, Oregon                                    21.5%
       Lake Tahoe area (CA/NV)                   11.6%                                              Sonoma County, California                                    21.4%
                   Tucson, Arizona               11.3%                                                          Tucson, Arizona                                 21.1%
              Salt Lake City, Utah               10.9%                                         Anaheim/Disneyland, California                                   20.4%
                    Reno, Nevada                10.4%                                        Santa Barbara County, California                                  19.9%
  Rural Nevada (outside Reno or…               9.6%                                                        Salt Lake City, Utah                                19.6%
       Newport Beach, California               9.2%                                                          Fairbanks, Alaska                                19.1%
    Alaska (anywhere else in the…              8.8%                                                 Newport Beach, California                                 18.4%
     Monterey County, California              8.5%                                                Monterey County, California                                 18.4%
               Anchorage, Alaska              8.1%                                                               Reno, Nevada                                 18.4%
                Fairbanks, Alaska            6.8%                                               Rural Nevada (outside Reno or…                               17.4%
                                 0%          10%          20%         30%          40%                                           0%           10%           20%           30%           40%
                         Question: I have traveled to (or within) in PAST THREE (3) YEARS                          Question: I am likely to travel to (or within) in the NEXT THREE (3) YEARS

                                                                                                                                                                                      PAGE 67
RATIO OF PAST TO FUTURE VISITATION: THE WEST
                                 Fairbanks, Alaska                                                   2.83
                Alaska (anywhere else in the state)                                                2.72
                                Anchorage, Alaska                                                 2.65
                    Hawaii (anywhere in the state)                                         2.28
                      Monterey County, California                                        2.18
                           Grand Canyon, Arizona                                      2.02
                        Newport Beach, California                                    2.00
             Lake Tahoe area (California/Nevada)                                     1.98
                                    Tucson, Arizona                                1.87
                                 Portland, Oregon                                 1.83
         Rural Nevada (outside Reno or Las Vegas)                                 1.82
                        Sonoma County, California                                 1.82
                          Napa Valley, California                                1.80
                               Salt Lake City, Utah                              1.79
                                     Reno, Nevada                                1.78
                 Santa Barbara County, California                               1.72
                               Seattle, Washington                            1.59
                                  Phoenix, Arizona                         1.41
                   Anaheim/Disneyland, California                         1.36
                               Las Vegas, Nevada                          1.33
                             San Diego, California                       1.29
                          San Francisco, California                      1.27
                            Los Angeles, California               0.91
                                                      0%   50%   100% 150% 200% 250% 300%

                                                                                                            PAGE 68
FAMILIARITY (TOP 2 BOX SCORES)

Question: How familiar are you                          Las Vegas, Nevada
                                                     Los Angeles, California
                                                                                                             46.7%
                                                                                                         40.0%
                                                   San Francisco, California                            39.5%
with the attractions and things             Anaheim/Disneyland, California
                                             Hawaii (anywhere in the state)
                                                                                                       37.0%
                                                                                                     34.0%
                                                      San Diego, California                        31.7%
to see and do in each                                      Phoenix, Arizona                      28.2%
                                                        Seattle, Washington                     27.3%
                                                   Napa Valley, California                      26.9%
destination?                          Lake Tahoe area (California/Nevada)                     24.1%
                                                              Reno, Nevada                   22.7%
                                                 Sonoma County, California                   22.4%
                                                             Tucson, Arizona                 22.3%
                                                          Portland, Oregon                   21.9%
                                                    Grand Canyon, Arizona                   20.8%
    FAMILIAR OR                           Santa Barbara County, California                 19.8%
                                                        Salt Lake City, Utah              19.5%
    VERY FAMILIAR                                Newport Beach, California               17.0%
                                         Alaska (anywhere else in the state)            16.3%
                                               Monterey County, California              16.0%
                                                         Anchorage, Alaska              16.0%
                                  Rural Nevada (outside Reno or Las Vegas)              15.6%
                                                          Fairbanks, Alaska            14.2%
                                                                               0%   10% 20% 30% 40% 50% 60%

                                                                                                                     PAGE 69
APPEAL (TOP 2 BOX SCORES)

Question: Given what you                    Hawaii (anywhere in the state)
                                                   Grand Canyon, Arizona                               49.1%
                                                                                                            58.8%

                                                       Las Vegas, Nevada                           41.9%
currently know and feel about                     San Francisco, California
                                                     San Diego, California
                                                                                                 38.9%
                                                                                                 38.5%
                                     Lake Tahoe area (California/Nevada)                        37.5%
these destinations, please use          Alaska (anywhere else in the state)                     37.0%
                                                  Napa Valley, California                      35.3%
                                                        Anchorage, Alaska                      35.0%
the scale below to state how               Anaheim/Disneyland, California                     34.2%
                                                          Phoenix, Arizona                    34.2%
appealing each is to you as a                          Seattle, Washington
                                                         Fairbanks, Alaska
                                                                                              34.1%
                                                                                             32.7%
                                                    Los Angeles, California                  32.6%
place to visit on a vacation?                   Sonoma County, California
                                                            Tucson, Arizona
                                                                                            30.7%
                                                                                            29.7%
                                                         Portland, Oregon                  28.8%
                                         Santa Barbara County, California                  28.2%
                                                             Reno, Nevada                 27.3%
APPEALING OR                                  Monterey County, California
                                                Newport Beach, California
                                                                                          26.2%
                                                                                         25.8%
VERY APPEALING                                         Salt Lake City, Utah
                                 Rural Nevada (outside Reno or Las Vegas)
                                                                                         25.5%
                                                                                        22.8%
                                                                              0% 10% 20% 30% 40% 50% 60% 70%

                                                                                                                    PAGE 70
RECENT PAST - LIKELY FUTURE VISITATION: THE EAST
                                RECENT VISITATION (PAST 3 YEARS)                                                          LIKELY FUTURE VISITATION (NEXT 3 YEARS)
         New York City, New York                                    27.2%                                     New York City, New York                                                         30.8%
                   Orlando, Florida                               24.5%                                                 Orlando, Florida                                                     30.4%
             Boston, Massachusetts                             21.0%                                             The Florida Gulf Coast                                                   27.6%
            The Florida Gulf Coast                           19.4%                                                       Washington, DC                                                   27.4%
                   Washington, DC                            19.1%                                                Boston, Massachusetts                                                  27.2%
                     Miami, Florida                         17.9%                                                   Nashville, Tennessee                                                 26.8%
                    Tampa, Florida                          17.5%                                            Charleston, South Carolina                                              23.4%
        Philadelphia, Pennsylvania                         16.8%                                                           Miami, Florida                                           22.5%
               Nashville, Tennessee                       16.5%                                              Philadelphia, Pennsylvania                                             22.4%
                  Atlanta, Georgia                        16.2%                                                           Tampa, Florida                                           22.1%
St.Petersburg/Clearwater, Florida                       14.0%                                                       Savannah, Georgia                                              22.0%
                     Pittsburgh, PA                    12.9%                                                   Niagara Falls, New York                                             21.8%
         Atlantic City, New Jersey                     12.7%                                         St.Petersburg/Clearwater, Florida                                             21.7%
               Jacksonville, Florida                   12.7%                                         Hilton Head Island, South Carolina                                           21.1%
               Savannah, Georgia                      12.5%                                                             Atlanta, Georgia                                         20.7%
              St. Augustine, Florida                  12.2%                                                             Outer Banks, NC                                          20.5%
        Charleston, South Carolina                    11.9%                                                            Sarasota, Florida                                        20.1%
                  Sarasota, Florida                  11.4%                                                          Memphis, Tennessee                                          19.7%
               Memphis, Tennessee                    11.3%                                                    Atlantic City, New Jersey                                        18.9%
                     Baltimore, MD                   11.0%                                                         Baltimore, Maryland                                        18.5%
          Niagara Falls, New York                    10.8%                                                         St. Augustine, Florida                                     18.4%
Hilton Head Island, South Carolina                  10.1%                                                                        Pittsburgh                                   18.3%
                Louisville, Kentucky                10.1%                                                             Louisville, Kentucky                                   17.8%
                   Outer Banks, NC                  10.0%                                                        Charlottesville, Virginia                                  16.6%
            Charlottesville, Virginia             7.6%                                                              Jacksonville, Florida                                  15.5%
                                        0%       10%           20%           30%            40%                                               0%    5% 10% 15% 20% 25% 30% 35%
                                  Question: I have traveled to (or within) in PAST THREE (3) YEARS                                   Question: I am likely to travel to (or within) in the NEXT THREE (3) YEARS

                                                                                                                                                                                                        PAGE 71
RATIO OF PAST TO FUTURE VISITATION: THE EAST
                      Charlottesville, Virginia                                                 2.20
          Hilton Head Island, South Carolina                                                 2.08
                             Outer Banks, NC                                                2.05
                    Niagara Falls, New York                                                2.02
                  Charleston, South Carolina                                              1.97
                          Louisville, Kentucky                                     1.77
                         Savannah, Georgia                                         1.77
                            Sarasota, Florida                                      1.76
                         Memphis, Tennessee                                        1.75
                        Baltimore, Maryland                                      1.69
                         Nashville, Tennessee                                   1.62
          St.Petersburg/Clearwater, Florida                                   1.56
                        St. Augustine, Florida                               1.51
                   Atlantic City, New Jersey                                1.49
                             Washington, DC                                1.44
                      The Florida Gulf Coast                               1.43
                                    Pittsburgh                             1.42
                  Philadelphia, Pennsylvania                             1.33
                       Boston, Massachusetts                            1.29
                            Atlanta, Georgia                           1.27
                              Tampa, Florida                           1.26
                               Miami, Florida                          1.26
                             Orlando, Florida                         1.24
                         Jacksonville, Florida                        1.22
                   New York City, New York                          1.13
                                                  0%   50%   100%       150%       200%           250%

                                                                                                         PAGE 72
FAMILIARITY (TOP 2 BOX SCORES)

Question: How familiar are you                       Orlando, Florida
                                           New York City, New York
                                                                                                                 47.8%
                                                                                                                46.7%
                                                     Washington, DC                                          42.9%
with the attractions and things                Boston, Massachusetts
                                                       Miami, Florida
                                                                                                        36.5%
                                                                                                      34.3%
                                                      Tampa, Florida                                31.9%
to see and do in each                         The Florida Gulf Coast
                                          Philadelphia, Pennsylvania
                                                                                                    31.7%
                                                                                                   31.4%
                                            Niagara Falls, New York                                30.8%
destination?                                     Nashville, Tennessee
                                  St.Petersburg/Clearwater, Florida
                                                                                                 28.5%
                                                                                                27.8%
                                                    Atlanta, Georgia                           26.3%
                                           Atlantic City, New Jersey                          25.4%
                                                 Savannah, Georgia                           24.5%
                                                    Sarasota, Florida                       24.0%
                                                 Memphis, Tennessee                         23.9%
    FAMILIAR OR                                 Baltimore, Maryland
                                                St. Augustine, Florida
                                                                                           22.5%
                                                                                           22.4%
    VERY FAMILIAR                         Charleston, South Carolina
                                                 Jacksonville, Florida
                                                                                           22.0%
                                                                                           22.0%
                                                       Pittsburgh, PA                     20.9%
                                  Hilton Head Island, South Carolina                     20.8%
                                                  Louisville, Kentucky                   20.6%
                                                     Outer Banks, NC                     20.2%
                                              Charlottesville, Virginia              14.9%
                                                                          0%   10%    20%     30%      40%     50%       60%

                                                                                                                               PAGE 73
APPEAL (TOP 2 BOX SCORES*)

Question: Given what you                            Orlando, Florida
                                             The Florida Gulf Coast
                                                                                                      42.8%
                                                                                                     42.2%
                                          New York City, New York                                   40.0%
currently know and feel about                 Boston, Massachusetts
                                                Nashville, Tennessee
                                                                                                   39.3%
                                                                                                  38.3%
                                                     Washington, DC                               37.9%
these destinations, please use             Niagara Falls, New York
                                                       Miami, Florida
                                                                                                 36.3%
                                                                                                 36.2%
                                         Charleston, South Carolina                             36.1%
the scale below to state how                          Tampa, Florida
                                 St.Petersburg/Clearwater, Florida
                                                                                                36.1%
                                                                                                36.0%
                                                Savannah, Georgia                               35.3%
appealing each is to you as a                       Outer Banks, NC
                                 Hilton Head Island, South Carolina
                                                                                               34.7%
                                                                                               34.6%
                                                   Sarasota, Florida                          32.6%
place to visit on a vacation?                   Memphis, Tennessee
                                               St. Augustine, Florida
                                                                                            30.3%
                                                                                            30.3%
                                         Philadelphia, Pennsylvania                         30.0%
                                                    Atlanta, Georgia                      27.2%
                                                Jacksonville, Florida                   24.3%
                                          Atlantic City, New Jersey                    23.5%
APPEALING OR                                      Louisville, Kentucky
                                               Baltimore, Maryland
                                                                                       23.3%
                                                                                       22.9%
VERY APPEALING                                         Pittsburgh, PA
                                             Charlottesville, Virginia
                                                                                      22.1%
                                                                                      21.5%
                                                                         0%   10%   20%   30%   40%    50%    60%   70%

                                                                                                                          PAGE 74
RECENT PAST - LIKELY FUTURE VISITATION: CENTRAL
                             RECENT VISITATION (PAST 3 YEARS)                                                        LIKELY FUTURE VISITATION (NEXT 3 YEARS)
                  Chicago, Illinois                                    23.2%                                             Denver, Colorado                                     23.4%
                Denver, Colorado                         15.0%                                                             Chicago, Illinois                                  23.3%
                     Dallas, Texas                       14.6%                                                     New Orleans, Louisiana                                    22.4%
           New Orleans, Louisiana                      13.1%                                                  Montana (anywhere in state)                                   21.9%
               San Antonio, Texas                      12.6%                                                  Wyoming (anywhere in state)                                  21.1%
                     Austin, Texas                    11.9%                                                                   Dallas, Texas                                20.4%
                 St. Louis, Missouri                  11.9%                                        Rapid City, Mt. Rushmore, Badlands area                                19.3%
   Minneapolis-St. Paul, Minnesota                    11.9%                                                                   Austin, Texas                               19.2%
                   Houston, Texas                     11.6%                                                     Albuquerque, New Mexico                                  18.5%
             Kansas City, Missouri                    11.4%                                                             San Antonio, Texas                               18.4%
                 Branson, Missouri                  9.7%                                                                  Branson, Missouri                              18.2%
        Albuquerque, New Mexico                    9.3%                                                                   St. Louis, Missouri                           17.5%
     Wyoming (anywhere in state)                   9.2%                                                                     Houston, Texas                              17.3%
                 Detroit, Michigan                 9.1%                                                     Minneapolis-St. Paul, Minnesota                             17.2%
Rapid City, Mt. Rushmore, Badlands…                9.0%                                                                   Detroit, Michigan                            16.7%
        Oklahoma City, Oklahoma                    8.9%                                                               Kansas City, Missouri                            16.5%
      Montana (anywhere in state)                  8.7%                                                         Oklahoma City, Oklahoma                                16.0%
                                       0%       10%           20%           30%           40%                                                   0%        10%           20%           30%           40%
                                Question: I have traveled to (or within) in PAST THREE (3) YEARS                               Question: I am likely to travel to (or within) in the NEXT THREE (3) YEARS

                                                                                                                                                                                                  PAGE 75
RATIO OF PAST TO FUTURE VISITATION: CENTRAL
                    Montana (anywhere in state)                                                   2.51
                    Wyoming (anywhere in state)                                                2.30
         Rapid City, Mt. Rushmore, Badlands area                                          2.16
                      Albuquerque, New Mexico                                           2.00
                                Branson, Missouri                                  1.88
                                Detroit, Michigan                                  1.84
                      Oklahoma City, Oklahoma                                     1.80
                         New Orleans, Louisiana                                  1.71
                                    Austin, Texas                              1.61
                               Denver, Colorado                             1.56
                                  Houston, Texas                           1.49
                                St. Louis, Missouri                        1.48
                              San Antonio, Texas                          1.46
                  Minneapolis-St. Paul, Minnesota                         1.45
                            Kansas City, Missouri                         1.44
                                    Dallas, Texas                         1.40
                                 Chicago, Illinois                 1.01
                                                      0%   50%   100%   150%      200%     250%       300%

                                                                                                             PAGE 76
FAMILIARITY (TOP 2 BOX SCORES)

Question: How familiar are you                    New Orleans, Louisiana                                29.2%
                                                          Chicago, Illinois                           27.8%

with the attractions and things                        San Antonio, Texas
                                                        Denver, Colorado
                                                                                                     25.6%
                                                                                                     25.6%
                                                             Dallas, Texas                         24.1%
to see and do in each                                      Houston, Texas                         22.5%
                                                             Austin, Texas                        22.5%
destination?                                             Branson, Missouri                        21.9%
                                           Minneapolis-St. Paul, Minnesota                       21.7%
                                  Rapid City, Mt. Rushmore, Badlands area                       19.4%
                                                     Kansas City, Missouri                     19.0%
                                                         Detroit, Michigan                     18.5%
    FAMILIAR OR                                Albuquerque, New Mexico                        17.9%
    VERY FAMILIAR                            Montana (anywhere in state)                     17.0%
                                             Wyoming (anywhere in state)                     16.9%
                                               Oklahoma City, Oklahoma                      15.1%
                                         North Dakota (anywhere in state)                  13.5%
                                                         St. Louis, Missouri              12.4%
                                                                               0%   10%      20%    30%     40%   50%   60%

                                                                                                                              PAGE 77
APPEAL (TOP 2 BOX SCORES*)

Question: Given what you                         New Orleans, Louisiana                               36.9%
                                                       Denver, Colorado                           31.4%

currently know and feel about                         San Antonio, Texas
                                                         Chicago, Illinois
                                                                                                  31.2%
                                                                                                 30.6%
                                            Montana (anywhere in state)                         29.3%
these destinations, please use                          Branson, Missouri                       29.3%
                                                            Austin, Texas                       29.0%
the scale below to state how                Wyoming (anywhere in state)                        27.8%
                                                            Dallas, Texas                     25.8%
appealing each is to you as a                             Houston, Texas                      25.6%
                                              Albuquerque, New Mexico                        24.3%
place to visit on a vacation?    Rapid City, Mt. Rushmore, Badlands area                  20.8%
                                          Minneapolis-St. Paul, Minnesota                 20.5%
                                        North Dakota (anywhere in state)                  20.3%
                                                    Kansas City, Missouri                18.2%
APPEALING OR                                  Oklahoma City, Oklahoma                   16.7%
                                                        Detroit, Michigan              15.3%
VERY APPEALING                                          St. Louis, Missouri          12.3%
                                                                              0%   10% 20% 30% 40% 50% 60% 70%

                                                                                                                 PAGE 78
SPOTLIGHT SEGMENT

DMO PANEL
DISCUSSION
Panelists: Jillian Simpson, Vice President, Alaska Tourism Industry Association &
Lynn Bruni-Perkins, VP, Global Marketing Communications, San Francisco Travel
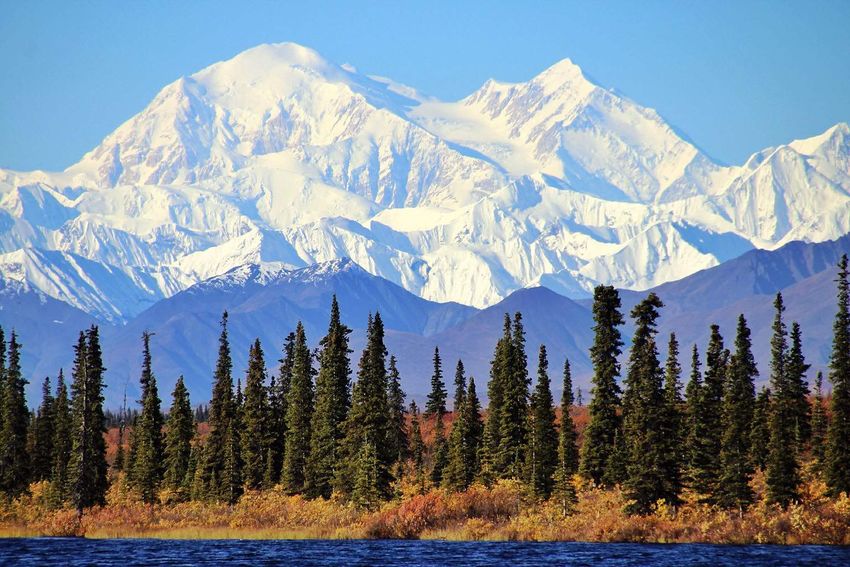
TRAVEL ALASKA – CURRENT CAMPAIGN
TRAVEL ALASKA – IN-STATE CAMPAIGN

                         Cale Green
COVID-19 COMMUNICATION CENTER   covid19.milespartnership.com
UPCOMING WEBINAR

THE CVB AND THE
FUTURE OF THE
MEETINGS INDUSTRY
Wednesday, February 10, 1pm ET
UPCOMING WEBINAR

THE VALUE OF DMOS
Best Practices in Official DMO
Websites & Visitor Guides During
the COVID-19 Crisis

Thursday, February 25, 3pm ET
Q&A

Thank you!
You can also read