2021 DD 101 - The Arc of Washington State
←
→
Page content transcription
If your browser does not render page correctly, please read the page content below
2021
                   DD 101

                      Zooming in on Developmental Disabilities

  A Guide for legislators and staff about the
Development Disabilities Administration’s (DDA)
  supports and services for people with DD.

 Prepared by The Arc of Washington State ~ 1.888.754.8798 ~ www.arcwa.org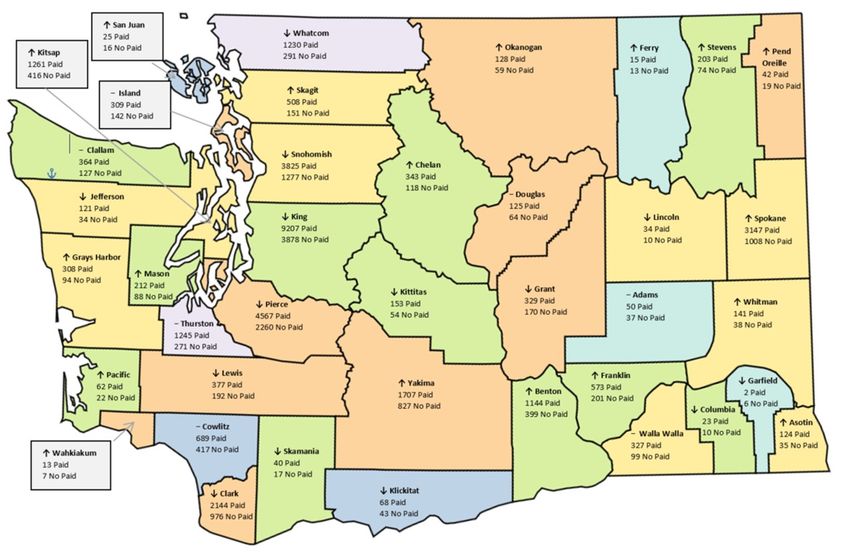
2020 Statistics
  Developmental Disabilities Administration:

Basic Infor mation About Ser vices and Suppor ts
  for People with Developmental Disabilities
   For the 2021 Legislative Session

     •   Grassroots Advocacy, Community Values

     •   DDA Biennial Base Funding

     •   DDA Clients and State Budget Allotment

     •   DDA 2019-21 Budget Request

     •   DD Services—How they are funded & where they are found

     •   DDA HCBS Funded Waiver Capacity

     •   DDA Children and Adults by Residence Type

     •   Supported Living: Providing Services During COVID-19

     •   COVID-19 By Cases and County

     •   DDA Clients on Paid & No Paid Caseloads (By County)

     •   DDA Employment/Day Services (By County)

     •   History and Use of Residential Habilitation Centers (RHC)

     •   DDA HCBS Waivers, Community First Choice & RHC Costs

     •   Hospital Length of Stay/Barrier to Discharge

     •   You Know Me! - Your Constituents Speak Up!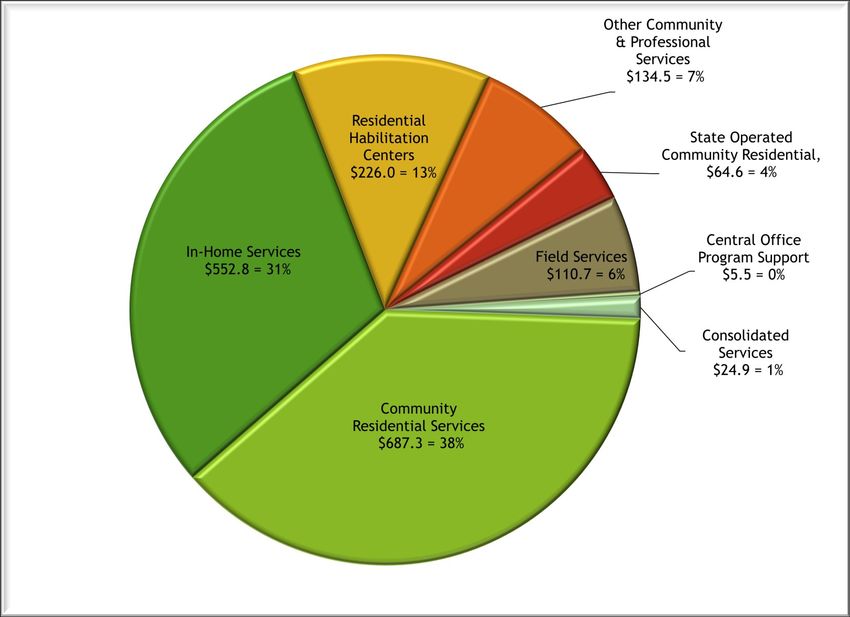
Developmental Disabilities:
Grassroots Advocacy
Community Values
Developmental Disabilities (DD) advocacy represents the statewide effort of individuals
with developmental disabilities, family members, service providers and concerned
disability organizations.
We are joining together to promote quality community-based services
for all people with developmental disabilities.
Times have changed from the days when children and adults with significant disabilities
were segregated, moved into institutions, denied education as well as opportunities to
work and participate in our communities.
Who has an Intellectual/Developmental Disability?
How Many People have an Intellectual/Developmental Disability?
Approximately 1.58% of the general population is estimated to have an Intellectual and/or
Developmental Disability (I/DD). In Washington State, this means that about 120,000
children and adults may have this diagnosis.
The current caseload of the Developmental Disabilities Administration (DDA)
is approximately 49,300.
Currently, more than 14,000 of those are still waiting for services because
of lack of funding.
The majority of people with developmental disabilities now live with their families or in
their own homes, with support to be as independent as possible. As a result of these
changing values, and with the support of state and federal government funding and
policies:
Children with DD participate in school,
Adults with DD become employed and pay taxes,
and our diverse communities benefit!
Unlike the old days of defining people by what is wrong with them, community advocacy is
based on the fundamental belief that having a disability is a normal part of life.
These are not the opinions of a few groups;
they are the values of a state and nation moving forward.
2021 DD 101 ~ The Arc of Washington State ~ 888.754.8798 ~ www.arcwa.org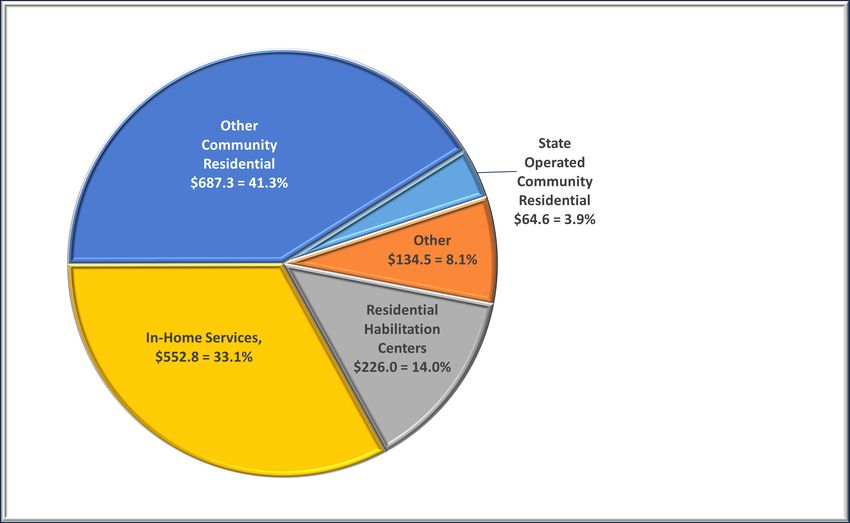
Developmental Disabilities Administration (DDA)
Biennial Base Funding
Budget Allotment for FY 2021—$3.75 Billion (100%)
$1.80 Billion General Funds State (48%) and $1.95 Billion Federal/Other (52%)
In-Home Services include:
• Community First Choice
• Individual & Family Services
• Employment/Day
Note: General Fund-State (GF-S) dollars
are in millions
Category GF-S 2020 2020
1
FTEs Clients
• General Funds State: $1.8 Billion
(48.1%)
Central Office—Program Support $5.5 22.7 —
• Federal/Other Funds: $1.9 Billion
Field Services $110.7 882.4 — (51.9%)
1
Residential Habilitation Centers Total unduplicated count of clients
(RHC) 3 $226.0 2,455.6 630 receiving a paid service from DDA
2
Community Residential $687.3 — 4,586 State Operated Living Alternatives
(SOLA) and Community Crisis
State Operated 2 $64.6 727.3 246 Stabilization Services (CCSS)
Community Residential
3
584 long-term stays, approx. 89
In-Home Services and Supports $552.8 — 21,668 planned or emergent respite
(short-term)
Other Community and Professional $134.5 — —
Services 4 4
Funds support clients in community
residential or in-home settings with
Consolidated Maintenance & Ops $24.9 193.1 — respite and therapies
Totals: $1,806.3 4,281.0 27,130
120,000 people estimated in Washington State with a developmental disability
49,282 clients enrolled with the Developmental Disabilities Administration (2019—48,422)
35,233 of those clients receive at least one paid service from DDA (2019—34,935)
14,049 of those clients receive No Paid Services from DDA (2019—13,487)
Source: Developmental Disabilities Administration (DDA) - October 2020
2021 DD 101 ~ The Arc of Washington State ~ 888.754.8798 ~ www.arcwa.org
Developmental Disabilities Administration (DDA)
Clients and State Budget Allotment
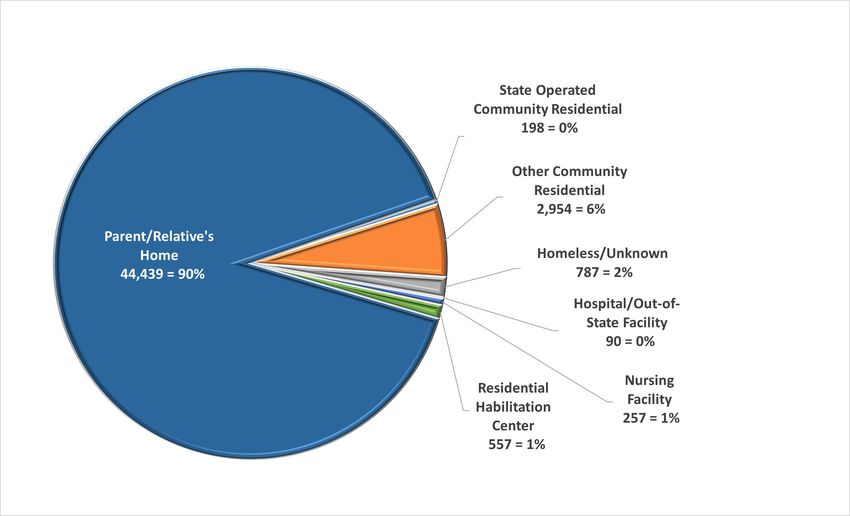
Number of DDA Clients and Percentage in Residence Type
Budget Allocation and Percentage in Residence Type
(State Dollars in Millions)
Source: Developmental Disabilities Administration (DDA) - October 2020
2021 DD 101 ~ The Arc of Washington State ~ 888.754.8798 ~ www.arcwa.org
Developmental Disabilities Services
                        How They Are Funded & Where They Are Found

Community Based DD Services:
  • Case management/Intake (provided by the state)
  • Early Intervention Services for children age birth-3 (state contracts through counties)
  • Home & Community Based Services (HCBS) Waivers (Services are based on habilitation and support to build and
    maintain abilities that lead to greater independence in the community):
      ~ Basic Plus Waiver
      ~ Core Waiver
      ~ Community Protection Waiver
      ~ Children’s Intensive In-home Behavior Supports (CIIBS) Waiver
      ~ Individual & Family Services
  • Employment/Day (waiver service contracted by the state through the counties)
  • Community First Choice program (In-home care services to assist with activities of daily living, such as bathing
    and dressing). MPC transitioned to the Community First Choice program, which provides the state with an
    additional 6% in matching federal funds.
  • Supported Living/Staffed Residential Services/State Operated Living Alternative (SOLA) - (the community-based
    alternative to institutional care, provided as a Core waiver service)

Residential Habilitation Centers (RHC):
  • Fircrest—Intermediate Care Facility (ICF) and Nursing Facility (NF)
  • Rainier—Intermediate Care Facility (ICF)
  • Yakima Valley—Nursing Facility (NF)
  • Lakeland Village—Intermediate Care Facility (ICF) and Nursing Facility (NF)

                                       FEDERAL MATCH
Nearly all DD service dollars are matched with federal Medicaid funding. Under Title XIX,
Medicaid is used to match state funding for HCBS waiver services.
Federal Medical Assistance Percentages (FMAP) are the percentage rates used to determine the
matching funds rate allocated annually to certain programs.
The FMAP for FY 2021 is 50.00% state and 50.00% federal with the exception of the Community First Choice program
which receives an additional 6% federal match.

                         Data from Developmental Disabilities Administration (DDA) 2020
                   2021 DD 101 ~ The Arc of Washington State ~ 888.754.8798 ~ www.arcwa.org
Developmental Disabilities Administration (DDA)
         Home & Community Based Services (HCBS) Funded Waiver Capacity

     In the 1980s, the Federal government allowed states to apply for Federal Medicaid funds to pay for
home and community based services, referred to as Home and Community Based Services Waiver Program.
What a person is “waiving” is the right to an Intermediate Care Facility (ICF/DD), receiving their services
in a community setting instead of the more expensive institutional setting.
                 Total Waiver Capacity:                         If you qualify for ICF care, placement in one of
                          2015: 13,338                          our state’s Residential Habilitation Centers is an
                          2016: 15,586                          entitlement, but there is no entitlement to
                          2017: 19,064                          services in the community, as those depend on
                          2018: 20,027                          funding from the Legislature. There are “request
                          2019: 20,391                          lists” for waivers.
        12,000

        10,000

         8,000

         6,000

         4,000

         2,000

             0
                      Basic +               Core                C.P.               CIIBS                IFS
        2015           7846                4582                 418                  95                 397
        2016          8,037                4,572                415                  99                2,463
        2017          8,376                4,553                411                  94                5,630
        2018          8,857                4,570                407                  71                6,122
        2019          9,092                4,591                407                  83                6,218
        2020          10,545               4,871                430                  89                6,649

                                                 Key Waiver Elements
                 Meets ICF/MR level of care guidelines, but is at high risk of out-of-home placement or loss of current
Basic Plus       living situation. Includes: Basic Waiver service coverage, skilled nursing, additional employment/day
                 funding.

                 Meets ICF/MR level of care guidelines. Requires residential habilitation services or lives at home, but
Core             is at immediate risk of out-of-home placement. Includes all Basic Plus waiver services, in addition to
                 supportive living services (up to 24 hour supervision and support).

Community        Meets ICF/MR level of care and requires 24 hour, on-site, staff supervision to ensure safety of others;
Protection       requires therapies and/or other habilitation services; meets the criteria for “community protection.”

                 The Children’s Intensive In-home Behavior Supports waiver meets ICF/MR level of care and provides
CIIBS            in-home positive behavior supports from qualified from PhD or MA level therapists with intense case
                 management and collaboration with family, school & other service providers.

                 The Individual and Family Services waiver meets ICF/DD level of care and provides respite, behavioral
IFS              health stabilization services, environmental adaptations, therapies, nurse delegation, sexual deviancy
                 evaluations, specialized medical equipment and supplies, and staff/family consultation and training.

                         Source: Developmental Disabilities Administration (DDA) - July 2020
                      2021 DD 101 ~ The Arc of Washington State ~ 888.754.8798 ~ www.arcwa.org
Developmental Disabilities Administration (DDA)
Children and Adults by Residence Type
People with Developmental Disabilities—Where Do They Live?
Summary
49,282 individuals are enrolled as clients of DDA.
35,439 clients (71.9%) live with and receive care and support from a parent or relative.
14,049 clients (28.5%) do not receive any paid services administered by DDA.
Region 1 Region 2 Region 3
Setting Adult Child Adult Child Adult Child
Total
Adult Family Home 369 0 797 0 584 0 1,750
Adult Residential Care (ARC) 63 0 14 0 29 0 106
Alternative Living 94 0 6 1 1 0 102
Assisted Living Facility (non-ARC) 26 0 13 0 16 0 55
Community ICF/IID 0 0 1 0 11 0 12
Companion Home 16 0 20 0 35 0 71
DCYF Foster Home, Licensed Staffed
Residential, or Group Care 34 181 25 351 32 359 982
DDA Group Home 15 0 153 0 82 0 250
DDA VPS Foster Home, Licensed Staffed
Residential, or Group Care 17 33 11 19 5 11 96
Enhanced Services Facility 2 0 0 0 1 0 3
Homeless 30 3 40 20 21 3 117
Jail/Correctional Facility (City or County) * 10 0 17 0 21 1 49
Medical Hospital 2 0 10 1 3 1 17
Nursing Facility 74 0 96 0 87 0 257
Other/Unknown 187 22 204 42 181 34 670
Out-of-state Facility 1 1 7 6 3 6 24
Own Home 1,177 38 1,592 69 1,488 51 4,415
Parents Home 3,191 4,379 4,958 10,018 4,167 6,922 33,636
Psychiatric Hospital 13 0 11 6 16 3 49
Relatives Home 436 165 444 166 427 165 1,803
Residential Habilitation Center (RHC) 217 0 192 0 148 0 557
State Operated Living Alternative—Adult 61 0 60 0 74 0 195
State Operated Living Alternative—Child 3 0 0 0 0 0 3
Supported Living 1,118 0 1,573 0 1,372 0 4,063
Adult living with parent, unknown Region 1
Total: 7,156 4,822 10,244 10,699 8,804 7,556 49,282
Percentage: 14.5% 9.8% 20.8% 21.7% 17.9% 15.3% 100%
* Denotes infants whose mothers are incarcerated.
Source: Developmental Disabilities Administration (DDA) - October 2020
2021 DD 101 ~ The Arc of Washington State ~ 888.754.8798 ~ www.arcwa.orgSupported Living:
Providing Services During COVID-19
Serving people with intellectual and developmental disabilities in their home community is a long-standing top
priority for Washington state. Supported Living providers, also known as Community Residential Services, are the
primary provider of these services in our state. Over 21 million service hours are delivered each year for
approximately 4,600 clients.
The health and safety of our clients and
staff is our top priority
Supported Living providers have continued to serve our clients during the COVID-19 pandemic. Supporting our
clients, who have challenging behaviors with the added stress of the pandemic, is extremely difficult now. Our staff
must try to keep our clients from being scared, angry, upset, or reactive in the face of potential infection. Social
distancing and isolation (when required) is challenging for anyone, but particularly with clients wanting to engage
with friends, family members, and housemates but not understanding why they can’t.
Supported Living is facing unprecedented costs as a result of COVID-19
2020 COVID-19 Related Expenditures Average cost per agency* Per client average*
PPE and Disinfection & Cleaning Supplies $29,308 $494
Other equipment & modifications $29,686 $500
Hazard pay for staff $529,531 $8,920
Other personnel and COVID-19 expenses $109,310 $1,841
Total COVID-19 Expenses $697,835 $11,755
* Based on survey of all Supported Living providers with response data representing 40% of clients served
COVID-19 cases are greatly impacting Supported Living providers, but these protective
measures are keeping positivity rates lower than other long-term care settings
Client COVID-19 Client COVID-19 Staff COVID-19
positive cases positivity % Positive cases
Residential Habilitation Centers (RHCs) 72 13.0% 1297
Community Residential settings 2181 6.2% 583
Any cuts to Supported Living funding would be
devastating to the clients that we serve.
CRSA: Legislative Chairs— Scott Livengood (206) 284-9130, livengood@alphasls.org and Randy Hauck (509) 966-1998, rhauck@community-living.org, and Lobbyist—
Melissa Johnson (360) 280-6429, melissa@bogardjohnson.com
Visit us online at www.CRSA-WA.org and on Facebook
2021 DD 101 ~ The Arc of Washington State ~ 888.754.8798 ~ www.arcwa.orgDevelopmental Disabilities Administration (DDA)
COVID-19 by Cases and County
Reported Confirmed Client and Staff COVID-19 by Cases and County
COVID-19 COVID-19 COVID-19 COVID-19
Provider Type County Positive Clients Positive Client Staff Deaths
Staff Deaths
Companion Home Kitsap - 1 - -
Companion Home Stevens 1 1 - -
Group Homes/Group King 15 20 -
Training Homes
1
Group Homes/Group Snohomish 1 1 - -
Training Homes
Licensed Staffed Benton 1 5 - -
Residential
Licensed Staffed
Residential King 1 11 - -
Licensed Staffed Snohomish - 1 - -
Residential
Licensed Staffed Spokane 1 5 - -
Residential
Supported Living Asotin 6 8 - -
Supported Living Benton 5 24 - -
Supported Living Chelan 3 6 1 1
Supported Living Clark 2 6 - -
Supported Living Cowlitz - 3 - -
Supported Living Douglas 3 9 - -
Supported Living Franklin - 5 - -
Supported Living Grays Harbor - 3 - -
Supported Living King 118 232 13 2
Supported Living Kitsap 5 4 - -
Supported Living Kittitas - 5 - -
Supported Living Pierce 22 52 3 -
Supported Living Skagit 1 2 - -
Supported Living Snohomish 8 21 1 -
Supported Living Spokane 38 84 - -
Supported Living Thurston 6 15 1 -
Supported Living Walla Walla 4 11 - -
Supported Living Whitman - 1 - -
Supported Living Yakima 17 47 1 1
GRAND TOTAL 258 583 21 4
Source: Developmental Disabilities Administration (DDA) - November 2020
2021 DD 101 ~ The Arc of Washington State ~ 888.754.8798 ~ www.arcwa.orgDevelopmental Disabilities Administration (DDA)
Clients on Paid & No Paid Caseloads (By County)
Change From Last Year
Percentage of clients on paid services caseload increased
to new category from last year
Percentage of clients on paid services caseload decreased
to new category from last year
— Percentage of clients on paid services caseload remained
in same category from last year
COUNTY PAID NO PAID COUNTY PAID NO PAID COUNTY PAID NO PAID
Adams — 50 37 Grays Harbor 308 94 Pierce 4,567 2,260
Asotin 124 35 Island — 309 142 San Juan 25 16
Benton 1,144 399 Jefferson 121 34 Skagit 508 151
Chelan 343 118 King 9,207 3,878 Skamania 40 17
Clallam — 364 127 Kitsap 1,261 416 Snohomish 3,825 1,277
Clark 2,144 976 Kittitas 153 54 Spokane 3,147 1,008
Columbia 23 10 Klickitat 68 43 Stevens 203 74
Cowlitz — 689 417 Lewis 377 192 Thurston — 1,245 271
Douglas— 125 64 Lincoln 34 10 Wahkiakum 13 7
Ferry 15 13 Mason 212 88 Walla Walla — 327 99
Franklin 573 201 Okanogan 128 59 Whatcom 1,230 291
Garfield 2 6 Pacific 62 22 Whitman 141 38
Grant 329 170 42 19 Yakima 1,707 827
Pend Oreille
Source: Developmental Disabilities Administration (DDA) - July 2020
2021 DD 101 ~ The Arc of Washington State ~ 888.754.8798 ~ www.arcwa.orgDevelopmental Disabilities Administration (DDA)
Employment/Day Services by County
Group Supported Individual Community Notes:
County Total
Employment Employment Inclusion • • Centers Medicare & Medicaid Services
Adams 1 6 2 9 (CMS) rules require services to be provided
Asotin 16 11 6 33 in an integrated and supportive setting. In
Benton 44 86 48 178 order to fully comply with federal rules
Chelan 11 63 47 118 requiring integrated settings, DDA stopped
Clallam 0 95 36 131 enrolling clients into PVE services in 2015.
Clark 0 440 82 522 • • Community Inclusion amounts include
Columbia 0 3 5 8 clients on Pre-Admission Screening and
Cowlitz 0 105 51 156 Resident Review (PASRR) program.
Douglas 3 16 14 33 Of those who are assessed as high acuity:
Ferry 0 3 3 6 55% are earning at least minimum
Franklin 16 22 9 47 wage or are self employed
Garfield 0 1 0 1 40% are job seeking or do not have
Grant 12 39 27 78 wages, and
Grays Harbor 0 83 8 91 5% are earning less than minimum
wage.
Island 0 77 9 86
Jefferson 4 22 9 35
King 19 2,206 299 2,524
Kitsap 0 292 35 327 Client Numbers by Acuity
Kittitas 2 36 32 70
Klickitat 0 1 0 1
Lewis 0 55 37 92
Lincoln 0 8 4 12 Acuity Min. Wage Job Sub-
or Self Seeking/ Minimum Totals
Mason 0 66 9 75 Level Employed No Wage Wage
Okanogan 0 18 8 26
Pacific 0 21 0 21
Pend Oreille 0 6 1 7
Pierce 63 723 129 915 1,375 990 123
High 2,488
or or or
San Juan 0 7 0 7 Acuity 100%
55.27% 39.79% 4.94%
Skagit 7 164 41 212
Skamania 0 13 0 13
Snohomish 0 844 131 975 3,444 820 192
Spokane 46 518 258 822 Medium 4,456
or or or
Acuity 100%
Stevens 0 50 15 65 77.29% 18.40% 4.31%
Thurston 0 420 55 475
Wahkiakum 0 3 0 3
Walla Walla 9 49 44 102 693 67 6
Low 766
Whatcom 42 315 31 388 or or or
Acuity 100%
90.47% 8.75% 0.78%
Whitman 19 23 2 44
Yakima 47 88 118 253
Grand Totals: 358 6,998 1,605 8,961
Average Number Average Number Average
Average
of Support Hours Number
of Hours Average
Worked Number
Client Average
Service of Support
per Client per Hours of Hours
per Client per Worked
Wages per Client
Service per Client per per Client per Wages per
Week Week Week
I/E = Individual
Week Week Week
Employment
I/E = Individual
2.5 10.0 $138.00
Employment 2.5 10.0 $138.00
GSE = Group Supported
Employment 2.2
GSE = Group Supported
8.5 $75.50
Employment 2.2 8.5 $75.50
CI = Community
Inclusion
CI = Community
2.75 N/A N/A
Inclusion 2.75 N/A N/A
Source: Developmental Disabilities Administration (DDA) - July 2020
2021 DD 101 ~ The Arc of Washington State ~ 888.754.8798 ~ www.arcwa.orgDevelopmental Disabilities Administration (DDA)
History and Use of Residential Habilitation Centers (RHC)
History of Declining Number of Residents living in RHCs
4,500
4,000
4,145
3,500
3,688
3,000
2,500
2,731
2,647
2,000 2,354
2,137
1,500
1,899
1,849
1,840
1,696
1,498
1,000
1,346
1,281
1,222
1,126
1,065
1,018
989
988
500
931
896
808
753
697
663
623
584
0
66 71 73 75 77 79 82 84 86 90 92 94 96 98 00 02 04 06 08 10 12 14 16 17 18 19 20
19 19 19 19 19 19 19 19 19 19 19 19 19 19 20 20 20 20 20 20 20 20 20 20 20 20 20
What is the historical use for the RHCs?
• Lakeland Village in Medical Lake has been in existence the longest, opening in 1915 and by 1938
had a population of 1,650 residents.
• Rainier then opened its doors in October of 1939 and by year’s end had 172 residents. At its
peak, in the late 1950’s, Rainier had about 1,900 residents.
• Fircrest was created in 1950 and moved in 220 people. By the early 1960’s, Fircrest had about
1,000 residents.
• Yakima Valley School was established in 1958 to serve the needs of children and was later
converted into a nursing facility, it has .
• In 1967 Interlake was established at Medical Lake to specifically address the needs of the
medically fragile population. It was subsequently closed in 1994 and all residents moved to other
RHCs or the community.
• In 1972, Francis Haddon Morgan Children’s Center was opened with a capacity of 48 children and
specializing in autism. It closed in December 2011 and the fifty-two individuals who lived at the
center have moved to community-based residences or other DDA institutions.
• Interlake closed in 1998, all people who were moved from Interlake were able to go to the place
they desired, whether it was the community or another RHC.
From 1970 on, the institutional population steadily declined from over 4,000 people to 697. Several factors
contributed to this decline. The most important change is the realization that with intervention, people
with developmental disabilities grow and develop and are capable of achieving major developmental mile-
stones. Community resources have been developed, schools are required to include children with disabilities
and medical information and practices have improved dramatically. All these factors help parents keep
family members home and help them gain access to alternative services near their family homes.
Centers for Medicare and Medicaid (CMS) - 2018 EMPHASIS on Community
In Washington, there are four RHCs, offering skilled nursing facility services, Intermediate Care Facilities
(ICF), or both. Rainier in Buckley, Fircrest in Shoreline and Lakeland Village in Medical Lake are the three
RHCs that provide ICF.
Over the years, the RHC program, residents, and stakeholders, such as residents’ family members and
guardians have generally considered that the ICF/IID is the client’s home – a facility focused on keeping
them healthy and safe.
However, in recent years, CMS has re-emphasized the “intermediate” aspect of institutional care. That
is, it is the responsibility of the RHC not to house and protect people, but rather to be actively
preparing them for leaving the RHC and integrating into the community. This emphasis by federal
regulators is changing the culture and practices in the three ICFs. The staff has been trained and are now
being held accountable for engaging the residents in aggressive and continuous active treatment.
2021 DD 101 ~ The Arc of Washington State ~ 888.754.8798 ~ www.arcwa.orgDevelopmental Disabilities Administration (DDA)
HCBS Waivers, Community First Choice & RHCs Costs
RHC Clients/Budget Comparison
2020 Average Daily Cost Per Client and Client Count by Residential Setting
Foster Home/Group Care*** $250
$731 Foster Home/Group Care*** $16
Licensed Staffed Residential***
Licensed Staffed Residential*** $78
Assisted Liv ing $81
Assisted Liv ing 100
Adult Family Home $130
Adult Family Home 1,543
Companion Home $250
Companion Home 71
DDA Group Home $457
DDA Group Home 239
Supported Liv ing $516
Supported Liv ing 3,913
SOLA 3 South** $852
SOLA 3 South** 20
SOLA 3 North** $891
SOLA 3 North** 50
SOLA 2 South** $754
SOLA 2 South** 55
SOLA 2 North** $1,008
SOLA 2 North** 4
SOLA 1 South** $712
SOLA 1 South** 29
SOLA 1 North 2** $1,081 SOLA 1 North 2** 5
SOLA 1 North** $694 SOLA 1 North** 23
Yakima* $855 Yakima* 68
Lakeland* $1,027 Lakeland* 182
Rainier* $1,009 Rainier* 182
Fircrest* $884 Fircrest* 215
0 500 1,000 1,500 2,000 2,500 3,000 3,500 4,000 4,500
$0 $200 $400 $600 $800 $1,000 $1,200
Residential Habilitation Centers (RHC) State Operated Living Alternatives (SOLA)
Residential Habilitation Centers (RHC) State Operated Living Alternatives (SOLA)
Adult Community Residential Children's Community Residential Adult Community Residential Children's Community Residential
* Average daily cost for adult settings is based on clients
whose range of support needs is similar based on their last CARE assessment. Federal matching rate is approxi-
mately 50% for 2019 for all settings. Only costs expended by Developmental Disabilities Administration (DDA) are
calculated here and do not include capital costs associated with maintenance and upkeep of facilities.
** State Operated Living Alternatives (SOLA) are in the midst of major expansion as clients are being rapidly moved
from Residential Habilitation Centers (RHC) and State Hospital settings to this program. New regions were
formed to capture the rapid expansion. FY19 produced two new SOLA sub-regions, 2 North and 3 South. The
1 North SOLA is the current children’s SOLA.
*** These residential options are for children and deliver Voluntary Placement Services (VPS). The provider type can
by Licensed Staffed Residential, Child Foster Home or Group Care Facility.
Note: For those who live at Home, cost varies widely based on which waiver services the individual receives.Developmental Disabilities Administration (DDA)
Hospital Length of Stay/Discharge Barriers
Length of Stay (LOS)/Discharge Barriers Increasingly, people with developmental disabilities are
LOS Discharge Barrier being taken to hospitals with non-medical needs
(behavior challenges, etc.), then left with no one
August 2019 taking them back home. The reasons vary and are
193 days Not behaviorally stable described in this chart.
17 days Active referrals submitted, no provider identified Length of Stay (LOS)/Discharge Barriers
18 days Active referrals submitted, no provider identified LOS Discharge Barrier
44 days Active referrals submitted, no provider identified January 2020
86 days Active referrals submitted, no provider identified— 346 days Not behaviorally stable
family unable to support
71 days Not behaviorally stable—provider needs time to
93 days Active referrals submitted, no provider identified find housing and staff
September 2019 22 days Active referrals submitted, no provider identified
223 days Not behaviorally stable
22 days Not behaviorally stable
47 days Active referrals submitted, no provider identified
17 days Active referrals submitted, no provider identified
48 days Active referrals submitted, no provider identified
16 days Not behaviorally stable
74 days Active referrals submitted, no provider identified
16 days Active referrals submitted, no provider identified,
116 days Active referrals submitted, no provider identified— family unable to support, not behaviorally stable
family unable to support
7 days Not behaviorally stable 32 days Provider needs time to find housing and staff
13 days Active referrals submitted, no provider identified 22 days Active referrals submitted, no provider identified
October 2019 February 2020
254 days Not behaviorally stable 375 days Not behaviorally stable
78 days Active referrals submitted, no provider identified Not behaviorally stable—provider needs time to
100 days find housing and staff
79 days Active referrals submitted, no provider identified
105 days Active referrals submitted, no provider identified 61 days Provider needs time to find housing and staff
38 days Not behaviorally stable 51 days Not behaviorally stable
2 days Not behaviorally stable—provider needs time to find 51 days Active referrals submitted, no provider identified
housing and staff
46 days Active referrals submitted, no provider identified
3 days Not behaviorally stable
45 days Active referrals submitted, no provider identified,
November 2019 family unable to support, not behaviorally stable
284 days Not behaviorally stable 45 days Not behaviorally stable
108 days Active referrals submitted, no provider identified
23 days Provider needs time to find housing and staff
109 days Active referrals submitted, no provider identified
18 days Active referrals submitted, no provider identified
135 days Active referrals submitted, no provider identified
5 days Provider needs time to find housing and staff
68 days Not behaviorally stable
Not behaviorally stable—Provider needs time to find March 2020
32 days housing and staff 82 days Active referrals submitted, no provider identified
10 days Active referrals submitted, no provider identified
10 days Active referrals submitted, no provider identified
9 days Not behaviorally stable—Provider needs time to find
housing and staff 5 days Provider needs time to find housing and staff
December 2019 1 day Cleared for Dx/still hospitalized
315 days Not behaviorally stable April 2020
63 days Not behaviorally stable—Provider needs time to find 112 days Active referrals submitted, no provider identified
housing and staff
41 days Active referrals submitted, no provider identified May 2020
Not behaviorally stable—Provider needs time to find 142 days Active referrals submitted, no provider identified
40 days housing and staff
2 days Not behaviorally stable, services offered—Client/
1 day Provider needs time to find housing and staff Legal Rep. refusal
Read the entire report: https://arcwa.org/content/uploads/sites/35/2020/11/SHB1394-Hospital-Tracking-Report.pdf
2021 DD 101 ~ The Arc of Washington State ~ 888.754.8798 ~ www.arcwa.orgYou can also read