Emerging Pests, Lower Mainland Horticulture 2018-2023: Winter and Spring Surveillance for Spotted Wing Drosophila (SWD) BC Berry Crops - Progress ...
←
→
Page content transcription
If your browser does not render page correctly, please read the page content below
Emerging Pests, Lower Mainland Horticulture 2018-2023: Winter and
  Spring Surveillance for Spotted Wing Drosophila (SWD) BC Berry
                       Crops – Progress Report

                              Final report to:
                          BC Ministry of Agriculture

                                 Prepared by:
                  Allyson Mittelstaedt, E.S. Cropconsult Ltd.

                              February 11, 2021

  Funds and Resources: Canadian Agricultural Partnership, Raspberry Industry
 Development Council, Lower Mainland Horticultural Improvement Association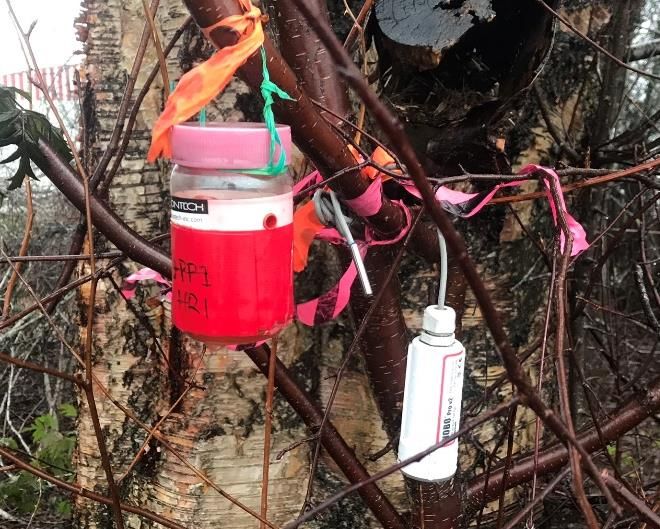
Executive Summary
Trapping was conducted for spotted wing drosophila (SWD), a major pest of small fruit crops throughout
the Fraser Valley and the rest of British Columbia (BC). Four SWD traps baited with an apple cider
vinegar bait with added antifreeze solution were placed in hedgerows around each of four blueberry
fields, three raspberry fields and one strawberry field (total of 32 traps) in the Fraser Valley, BC. Traps
were checked bi-weekly from January 7 to April 17, 2020 and weekly from April 17 to June 3, 2020.
Hourly temperatures were recorded by a temperature logger placed in each hedgerow, with data
missing from the Langley 1 site due to an equipment malfunction. Lethal temperatures for SWD that
were discovered in two lab studies were reached during the winter trapping period: -1.6°C which was
lethal for 75% of female SWD (Kimura 2004) and -10.2°C which was the LT80-1h for winter morph SWD
from a more recent study (Toxopeus et al. 2016). The first collection showed high SWD numbers at a
couple of trapping sites, but after an extended period of cold weather below lethal temperatures, the
trap catches greatly decreased. SWD numbers remained low until mid-May when food became more
available and temperatures increased. Lethal temperatures for the majority of SWD were reached at
multiple trapping sites; the longest period was reached at the two Abbotsford locations, with over 100
hours below -1.6°C and over 30 hours below -10.2°C. When Abbotsford airport temperatures were
entered into the SWD degree day model, egg laying by overwintering females was predicted to begin on
May 14, which was 1 day earlier than in 2019. The predicted date for subsequent life stages continued
to be similar to those of 2019 (OSU Online Phenology and Degree Day Models). The milder winter
temperatures after the cold spell in mid January and the continued presence of SWD in most hedgerow
traps in spring suggested that there would be moderate SWD pest pressure for the spring of the 2020
growing season.

Introduction
Spotted wing drosophila (SWD), Drosophila suzukii, continues to be one of the most serious pest issues
for the blueberry and raspberry industries in British Columbia (BC), as well as for other small soft fruits
such as strawberries, cherries, and grapes. Hedgerow trapping in the Fraser Valley for this pest during
winter and spring has been conducted since 2011.

Winter, spring and summer SWD trapping combined with winter and spring temperature tracking are
valuable activities to help predict SWD levels in berry crops, and to apply this information to improve
management practices. The lethal effect of cold has been demonstrated in lab-based studies; Kimura
(2004) found that 75% of female SWD were killed by 24 hour exposure to -1.6°C. Another more recent,
but similar, study showed that at low temperatures of 0°C, -2.5°C, and -5°C the survival rate greatly
decreased over time, with less than 20% survival after 12 hours at -2.5°C (Enriquez and Colinet 2017).
Multiple studies done on the cold tolerance of SWD since Kimura’s work have shown that there are two
morphotypes of SWD that have different tolerances to cold temperatures. The winter morph traits
occurred when reared from larval stage to adulthood in cooler temperatures (10-15oC) (Toxopeus et al.
2016; Stockton et al. 2018). In these studies, both morphs were used in testing of cold tolerance. For the
summer morphs, the temperature at which 80% of the test population was killed by an hour of exposure
(LT80-1h) was -7.5°C, whereas this was -10.2°C for the winter morphs (Toxopeus et al. 2016). Stockton et
al. (2018) found that survival of both summer and winter morph SWD was high at temperatures above -
5°C, but decreased for both (albeit slightly for winter morphs) when exposed for 72 hours to below -5°C.

2
At 72 hours of -7.5°C, there was only about a 50% survival rate of winter morph; no summer morphs
survived 24 hours at -7.5°C (Stockton et al. 2018).
Most studies to determine the cold hardiness of SWD were conducted in a lab setting, whereas in a
study done by Jakobs et al. (2015), a portion of the study was done with SWD exposed to winter
temperatures outdoors in Ontario, Canada. It was found that SWD adults could survive colder
temperatures by sheltering in areas that provide some protection from cold exposure, such as under
snow or by heated buildings (Jakobs et al. 2015). The number of female SWD that survive the winter
affects the SWD pressure in the spring of the following growing season. For our study, nine out of the
past 10 winters saw Abbotsford airport temperatures (Environment Canada) meet the lethal
temperature criteria for SWD, and it was observed that colder winters resulted in lower SWD trap
catches in the spring (Mittelstaedt 2019).
In the Fraser Valley, SWD adults may seek refuge in coniferous tree canopies, compost piles, leaf litter or
tree bark crevices, but sustained temperatures below 0°C will likely be lethal to overwintering adults. In
the hedgerow trapping conducted in the winter of 2016-2017, after a maximum of 69 hours below the
lethal temperature -1.6°C and lowest minimum of -14.4°C at one site throughout the winter period,
SWD numbers were very low throughout the spring and summer (Mittelstaedt and Scholefield 2017).
Additional years of winter trapping will continue to give insight into SWD survival in relation to winter
temperatures and aid in the prediction of SWD risk for future seasons.
The objectives of the winter surveillance trapping for SWD in 2020 were to:
1. Develop better forecasting tools for SWD in British Columbia by possibly using degree day
modeling or other predictive methods. The information collected will be shared with the berry
industry growers via regular newsletters and berry events throughout the year, and especially in
the spring and early summer.
2. Set and maintain SWD traps, and record SWD trap catches in hedgerows from January 7 until
June 3, 2020
Materials and Methods
Contech fruit fly traps (Contech, product # 300000719) were baited and placed in hedgerows adjacent to
four mature blueberry fields, three mature raspberry fields and one strawberry field in the Fraser Valley.
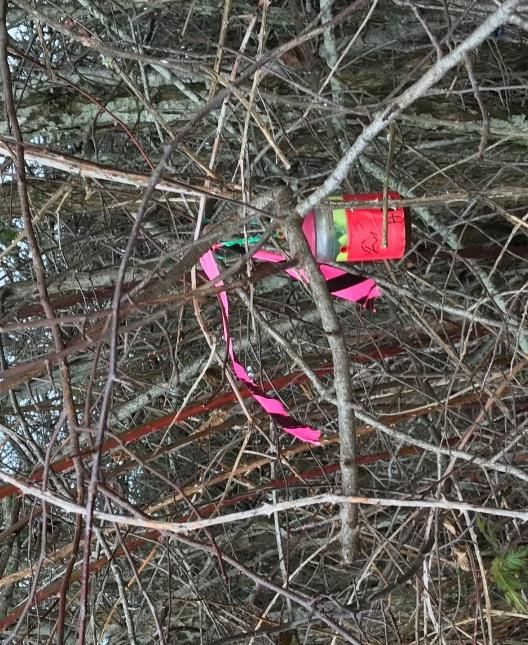
At each site, four SWD traps were placed 20 m apart along a hedgerow adjacent to the berry field (Fig.
1a&b). Sites were in Delta, Surrey, Langley, and Abbotsford (Table 1), and traps were placed on January
7 and 8, 2020. Traps were attached to branches or wooden stakes using twist ties and hung
approximately 1.5 m from the ground. Traps were baited with approximately 40 ml of apple cider
vinegar, with an addition of approximately 10 ml of antifreeze during the winter months to prevent
freezing. The bait and catch solutions were collected and replaced at two-week intervals until April 17,
2020, and then at weekly intervals until June 3, 2020 when they were removed. Target flies caught in
the traps were sorted and counted by sex, and a subset of flies from each trapping site were stored in
ethanol and sent to Tracy Hueppelsheuser at the BC Ministry of Agriculture (BCAGRI) for confirmation of
identification.
a. b.
3Figure 1a&b. Winter and Spring hedgerow SWD trapping location with Contech trap (a) and HOBO Pro
v2 temperature logger (b).
For the duration of the trapping period, hourly temperature data were recorded with temperature
loggers (HOBO Pro v2 model #U23-00x) that were hung next to the first trap at each trapping site (Fig.
1b). Historical temperature data were accessed from the Environment Canada website to compare daily
maximum and minimum temperatures at the Abbotsford airport over the past 10 winters. Data from the
temperature logger placed at the Langley 1 site were not accessible due to equipment malfunction and
the Langley 3 temperature logger only recorded up to January 22, 2020, due to an error in setting the
recording period.
Table 1. Trapping site locations and hedgerow characteristics for winter hedgerow spotted wing
drosophila trapping between January 7 and June 3, 2020.
Location Crop type Hedgerow type Hedgerow vegetation Notes
Delta Blueberry Dense natural forest, mixed Holly, blackberry, Trapping since
deciduous and coniferous trees salmonberry, elderberry, 2018/19
salal, birch trees
Surrey Blueberry Blackberry and tall grasses Blackberry, tall grasses Trapping since
2018/19
Langley 1 Raspberry Dense natural forest, mixed Salmonberry, blackberry, Trapping site since
deciduous and coniferous trees apple, hazelnut, maple, winter 2011/12
nettle
Langley 2 Raspberry Natural forest, mainly Hemlock, blackberry, Trapping since
coniferous trees pine 2018/19
Langley 3 Blueberry Dense natural forest, mixed Blackberry, birch trees, Trapping since
deciduous and coniferous trees nettle 2018/19
Langley 4 Blueberry Natural forest, mainly Blackberry, maple, pieris Trapping since
deciduous trees 2018/19
Abbotsford 1 Raspberry Natural forest, mainly Weigela, blackberry, Trapping site since
deciduous trees pieris, snowberry, deadly 2013/14
nightshade
Abbotsford 2 Raspberry Dense natural forest, mixed Trillium, holly, salal, Trapping since
deciduous and coniferous trees salmonberry, maple 2018/19
4Results and Discussion
High numbers of SWD were caught in traps at the Delta, and Langley 1 and 2 sites during the first week
of trapping (Fig. 2; Table A1). The following week, the numbers had decreased in all but the Delta
trapping site. The highest number of SWD were caught in the Delta traps, with a total of 277 SWD over
four traps; the Langley 1 trapping site had the next highest total, with 227 SWD over four traps. These
two trapping sites have had the highest SWD catches in previous winters as well, likely due to dense
vegetation with favourable areas for SWD to overwinter (Mittelstaedt 2019). The trap catches decreased
noticeably in the second and third collections and continued to be low for the remainder of the bi-
weekly trapping period (Fig. 2). An increase in trap counts was not then observed until early to mid-May
(Fig. 3). At most of the trapping locations, trap counts began to increase at this point, with the largest
increase seen in the Delta trapping site (Fig. 3). This location continued to have the highest counts for
the rest of the trapping period.
300
Abbotsford1
250 Abbotsford2
Delta
Total # SWD in 4 traps
200 Langley1
Langley2
150
Langley3
Langley4
100
Surrey
50
0
Date of trapping period
Figure 2. The total number of SWD caught in four traps placed in hedgerows at eight trapping sites
across the Fraser Valley and collected at bi-weekly periods from January 7 to April 17, 2020.
560
Abbotsford1
50 Abbotsford2
Delta
Total # SWD in 4 traps
40 Langley1
Langley2
30
Langley3
Langley4
20
Surrey
10
0
Date of trapping period
Figure 3. The total number of SWD caught in four traps placed in hedgerows at eight trapping sites
across the Fraser Valley and collected weekly from April 17 to June 3, 2020.
In previous years, January has seen milder temperatures throughout the month, with a decrease in mid-
February (Mittelstaedt 2019). Data from the six temperature loggers placed at trapping sites from the
beginning of January 2020 show that there was a cold snap in the third week of January (Fig. 4). This
corresponds with the subsequent decrease in SWD numbers in traps at all locations for four weeks after
this period of below freezing temperatures. After the initial drop, the average temperatures ranged
between 10°C and below 0°C, although temperatures did not reach the low points seen in the first cold
snap. Antifreeze was added to the apple cider vinegar to prevent freezing, but even with this addition,
some traps were found to be frozen during the cold periods. When the traps are frozen, they are not
able to effectively capture SWD, so this could have impacted the efficacy of the traps.
As the SWD counts did not reach the high numbers that were first seen in early January after the
extreme cold period, the data indicate that this was enough time at below lethal temperatures to knock
back a high proportion of active SWD until May, when food was more readily available and
temperatures began to increase once again (Figs. 2-4).
635 Maximum temperature
Average of Max of Temp_C
30
Minimum
Average temperature
of Min of Temp_C
25
Mean daily temperature (°C)
20
15
10
5
0
-5
-10
-15
07-Jan
11-Jan
15-Jan
19-Jan
23-Jan
27-Jan
31-Jan
04-Feb
08-Feb
12-Feb
16-Feb
20-Feb
24-Feb
28-Feb
03-Mar
07-Mar
11-Mar
15-Mar
19-Mar
23-Mar
27-Mar
31-Mar
04-Apr
08-Apr
12-Apr
16-Apr
20-Apr
24-Apr
28-Apr
06-May
02-May
10-May
14-May
18-May
22-May
26-May
Date
Figure 4. Mean maximum and minimum daily temperatures from six temperature loggers placed in
hedgerows at the Delta, Surrey, Langley, and Abbotsford sites.
Temperature loggers recorded a maximum of 10 to 137 consecutive hours below the lethal temperature
(-1.6°C) for 75% of female SWD (Kimura 2004) depending on the field site (Table 2). The Abbotsford 1
and Abbotsford 2 locations had the longest period of time at these temperatures, with 131 and 137
hours respectively (Table 2). All trapping sites but one had temperatures recorded below -1.6°C for over
24 hours, however the Langley 4 logger was not placed in the field until after the coldest period of
January 12-18 (Table 2). Within this duration of time, there were extended periods where the
temperature remained below -10.2°C (Table 2), which in one study was the LT80-1h for winter morphs
(Toxopeus et al. 2016). The Abbotsford 1 site was below -10.2°C for the longest duration, however all
sites except Delta and Langley 4 had at least one consecutive hour below this temperature (Table 2).
This suggests that there was sufficient time for SWD in these hedgerows to be exposed to lethal
temperatures. Stockton et al. (2018) found that 50% of SWD winter morph mortality was observed after
72 hours at -7.5°C. In this study, the SWD were exposed to gradually decreasing temperatures so they
had more time to acclimate to the cold (Stockton et al. 2018), whereas in the Toxopeus et al. (2016)
study, they were abruptly transferred from 11°C to various colder temperatures for about an hour, thus
determining the -10.2°C LT80-1h. The more recent studies into the difference in cold hardiness between
summer and winter morph SWD suggest that the previously discovered lethal temperature of -1.6°C
(Kimura 2004) may be too mild of a temperature to be considered as lethal as it was thought before.
These studies were conducted in a lab setting, so results would be expected to differ compared to the
field, in regards not only to temperature, but other weather factors as well. In a field study of
overwintering survival of SWD, Jakobs et al. (2015) recorded winter temperatures experienced by SWD
under leaf litter, in areas directly exposed, and in an unheated building in Ontario. Prior to an extreme
cold snap on December 12, 2013 when the study was conducted, most of the three-week trapping
period for all three microhabitats had temperatures hovering around 0°C. There was, however, a
difference in the maximum and minimum temperatures reached for each habitat. The temperatures
7fluctuated between approximately 8°C and -4°C in the protected leaf litter and unheated building, but
were much more drastic in the directly exposed area, ranging from above 10°C to -10°C over the three
weeks. The temperatures fluctuated much more readily where directly exposed, but still reached
minimum temperatures ranging from -5.6°C to -14°C in all habitats for an extended period of time
during the extreme cold spell on December 12, 2013, resulting in 100% mortality in all SWD placed in
the field study, regardless of habitat (Jakobs et al. 2015).
In the Fraser Valley region of BC, there are many areas where SWD can take refuge during the winter
months. Many berry farms are near urban areas, as well as abundant forests, which can provide
overwintering SWD adults with shelter. The Jakobs et al. (2015) data demonstrate that even in
protected areas, there is the potential that SWD can be killed by extended periods of sub-zero
temperatures.
Table 2. Minimum temperatures and consecutive number of hours below -1.6°C and -10.2°C measured by
individual temperature loggers placed in hedgerows from January 7 – May 29, 2020. Langley 1 data are
not reported due to an equipment malfunction.
Lowest daily Maximum number Maximum number Calendar dates of
minimum of consecutive of consecutive maximum number
temperature hours below hours below of consecutive Hedgerow
Site (°C) -1.6°C -10.2°C hours below -1.6°C orientation
Delta -8.7 76 hours 0 hours January 12-16 South-facing
Surrey -13.3 85 hours 3 hours January 12-16 East-facing
Langley 2 -10.6 112 hours 5 hours January 12-17 North-facing
Abbotsford 1 -12.8 137 hours 39 hours January 12-18 North-facing
Abbotsford 2 -12.3 131 hours 12 hours January 12-18 North-facing
-11.1* only
Langley 3 until Jan 22 90 hours 10 hours January 12-16 South-facing
-5.0* only
Langley 4 set up Jan 20 10 hours 0 hours March 16-17, 17-18 North-facing
Even though the length of time below -1.6°C was less in 2019-2020 based on historical Abbotsford
Airport temperatures of previous trapping years, the lowest daily minimum and maximum for this
winter were lower than that of the past several years (Tables 3, B1). The longest period of seven days
below -1.6°C was between January 12-18, 2020 (Table 3). This is consistent with what was observed in
the individual temperature loggers for all regions this year (Table 2). The longest duration of time below
-1.6°C for the past two winters were seven days and 12 days in mid February for 2017-18 and 2018-19
respectively, however both of these years had multiple cold snaps that accumulated more days below -
1.6°C than 2019-2020 (Table 3).
8Table 3. Coldest temperatures and consecutive number of days below -1.6°C measured at the Abbotsford
Airport (Environment Canada) since 2017-18.
Lowest daily Lowest daily
minimum maximum Number of consecutive days below -1.6°C Total days below
Year temp (°C) temp (°C) (calendar dates) -1.6°C
2 days (Dec 20-21, Feb 12-13), 5 days (Dec 30-
2017-2018 -6.6 -2.1 Jan 3), 6 days (Dec 23-28), 7 days (Feb 18-24) 25 days
4 days (Dec 4-7), 12 days (Feb 3-14), 4 days
2018-2019 -9.1 -3.6 (March 4-7), 2 days (March 9-10) 22 days
3 days (Nov 29-Dec 1), 2 days (Dec 23-24), 7
days (Jan 12-18), 3 days (Feb 18-20), 2 days
2019-2020 -12.3 -9.5 (March 17-18) 17 days
Oregon State University’s Degree Day model shows that the 2020 season was similar to 2019 in the early
spring but then proceeded to be a few days behind from June onwards (Tables 4, B2). First egg laying by
the overwintering female SWD was predicted to be one day earlier in 2020 compared to 2019, and peak
egg laying was one day later (Table 4). Even though there was a cold period in the winter that had
potential to kill overwintering populations of SWD, the mild and humid weather of the late spring and
early summer caused ideal conditions for SWD reproduction. This, in turn, caused the SWD trap counts
and larval pressure to be high in early and mid season crops where management was poor (E.S.
Cropconsult, field observation). This indicates that, although winter temperatures can be a good
predictor for SWD pressure entering the growing season, conditions during the spring months (April to
June) can influence what is seen in the harvested crop and SWD populations are capable of quickly
rebounding following a cold winter, if spring conditions are ideal.
Table 4. Dates corresponding with SWD development predicted by the SWD degree day model (OSU
Online Phenology and Degree Day Models) and Abbotsford airport temperatures in 2017-2020
(Environment Canada).
First egg Peak egg First egg Peak 1st Peak egg Peak 2nd Peak egg
laying by laying by laying by 1st generation laying by 1st generation laying by 2nd
OW OW generation adult generation adult generation
females females females emergence females emergence females
Year (261 DD50) (510 DD50) (565 DD50) (755 DD50) (995 DD50) (1249 DD50) (1489 DD50)
2017 May 22 June 10 June 16 June 29 July 14 July 30 Aug 10
2018 May 27 June 22 June 25 July 7 July 23 Aug 6 Aug 20
2019 May 15 June 11 June 17 June 30 July 15 July 28 Aug 8
2020 May 14 June 12 June 19 July 4 July 20 Aug 3 Aug 17
9Conclusion The objectives of this project were to set up spotted wing drosophila (SWD) traps in winter and spring 2020, to record temperatures, and to compare data with previous years. These data were then used to help predict the SWD pressure for the 2020 season, and this prediction was shared with berry growers in the Fraser Valley via newsletters (Fig. C1). High levels of SWD were caught in the traps baited with apple cider vinegar and antifreeze in the first trapping period. After an extended period of low temperatures, a significant decrease occurred. This continues to show a close link between the temperature and overwintering SWD adult survival, which has been seen in previous trapping years as well, especially when the temperature remains below the lethal temperatures of -1.6°C for 24 hours (Kimura 2004) or the LT80-1hr of -10.2°C (Toxopeus et al. 2016) for longer periods of time. As SWD continue to be present each season, it has been a concern of berry growers in all growing regions that there are surviving adults every winter, despite long periods of sub-zero temperatures. The survival of SWD adults is likely due to their ability to find shelter in buildings or treed areas, allowing them to be protected from sub-zero temperatures. Continuing to trap in the winter and spring with the most effective traps each year is a valuable tool to help estimate the survival rates of SWD and to forecast pest pressure for the upcoming berry season. Even with long periods of cold weather to potentially reduce the number of SWD for the early spring pressure, it is important for growers to adopt best management practices throughout the growing season. Once wild fruit is available in the spring as a food source for SWD, and with the right environmental conditions, populations can quickly build, as was seen in 2020. With their propensity to rapidly increase in population size, cold winters are not the only factor keeping SWD pressure low for the berry growing season. Acknowledgements Thank you to the grower cooperators for allowing us access to their fields for trapping activities, as well as the staff at E.S. Cropconsult Ltd. who were a part of the trap collections and assessments. We would like to thank Tracy Hueppelsheuser, Mark Sweeney, and Carolyn Teasdale for their input into the research design and methodology. 10
References
Enriquez, T., and Colinet, H. 2017. Basal tolerance to heat and cold exposure of the spotted wing
drosophila, Drosophila suzukii. PeerJ, 5: e3112.

Environment Canada. Historical Climate Data. Available from http://climate.weather.gc.ca/ [accessed 25
August 2020].

Jakobs, R., Gariepy, T.D., Sinclair, B.J. 2015. Adult plasticity of cold tolerance in a cool-temperate
population of Drosophila suzukii. Journal of Insect Physiology, 79: 1-9.

Kimura, M.T. 2004. Cold and heat tolerance of drosophilid flies with reference to their latitudinal
distributions. Oecologia, 140: 442-449.

Mittelstaedt, A. 2019. Emerging pests, lower mainland horticulture 2018-2023: Winter, spring and
summer surveillance for spotted wing drosophila (SWD) and brown marmorated stink bug (BMSB) in BC
berry crops – progress report. Project report to BC Ministry of Agriculture.

Mittelstaedt, A., and Scholefield, J. 2017. Winter and spring spotted wing drosophila trapping –
December 2016 – September 30, 2017: Final Report. Project report to BC Ministry of Agriculture.

Oregon State University (OSU). Online Phenology and Degree Day Models for agricultural and pest
management decision making in the US. Available from http://uspest.org/cgi-bin/ddmodel.us [accessed
25 August 2020].

Stockton, D.G., Wallingford, A.K., Loeb, G.M. 2018. Phenotypic plasticity promotes overwintering
survival in a globally invasive crop pest, Drosophila suzukii. Insects 9: 105.

Toxopeus, J., Jakobs, R., Ferguson, L.V., Gariepy, T.D., Sinclair, B.J. 2016. Reproductive arrest and stress
resistance in winter-acclimated Drosophila suzukii. Journal of Insect Physiology, 89: 37-51.

11
Appendix A – Summary of mean SWD numbers
           Table A1. Summary of mean SWD numbers (± standard error of the mean) in four Contech traps placed in hedgerows adjacent to eight berry
           fields in the Fraser Valley from January 7 to June 3, 2020. Trap catches are reported at bi-weekly intervals from January 7 to April 16 and weekly
           intervals from April 16 to June 3, 2020.

                                                                                                                                           May       May        May
                             Jan 7-   Jan 23-   Feb 7-    Feb 19-   Mar 4-     Mar 20-   Apr 1-    Apr 17-   Apr 27-   May 1-    May 8-    15-May    22-May     29-Jun
Location                     Jan 23   Feb 7     Feb 19    Mar 4     Mar 20     Apr 1     Apr 17    Apr 27    May 1     May 8     May 15    22        29         3
Delta              Mean        35.5    69.25       7.5      2.75       3         0.5      1.75      1.25      0.75       4.5       1.5       8.25     12.75       N/A
                   ±s.e.m.    12.39    19.87      1.19      0.48     1.08       0.50      0.63      0.48      0.48      1.55      0.87       1.31      3.75
Surrey             Mean         0.5     0.25        0         0        0          0         0         0         0       0.25        0          0       0.25       N/A
                   ±s.e.m.     0.50     0.25        0         0        0          0         0         0         0       0.25        0          0       0.25
Langley 1          Mean       56.75    10.25        1       0.25     0.25         0         0         0       0.25      0.75      4.25        3.5       0.5       N/A
                   ±s.e.m.    25.07     2.39      0.71      0.25     0.25         0         0         0       0.25      0.48      0.48       0.96      0.29
Langley 2          Mean       21.25       6         1         0        0          0        0.5        0         1        0.5      1.75       0.75      1.25       N/A
                   ±s.e.m.     7.65     2.38      0.71        0        0          0       0.50        0       0.58      0.50      0.85       0.75      0.75
Langley 3          Mean        1.75      2.5       1.5       0.5       0          0         0       0.25        0         0       0.25        0.5      N/A       0.25
                   ±s.e.m.     0.85     1.55      1.50      0.29       0          0         0       0.25        0         0       0.25       0.29                0.18
Langley 4          Mean         4.5       1        0.5        0      0.25         0       0.25       0.5      1.25      1.25       2.5       N/A       1.25       N/A
                   ±s.e.m.     1.19       0       0.50        0      0.25         0       0.25      0.50      0.63      0.95      0.87                 0.75
Abbotsford 1       Mean        0.25     0.75       2.5       0.5     0.75        0.5        0       0.75        0        0.5      0.25       0.75        1        N/A
                   ±s.e.m.     0.25     0.75      1.26      0.50     0.48       0.29        0       0.48        0       0.29      0.25       0.48      0.71
Abbotsford 2       Mean        0.25       0       0.25        0        0          0         0       0.25        0       0.75      2.25       N/A         8        N/A
                   ±s.e.m.     0.25       0       0.25        0        0          0         0       0.25        0       0.48      0.85                 5.21
Appendix B – Historical Temperature Data
Table B1. Coldest temperature and consecutive number of days below -1.6°C measured at the Abbotsford
Airport (Environment Canada) since 2010-11.
Lowest daily Lowest daily Total days
minimum maximum Number of consecutive days below -1.6°C below
Year temp (°C) temp (°C) (calendar dates) -1.6°C
2010-2011 -10.9 -4.1 3 days (Nov 22-24, 2010) 3 days
2011-2012 -14.8 -9 2 days (Jan 18-19, 2012) 2 days
2012-2013 -7.7 -0.1 1 day (Jan 13, 2013) 1 day
2013-2014 -11.3 -3.4 4 days (Dec 6-9, 2013), 2 days (Feb 4-5, 2014) 6 days
2014-2015 -9.2 -2.3 1 day (Nov 29, 2014) 1 day
2015-2016 -6.5 1.6 0 days 0 days
6 days (Dec 5-10, 2016), 8 days (Dec 12-19), 3
days (Dec 24-26), 6 days (Jan 2-7, 2017), 8 days
2016-2017 -11.9 -4.8 (Jan 9-16), 7 days (Feb 3-9), 2 days (Feb 27-28) 40 days
2 days (Dec 20-21, Feb 12-13), 5 days (Dec 30-Jan
2017-2018 -6.6 -2.1 3), 6 days (Dec 23-28), 7 days (Feb 18-24) 25 days
4 days (Dec 4-7), 12 days (Feb 3-14), 4 days
2018-2019 -9.1 -3.6 (March 4-7), 2 days (March 9-10) 22 days
3 days (Nov 29-Dec 1), 2 days (Dec 23-24), 7 days
(Jan 12-18), 3 days (Feb 18-20), 2 days (March 17-
2019-2020 -12.3 -9.5 18) 17 days
Table B2. Dates corresponding with SWD development predicted by the SWD degree day model (OSU
Online Phenology and Degree Day Models) and Abbotsford airport temperatures in 2011-2019
(Environment Canada).
First egg Peak egg First egg Peak 1st Peak egg Peak 2nd Peak egg
laying by laying by laying by 1st generation laying by 1st generation laying by 2nd
OW OW generation adult generation adult generation
females females females emergence females emergence females
Year (261 DD50) (510 DD50) (565 DD50) (755 DD50) (995 DD50) (1249 DD50) (1489 DD50)
2011 June 8 July 2 July 6 July 21 Aug 6 Aug 24 Sept 8
2012 May 26 June 28 July 4 July 16 Aug 3 Aug 16 Sept 4
2013 May 17 June 21 June 25 July 6 July 21 Aug 6 Aug 20
2014 May 18 June 17 June 23 July 6 July 18 Aug 3 Aug 16
2015 May 10 June 2 June 7 June 19 July 2 July 14 July 29
2016 April 28 May 25 June 1 June 18 July 8 July 25 Aug 10
2017 May 22 June 10 June 16 June 29 July 14 July 30 Aug 10
2018 May 27 June 22 June 25 July 7 July 23 Aug 6 Aug 20
2019 May 15 June 11 June 17 June 30 July 15 July 28 Aug 8
2020 May 14 June 12 June 19 July 4 July 20 Aug 3 Aug 17Appendix C – Excerpt from Blueberry IPM Newsletter Figure C1. Winter SWD Trapping Update for BCBC IPM Newsletter – May 29, 2020 13
You can also read