APPENDIX Onshore Electric and Magnetic Field Assessment - JULY 2021
←
→
Page content transcription
If your browser does not render page correctly, please read the page content below
Empire Offshore Wind: Empire Wind Project (EW 1 and EW 2)
                           Construction and Operations Plan

 APPENDIX
     Onshore Electric and
Magnetic Field Assessment

                      Prepared for
                                     FF
  JULY 2021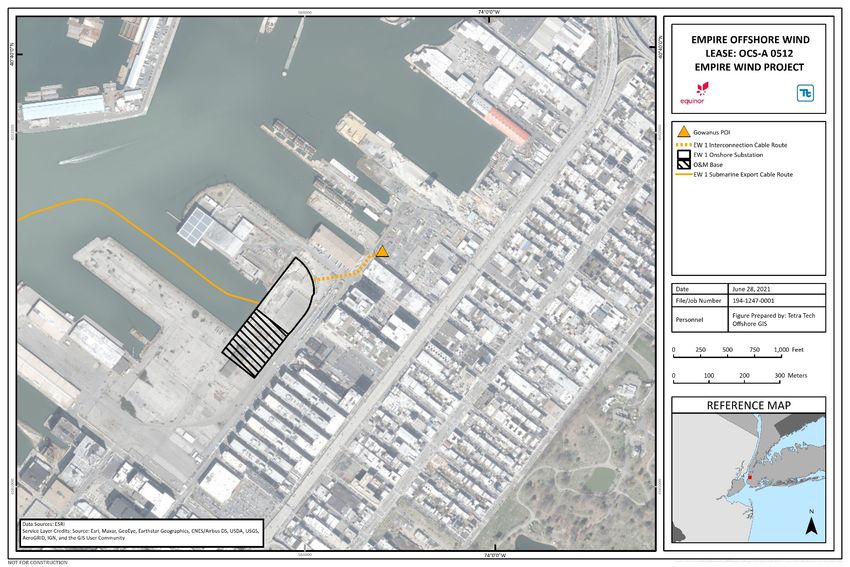
Exponent Engineering P.C.
Electrical Engineering and Computer
Science Practice

Empire Offshore Wind:
Empire Wind Project (EW 1
and EW 2)

Onshore Magnetic-Field
Assessment
Empire Offshore Wind: Empire Wind Project (EW 1 and EW 2) Onshore Magnetic-Field Assessment Prepared for Empire Offshore Wind LLC 120 Long Ridge Road #3E01 Stamford, Connecticut 06902 Prepared by Exponent 17000 Science Drive Suite 200 Bowie, Maryland 20715 June 30, 2021 Exponent, Inc. 1805604.EX1 – 2338
June 30, 2021

Contents

                                                        Page

List of Figures                                       iii

List of Tables                                        iv

Acronyms and Abbreviations                             v

Executive Summary                                     vi

Introduction                                           1
    Project Description                                1
    Magnetic Fields                                    6
    Assessment Criteria                                7

Cable Configurations and Calculation Methods           8
    EW 1: Onshore Interconnection Cables               8
    EW 2: Onshore Export Cables                        9
    EW 2: Onshore Interconnection Cables              10
    Calculation Methods                               10

Calculated Magnetic Fields                            12
    EW 1: Onshore Interconnection Cable               12
    EW 2: Onshore Cable                               14

Conclusions                                           16

References                                            17

Limitations                                           18

Attachment A Cable and Duct Bank Details
Attachment B Calculated Magnetic-Field Levels

                                           ii
1805604.EX1 – 2338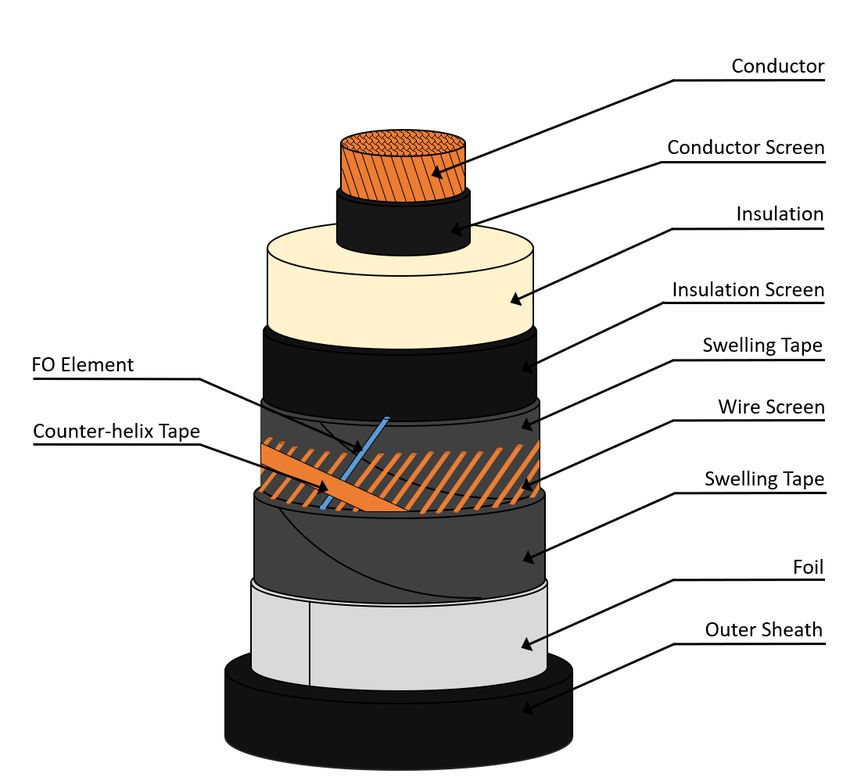
June 30, 2021

List of Figures

                                                                                                     Page

Figure 1.            Overview of the Lease Area and submarine export cable routes for EW 1
                     and EW 2.                                                                         3
Figure 2.            Overview of the proposed EW 1 submarine export cable route at landfall and
                     respective onshore interconnection cable.                                         4
Figure 3.            Overview of the proposed EW 2 submarine export cable route options at
                     landfall and respective onshore export cable route options. The onshore
                     interconnection cable route is also shown.                                        5
Figure 4.            Calculated magnetic-field levels at 3.3 ft (1 m) above ground for the Typical
                     configuration of EW 1 345-kV onshore interconnection cable at average
                     loading.                                                                         13
Figure 5.            Calculated magnetic-field levels at 3.3 ft (1.0 m) above ground for EW 2,
                     230-kV onshore export cables in the Typical configuration at average
                     loading.                                                                         14

                                                        iii
1805604.EX1 – 2338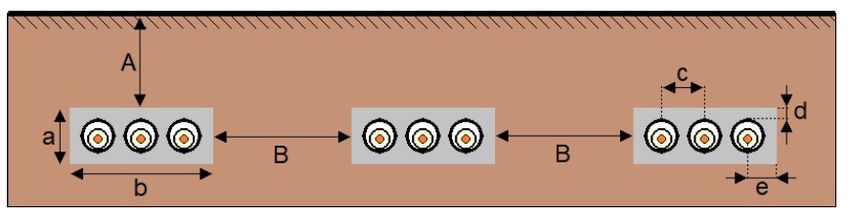
June 30, 2021

List of Tables

                                                                                                    Page

Table 1.             Current flow in the onshore cables                                              10
Table 2.             Calculated magnetic-field levels (mG) at 3.3 ft (1 m) above ground for the
                     Typical configuration of the EW 1 345-kV onshore interconnection cable at
                     average loading                                                                 13
Table 3.             Calculated magnetic-field levels (mG) at 3.3 ft (1.0 m) above ground for the
                     Typical configuration of EW 2 for the 230-kV onshore export cable at
                     average loading                                                                 15

                                                          iv
1805604.EX1 – 2338
June 30, 2021

Acronyms and Abbreviations

A                    Ampere
AC                   Alternating current
DC                   Direct current
EMF                  Electric and magnetic fields
Empire               Empire Offshore Wind LLC
EW 1                 Empire Wind 1
EW 2                 Empire Wind 2
ft                   Feet
Hz                   Hertz
ICES                 International Committee on Electromagnetic Safety
ICNIRP               International Commission on Non-Ionizing Radiation
IEEE                 Institute of Electrical and Electronics Engineers
JTB                  Joint Transition Bay
km                   Kilometer
kV                   Kilovolt
Lease Area           designated Renewable Energy Lease Area OCS-A 0512
m                    Meter
mG                   Milligauss
mi                   Statute mile
MW                   Megawatt
nm                   Nautical mile
POI                  Point of Interconnection
Project              The offshore wind project for OCS A-0512 proposed by Empire Offshore
                     Wind LLC consisting of Empire Wind 1 (EW 1) and Empire Wind 2 (EW
                     2).
Project Area         The area associated with the build out of the Lease Area, submarine
                     export cables, interarray cables, and all onshore Project facilities.
WHO                  World Health Organization
XLPE                 Cross-linked polyethylene

                                                v
1805604.EX1 – 2338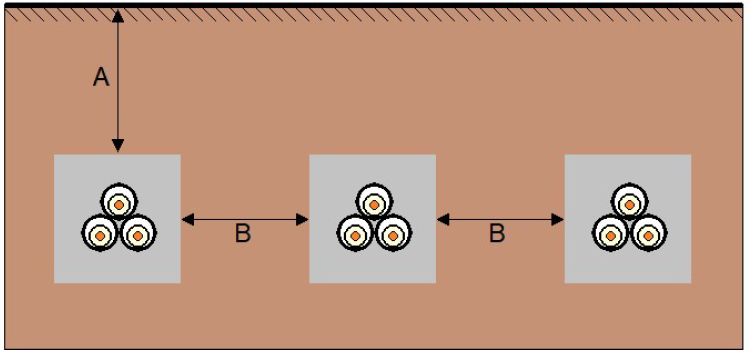
June 30, 2021

Executive Summary

Empire Offshore Wind LLC (Empire) proposes to construct and operate two separate offshore
wind facilities in the designated Renewable Energy Lease Area OCS-A 0512 located
approximately 14 statute miles (mi) (12 nautical miles [nm], 22 kilometers [km]) south of Long
Island, New York, and 19.5 mi (16.9 nm, 31.4 km) east of Long Branch, New Jersey. Empire
proposes to develop the Lease Area with two wind farms, known as Empire Wind 1 (EW 1) and
Empire Wind 2 (EW 2) (collectively referred to hereafter as the Project). EW 1 and EW 2 will
be electrically isolated and independent from each other. Each wind farm will connect offshore
substations to separate onshore Points of Interconnection by export cables and ultimately, over
interconnection cables to onshore substations. The Project includes two onshore locations where
the renewable electricity generated will be transmitted to the electric grid. In this report,
Exponent summarizes calculations of the magnetic fields associated with the operation of the
onshore export and interconnection cables planned for installation and operation in Brooklyn,
New York, and Long Beach and Hempstead, New York.

Magnetic-field levels were calculated for three representative configurations of the proposed
onshore export and interconnection cables constructed in underground duct banks during
average and peak electricity generation using conservative modeling assumptions expected to
overestimate the field levels. The magnetic-field levels associated with the operation of the
Project’s onshore cables in these representative configurations at average and peak current flows
were calculated to be well below exposure limits published by the International Committee on
Electromagnetic Safety and the International Commission on Non-Ionizing Radiation
Protection, which are designed to protect the health and safety of the general public.

Note that this Executive Summary does not contain all of Exponent’s technical evaluations,
analyses, conclusions, and recommendations. Hence, the main body of this report is at all times
the controlling document.

                                                  vi
1805604.EX1 – 2338
June 30, 2021
Introduction
Project Description
Empire Offshore Wind LLC (Empire) proposes to construct and operate the Project located in
the designated Renewable Energy Lease Area OCS-A 0512 (Lease Area). The Lease Area
covers approximately 79,350 acres (32,112 hectares) and is located approximately 14 statute
miles (mi) (12 nautical miles [nm], 22 kilometers [km]) south of Long Island, New York, and
19.5 mi (16.9 nm, 31.4 km) east of Long Branch, New Jersey. Empire proposes to develop the
Lease Area with two wind farms, known as Empire Wind 1 (EW 1) and Empire Wind 2 (EW 2)
(collectively referred to hereafter as the Project). EW 1 and EW 2 will be electrically isolated
and independent from each other. Each wind farm will connect via offshore substations to
Points of Interconnection (POI) at onshore locations by way of export and interconnection
cables to onshore substations. In this respect, the Project includes two separate onshore locations
in New York where the renewable electricity generated will be transmitted to the electric grid.
This report summarizes the calculated levels of alternating current (AC) magnetic fields at
representative cross-sections of the underground export cables and interconnection cables in the
onshore portion of the Project. The assessment of the offshore portion of the Project is provided
in a companion report titled Empire Offshore Wind: Empire Wind Project (EW 1 and EW 2) -
Offshore Electric and Magnetic Field Assessment.
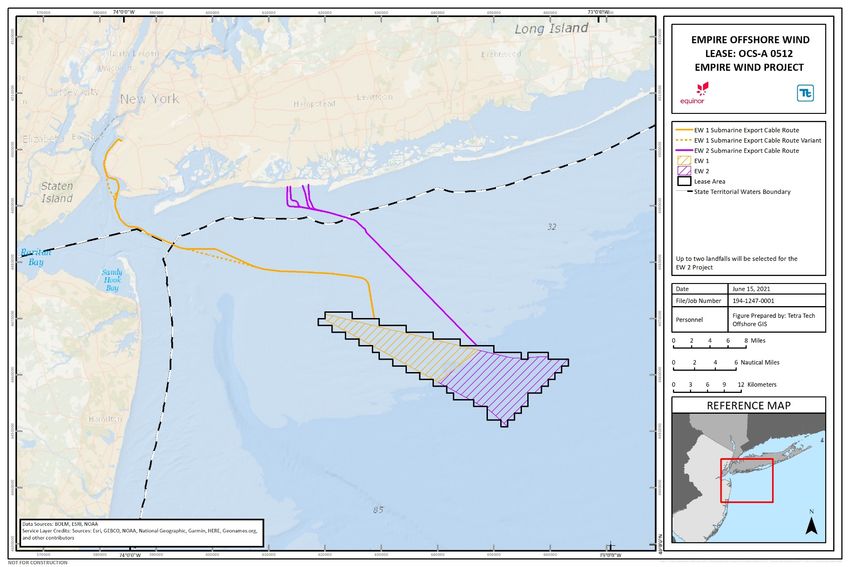
EW 1 will connect to an existing substation POI near the Gowanus neighborhood in Brooklyn,
New York. An overview of the offshore Project is shown in Figure 1. The routes of the onshore
interconnection cables proposed for EW 1 and the routes of the onshore export and
interconnection cables proposed for EW 2 are shown in Figure 2 and Figure 3, respectively.
Electricity generated in the EW 1 windfarm area will be transmitted to the POI as AC on the
following Project components:
1) Two submarine export cables, operating as separate circuits, with a voltage of
230 kilovolts (kV) will exit the offshore substation and traverse independently
approximately 40 nautical miles (46Miles, 74 kilometers) to a landing site in Brooklyn,
1
1805604.EX1 – 2338June 30, 2021
New York, where the submarine export cable will connect directly to the onshore
substation;
2) At the onshore substation, the voltage of the electricity will be stepped up to 345 kV for
connection to the electrical grid; and
3) Two 345-kV onshore interconnection cable circuits in a dual-circuit duct bank will
connect the onshore substation to the POI.
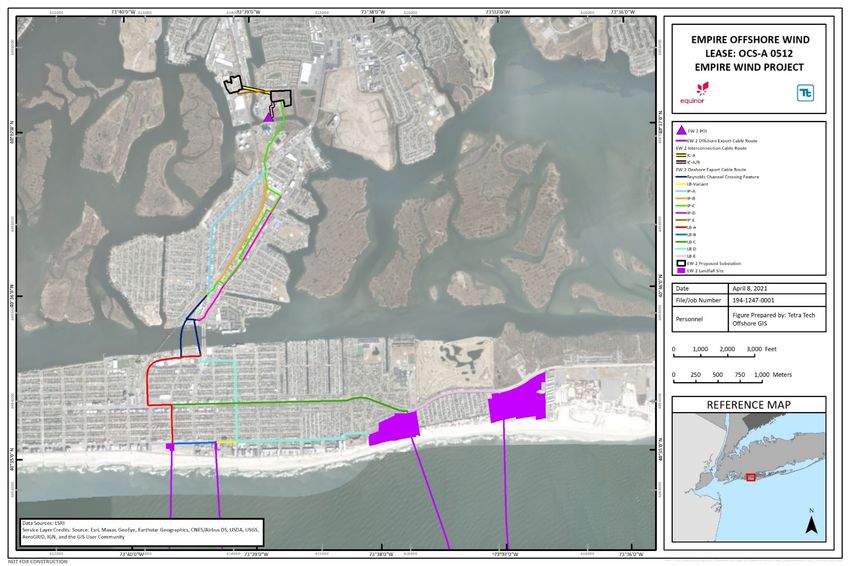
EW 2 will connect to the existing substation at the Barrett POI in Oceanside, New York.
Electricity generated in the EW 2 windfarm area will be carried to shore as AC on the following
Project components:
1) Three submarine export cables, each operating as a separate circuit, will exit the offshore
substations as individual cable circuits at a voltage of 230 kV and traverse the 26
nautical mile (30-mile, 48 kilometer) distance to the cable landfall in Long Beach, New
York.
2) At landfall, the submarine export cables will enter the joint transition bays (JTB) where
each of the three conductors within the cable will be spliced to corresponding conductors
of the onshore export cables. These onshore export cables will continue in a triple-circuit
underground duct bank to the proposed onshore substation.
3) At the onshore substation the 230-kV voltage will be stepped down to 138 kV.
4) Three 138-kV onshore interconnection cable circuits in a triple-circuit underground duct
bank will connect the onshore substation to the POI.
2
1805604.EX1 – 2338June 30, 2021 Figure 1. Overview of the Lease Area and submarine export cable routes for EW 1 and EW 2. 1805604.EX1 – 2338 3
June 30, 2021

 Figure 2.           Overview of the proposed EW 1 submarine export cable route at landfall and respective onshore interconnection
                     cable.

1805604.EX1 – 2338                                                   4
June 30, 2021
Figure 3. Overview of the proposed EW 2 submarine export cable route options at landfall and respective onshore export
cable route options. The onshore interconnection cable route is also shown.
1805604.EX1 – 2338 5June 30, 2021
Magnetic Fields
The flow of electric currents on the onshore export cables and onshore interconnection cables
will create magnetic fields above ground. These magnetic-field levels will be highest near the
cables and decrease rapidly with distance, generally in proportion to the square of the distance
from the cables. Magnetic fields are reported as root-mean-square magnetic flux density in units
of milligauss (mG), where 1 Gauss is equal to 1,000 mG. 1
The onshore export cables and onshore interconnection cables also create electric fields
underground inside the cable insulation and sheath due to the voltage applied to the conductors
located within the cables. However, since the conductors are encased within conductive metallic
sheathing, these electric fields will not be present above ground because they are entirely
blocked by this shielding (CSA Ocean Sciences Inc., and Exponent, 2019).
The levels of magnetic fields will vary depending on the magnitude of electric current—
reported in units of Amperes (A)—carried on the cables at any one time. Therefore,
calculations of magnetic fields represent only a snapshot at one moment due to the varying
power generated by the turbines, which depends both on operational status and wind speed. To
account for the variability of current, calculations of magnetic fields were performed for the
peak current at which the windfarm can operate, which will indicate the highest magnetic-field
levels that can occur, and for the annual average current that represents more typical field levels
over time. Additional discussion of the fields associated with offshore windfarm submarine
cables in general is provided in a report issued by the Bureau of Ocean Energy Management
(CSA Ocean Sciences Inc., and Exponent, 2019).
1
Magnetic fields also are commonly reported in units of microtesla, where 0.1 microtesla is equal to 1 mG.
6
1805604.EX1 – 2338June 30, 2021
Assessment Criteria
The State of New York has developed standards to which new AC transmission lines must
adhere. These standards are evaluated at winter normal conductor rating, which is the maximum
load (and hence maximum magnetic field) that the transmission line can continuously sustain.
The Article VII report to be submitted to the New York State Public Service Commission will
demonstrate compliance with the magnetic-field standard.
There are no federal standards that limit magnetic fields produced by electric system
infrastructure, but two international organizations provide guidance on limiting exposure to
magnetic fields, which is based on extensive review and evaluation of relevant research of
health and safety issues—the International Committee on Electromagnetic Safety (ICES), which
is a committee under the oversight of the Institute of Electrical and Electronics Engineers
(IEEE), and the International Commission on Non-Ionizing Radiation (ICNIRP), an
independent organization providing scientific advice and guidance on electromagnetic fields.
Both organizations have recommended limits designed to protect the health and safety of
persons in occupational settings and for the general public. The ICES exposure reference level
for the general public to 60-Hertz (Hz) magnetic fields is 9,040 mG, and ICNIRP determined a
reference level limit for whole-body exposure to 60-Hz magnetic fields at 2,000 mG (ICES,
2019, ICNIRP, 2010). The World Health Organization (WHO), a scientific organization within
the United Nations system with the mandate to provide leadership on global health matters;
shape health research agendas; and set norms and standards, views these standards as protective
of public health (WHO, 2007). The WHO assessment also states “[g]iven the weakness of the
evidence for a link between [long-term] exposure to ELF magnetic fields” and health effects at
levels below these standards, “the benefits of exposure reduction on health are unclear and thus
the cost of reducing exposure should be very low” (p. 372).
7
1805604.EX1 – 2338June 30, 2021
Cable Configurations and Calculation Methods
Exponent calculated the 60-Hz magnetic fields associated with the operation of the onshore
export and interconnection cables proposed to be installed as part of the Project. The cables are
to be installed predominantly in duct banks onshore and the methods used for calculating the
above ground magnetic-field levels are described below.
EW 1: Onshore Interconnection Cables
The EW 1 offshore submarine export cables will terminate at the onshore substation, so there is
no onshore export cable for EW 1. At the onshore substation, the voltage will be stepped up to
345 kV. From the onshore substation, interconnection cables installed in a double-circuit
underground duct bank will transmit power to the POI. A cross-sectional drawing of the
components of a representative individual single-conductor cross-linked polyethylene (XLPE)
cable is shown in Figure A-1 in Attachment A. At 345-kV, each circuit will carry an average
current of 618 A and a peak current of 727 A.
The dominant installation configuration for the proposed cables, referred to here as the Typical
configuration, has the two circuits in a trefoil arrangement side-by-side at a minimum target
burial depth of 3 feet (ft) (0.9 m) to the top of the duct bank, 2 and a minimum separation
distance between duct banks of 0.0 ft (0.0 m). The Typical configuration will represent the
preferred and most likely installation scenario for the majority of the onshore interconnection
cable route between the onshore substation and the POI. A cross-sectional drawing of the
Typical configuration is shown in Figure A-2 in Attachment A.
A circuit spacing greater than the preferred value will only be used for short distances when
installation conditions require greater separation such as at JTBs or splice vaults, at locations
using horizontal directional drilling, or to accommodate existing utilities. For each of these
2
For greater burial depth, magnetic-field levels would be lower.
8
1805604.EX1 – 2338June 30, 2021
locations it is anticipated that the horizontal separation between the two circuits will be up to
10 ft (3 m).
Other alternative cable installation configurations, such as at road crossings or where deeper
burial is not possible, also may be required for limited distances, as discussed in greater detail in
Attachment A.
EW 2: Onshore Export Cables
At landfall for EW 2, the three submarine export cable circuits will enter JTBs where the
submarine cables will be spliced to individual onshore XLPE export cables. From the JTBs,
power to the proposed onshore substation will be carried on these onshore export cables as
installed in a triple-circuit underground duct bank. Each circuit will operate at 230-kV.. At 230
kV, each circuit will carry an average current of 927 A and a peak current of 1,090 A.
The configuration of EW 2 calls for each circuit in a trefoil configuration in a triple-circuit duct
bank, whereas two circuits are proposed for EW 1 (see Figure A-2 in Attachment A). Otherwise,
the dominant and alternative installation scenarios for the EW 2 onshore export cables are
similar to that described above for EW 1 onshore Project cables. That is, the proposed cables
will be primarily installed according to the preferred Typical configuration described above,
with the three single-conductor cables of each circuit arranged in a trefoil configuration installed
in a duct bank at a minimum target burial depth of 3 ft (0.9 m) to the top of the duct bank, 3 and a
minimum separation distance between duct banks of 0.0 ft (0.0 m).
As noted above for EW 1, and described further in Attachment A, a circuit spacing greater than
the preferred value or alternative cable installation configurations may be used for short
distances when necessitated by circumstances. For each of these locations it is anticipated that
the horizontal separation between the two circuits will be up to 20 ft (6 m).
3
For greater burial depth, magnetic-field levels would be lower.
9
1805604.EX1 – 2338June 30, 2021
EW 2: Onshore Interconnection Cables
At the onshore substation, the voltage will be stepped down to 138 kV. From the onshore
substation, the power will be carried to the POI via onshore interconnection cables on a triple-
circuit underground duct bank identical to the EW 2 onshore export cables. As a result of the
conversion to 138 kV, the average and peak current flowing on the interconnection cables will
differ, as shown in Table 1. The dominant and alternative cable installation scenarios for the
EW 2 onshore interconnection cables are identical to those used for the EW 2 onshore export
cables, described above.
The correspondence between the circuit voltage and current flow is illustrated in Table 1.
Higher circuit voltage can deliver similar amounts of power at lower current flow as evident
from the relationship Power = Voltage × Current. Thus, a higher voltage cable carries a lower
current to deliver the same power as a lower voltage cable and will produce lower magnetic
fields.
Table 1. Current flow in the onshore cables
Wind Farm Cable Average Current (A) Peak Current (A)
Interconnection /
EW 1 618 727
345 kV
Onshore Export /
927 1,090
230kV
EW 2
Interconnection /
1,545 1,817
138 kV
In EW2, the onshore export cables will be installed and will operate at 230 kV for most of the
route between the JTBs and the existing onshore substations. The EW 2 138-kV onshore
interconnection cable will be installed for only a short distance between the onshore substation
and the adjacent POI.
Calculation Methods
Magnetic-field levels were calculated for each cable configuration using conservative
assumptions to ensure that the calculated field levels overestimate the field levels measured at
10
1805604.EX1 – 2338June 30, 2021
any specified current flow. Magnetic-field levels were calculated using computer algorithms
developed by the Bonneville Power Administration, an agency of the U.S. Department of
Energy (BPA, 1991). All calculations were made assuming that the conductors of the
transmission line are parallel to one another and infinite in extent. Although these assumptions
simplify the calculations, they do not decrease the accuracy of the model, and the BPA
algorithms have been shown to accurately predict magnetic-field levels measured near
transmission lines (Chartier and Dickson, 1990; Perrin et al., 1991). Field levels were calculated
at a height of 3.3 ft (1 m) above ground and reported as the resultant root mean square field
level of the three orthogonal field components in accordance with IEEE Std. C95.3.1-2010
(IEEE, 2010) and IEEE Std. 644-2019 (IEEE, 2019). 4 Although the routes of the onshore export
cables and surrounding infrastructure (e.g., existing transmission or distribution lines,
substations, etc.) will differ for each landing site, the magnetic-field levels from the proposed
duct banks will not vary by location, and the calculations provided are representative of export
cable installations along each onshore route. 5
4
For an Article VII filing in New York, magnetic-field levels are required to be reported as the maximum of the
field ellipse, which is similar to the resultant root mean square field, but may not be exactly the same.
5
The existing electrical power infrastructure adjacent to the proposed route of the onshore export cables is
currently unknown and may differ among the routes. Hence, there may be small differences in total magnetic-
field level (from both existing and proposed sources) between routes. In that case, magnetic-field levels may be
different than calculated here and require additional assessment once existing infrastructure is identified.
11
1805604.EX1 – 2338June 30, 2021
Calculated Magnetic Fields
Magnetic-field levels were calculated for the proposed onshore cables of EW 1 and EW 2 for
average and peak current flows. Calculated field levels for the dominant Typical configuration
in the preferred arrangement for average current flows are summarized below and represent
field levels expected to typically occur along proposed routes. Calculated field levels for all
configurations and current flows are summarized in Attachment B.
EW 1: Onshore Interconnection Cable
Magnetic-field levels for the Typical configuration of the EW 1 onshore interconnection cable,
calculated at 3.3 ft (1 m) above ground, are plotted as a function of horizontal distance from the
midpoint between the two duct banks for a representative cross-section of the Typical
configuration (Figure 4).
Table 2 summarizes the calculated magnetic-field values for the EW 1 interconnection cable.
The highest calculated magnetic-field level at average loading is 37 mG directly over either of
the two duct banks, decreasing rapidly to 5 mG or less beyond a horizontal distance of 30 ft (9.1
m) from the center of the two duct banks. All calculated magnetic-field levels for this and short
alternative spacings and configurations are included in Attachment B. All calculated magnetic-
field levels are well below the ICNIRP reference level of 2,000 mG and the ICES exposure
reference level of 9,040 mG for exposure of the general public.
12
1805604.EX1 – 2338June 30, 2021
Figure 4. Calculated magnetic-field levels at 3.3 ft (1 m) above ground for the Typical
configuration of EW 1 345-kV onshore interconnection cable at average loading.
Table 2. Calculated magnetic-field levels (mG) at 3.3 ft (1 m) above ground for the
Typical configuration of the EW 1 345-kV onshore interconnection cable at
average loading
Distance from Center of Configuration
±10ft ±20ft ±30ft ±40ft ±50ft ±60 ft ±75 ft
Cable Max (±3 m) (±6.1 m) (±9.1 m) (±12 m) (±15 m) (±18 m) (±23 m)
EW 1
37 26 10 5.0 3.0 1.9 1.3 0.9
Interconnection
13
1805604.EX1 – 2338June 30, 2021
EW 2: Onshore Cable
Magnetic-field levels for the EW 2 onshore export cable configurations were calculated for 230-
kV voltage and associated current flow. Calculated magnetic-field levels at 3.3 ft (1.0 m) above
ground were plotted as a function of horizontal distance from the centerline of the middle duct
bank for the EW 2 Typical configuration in Figure 5.
Figure 5. Calculated magnetic-field levels at 3.3 ft (1.0 m) above ground for EW 2, 230-kV
onshore export cables in the Typical configuration at average loading.
The calculated magnetic fields associated with the operation of the EW 2 onshore export cable
are summarized in Table 3. The highest calculated field level for the EW 2 Typical
configuration at average loading is 79 mG directly over the centerline of the middle duct bank,
decreasing rapidly to 2.2 mG or less beyond a horizontal distance of 30 ft (9.1 m) from the
middle of the triple circuit arrangement. All calculated magnetic-field levels for this and short
alternative configurations (see Attachment B) are well below the ICNIRP reference level of
2,000 mG and the ICES exposure reference level of 9,040 mG for exposure of the general
public.
14
1805604.EX1 – 2338June 30, 2021
Table 3. Calculated magnetic-field levels (mG) at 3.3 ft (1.0 m) above ground for the
Typical configuration of EW 2 for the 230-kV onshore export cable at average
loading
Distance from Center of Configuration
±10ft ±20ft ±30ft ±40ft ±50ft ±60 ft ±75 ft
Cable Max (±3 m) (±6.1 m) (±9.1 m) (±12 m) (±15 m) (±18 m) (±23 m)
EW 2 Typical
79 30 6.6 2.2 1.0 0.5 0.3 0.2
Configuration
For the short EW 2 onshore interconnection cables, which are proposed to operate at 138 kV,
calculated magnetic-field levels are higher than for the onshore export cable, as indicated in
Table B-5 and Table B-6 of Attachment B. However, the onshore interconnection cable for EW
2 will comprise only a short distance between the onshore substation in an industrial area and
the adjacent POI (< 1% of the proposed onshore export cable route). Thus, the calculated
magnetic-field levels for the 230-kV onshore export cables represent the most typical field
levels expected along this proposed route segment.
15
1805604.EX1 – 2338June 30, 2021
Conclusions
The calculated magnetic-field levels generated by the Project’s onshore export and
interconnection cables are well below limits published by ICNIRP and ICES that are designed
to protect the health and safety of the general public. The highest calculated magnetic-field level
for the Typical configurations (proposed for the majority of the respective onshore cable routes)
at average current flow is 37 mG for EW 1 and 79 mG for EW 2, which is 25 to 200 times lower
than ICNIRP or ICES reference levels for exposure of the general public. For short distances
along the route where the cable may be installed in alternate configurations and in some
segments of the interconnection cable route, the magnetic-field levels are calculated to be higher
but will contribute little to overall exposure. For all cable configurations, the magnetic field at
peak current will be higher than at average current; however, the magnetic fields from all
configurations and all current levels will remain well below the ICNIRP and ICES limits.
16
1805604.EX1 – 2338June 30, 2021
References
Bonneville Power Administration (BPA). Corona and Field Effects Computer Program.
Bonneville Power Administration, 1991.
Bureau of Ocean Energy Management (BOEM). Evaluation of Potential EMF Effects on Fish
Species of Commercial or Recreational Fishing Importance in Southern New England. OCS
Study BOEM 2019-049. Prepared under contract by CSA Ocean Sciences Inc., and Exponent.
Sterling, VA: U.S. Dept. of the Interior, Bureau of Ocean Energy Management, Headquarters,
August 2019.
Chartier VL and Dickson LD. Results of Magnetic Field Measurements Conducted on Ross-
Lexington 230-kV Line. Report No. ELE-90-98. Bonneville Power Administration, 1990.
Institute of Electrical and Electronics Engineers (IEEE). Standard Procedures for Measurement
of Power Frequency Electric and Magnetic Fields from AC Power Lines. ANSI/IEEE Std. 644-
2019. New York: IEEE, 2019.
Institute of Electrical and Electronics Engineers (IEEE). IEEE Recommended Practice for
Measurements and Computations of Electric, Magnetic, and Electromagnetic Fields with
Respect to Human Exposure to Such Fields, 0 Hz to 100 kHz. IEEE Std. C95.3.1-2010. New
York: IEEE, 2010.
International Commission on Non-Ionizing Radiation Protection (ICNIRP). ICNIRP
statement—guidelines for limiting exposure to time-varying electric and magnetic fields (1 Hz
to 100 kHz). Health Phys 99:818-836, 2010.
International Committee on Electromagnetic Safety (ICES). IEEE Standard for Safety Levels
with Respect to Human Exposure to Electromagnetic Fields 0 to 300 GHz. IEEE Std C95.1-
2019 (Revision of IEEE Std C95.1-2005/ Incorporates IEEE Std C95.1-2019/Cor 1-2019). New
York, NY: IEEE, 2019.
Perrin N, Aggarwal RP, Bracken TD, Rankin RF. Survey of Magnetic Fields near BPA 230-kV
and 500-kV Transmission Lines. Portland, Oregon: Portland State University, 1991.
World Health Organization (WHO). Extremely Low Frequency Fields. Environmental Health
Criteria, Vol. 238. Geneva, World Health Organization, 2007.
17
1805604.EX1 – 2338June 30, 2021
Limitations
At the request of Empire, Exponent modeled the magnetic-field levels associated with the
operation of the onshore underground cables that will transport electricity generated by the
Project to the proposed points of interconnection.
This report summarizes the analysis performed to date and presents the findings resulting from
that work. In the analysis, we have relied on cable design geometry, usage, specifications, and
various other types of information provided by Empire. We cannot verify the correctness of this
input data and rely on Empire for the data’s accuracy. Although Exponent has exercised usual
and customary care in the conduct of this analysis, the responsibility for the design and
operation of the Project remains fully with the client. Empire has confirmed to Exponent that the
data contained herein are not subject to Critical Energy Infrastructure Information restrictions.
The results presented herein are made to a reasonable degree of engineering and scientific
certainty. Exponent reserves the right to supplement this report and to expand or modify
opinions based on review of additional material as it becomes available, through any additional
work, or review of additional work performed by others.
The scope of services performed during this investigation may not adequately address the needs
of other users of this report, and any re-use of this report or its findings, conclusions, or
recommendations presented herein for purposes other than intended for permitting of the
proposed Project are at the sole risk of the user. The opinions and comments formulated during
this assessment are based on observations and information available at the time of the
investigation. No guarantee or warranty as to future life or performance of any reviewed
condition is expressed or implied.
18
1805604.EX1 – 2338June 30, 2021
Benjamin R.T. Cotts, Ph.D., P.E. (Licensed Electrical Engineer, New York, #103209-01),
employed by Exponent, performed and reviewed calculations of the magnetic fields associated
with the operation of the proposed Project.
_____________________
Benjamin Cotts, Ph.D., P.E.
19
1805604.EX1 – 2338March 8, 2021 Attachment A Cable and Duct Bank Details 1805604.EX1 – 2338
June 30, 2021

Table A-1.           Summary of onshore cable parameters for EW 1 and EW 2

                                                 EW 1                                  EW 2
Description                                Interconnection              Export                Interconnection
Source capacity                            410 Megawatts                          410 Megawatts
Voltage                                         345 kV                  230 kV                    138 kV
Average Loading per Cable                       618 A                    927 A                    1545 A
Peak Loading per Cable                          727 A                   1090 A                    1817 A
Number of Cables                        6 (2 of each phase)                     9 (3 of each phase)
Typical Separation between
                                           0-10 ft (0-3 m)†         0-20 ft (0-6 m)†          0-20 ft (0-6 m)‡
Duct Banks (and range)
                                                                   Single-core XLPE,
Phase Cable Type,
                                                                5.2-inch Outer Diameter
Outer Diameter (OD)
                                                                     (133 millimeter)
Phase Conductor Diameter                                         2.5-inches (63.4 mm)
GCC cable type,
                                                                          N/A
Outer Diameter
Minimum Burial Depth**                                                3 ft (0.9m)
Evaluation Height                                             At 3.3 ft (1 m) above ground
†
 Center-to-center spacing between trefoil bundles.
‡
 Edge-to-edge distance between the duct banks.
**To the top of the duct bank or conduit.

                                                          A-1
1805604.EX1 – 2338
June 30, 2021
Figure A-1. Representative cross-section of a single conductor of an onshore cable.
A-2
1805604.EX1 – 2338June 30, 2021
Figure A-2 below shows a cross-section of the underground duct banks with cables in the trefoil
configuration. Short cable segments under a road may be in the Road Crossing configuration; in
the Road Crossing configuration, the cables will be installed in a trefoil configuration inside of
larger direct buried conduits or pipes, rather than in duct banks (Figure A-3). The minimum
target burial depth to the top of the trefoil-containing pipes is 3 ft (0.9 m), and the range of
possible separation distances between circuit centers at some locations beyond that of the
Typical configuration is 10 to 20 ft (3 to 6 m) for both EW 1 and EW 2. Alternatively, the
cables may be installed in duct banks with a Flat configuration (Figure A-4) for short distances
when the Typical configuration is not possible. The minimum separation distance between
onshore cable circuits in the Flat configuration is 0 to 10 ft (0 to 3 m) for EW 1 and 0 to 20 ft (0
to 6 m) for EW 2.
A-3
1805604.EX1 – 2338June 30, 2021
Figure A-2. Representative cross-section of the Typical configuration of onshore cables in
duct banks.
The configuration with B = 0.0 ft (0.0 m) represents the preferred and most
likely configuration for both the onshore export cables and onshore
interconnection cables for both EW 1 and EW 2 comprising the majority of the
respective routes. Note that for EW 1 only two trefoil-containing duct banks
will be installed.
Figure A-3. Representative cross-section of the road crossing
configuration of onshore cables.
Note that for EW 1 only two trefoil-containing conduits
will be installed.
A-4
1805604.EX1 – 2338June 30, 2021
Figure A-4. Representative cross-section of the flat configuration of onshore cables.
Note that for EW 1 only two three-cable duct banks will be installed.
A-5
1805604.EX1 – 2338Attachment B Calculated Magnetic Field Levels
June 30, 2021
   Table B-1.            Calculated magnetic-field levels (mG) 3.3 ft (1.0 m) above ground for the EW 1 345-kV onshore
                         interconnection cables in typical and alternative configurations at preferred circuit spacing at average loading

                                                                                      Horizontal Distance from Center
                                                           ±10ft        ±20ft          ±30ft       ±40ft       ±50ft     ±60 ft    ±75 ft    ±100 ft
                         Config    Spacing     Max        (±3 m)      (±6.1 m)       (±9.1 m)     (±12 m)     (±15 m)   (±18 m)   (±23 m)   (±23 m)

                        Typical      0 ft*      37          26           10            5.0         3.0         1.9        1.3       0.9       0.5

 EW 1 Inter-             Road
                                    10 ft**     75          44           13            5.7         3.2         2.0        1.4       0.9       0.5
 connection             Crossing

                          Flat       0 ft*     124          28           5.4           1.7         0.8         0.4        0.2       0.1       0.1

* Spacing represents the edge-to-edge distance between adjacent duct banks.
** Spacing represents the center-to-center distance between circuits.

                                                                               B-1
   1805604.EX1 – 2338
June 30, 2021
Table B-2. Calculated magnetic-field levels (mG) 3.3 ft (1.0 m) above ground for the EW 1 345-kV onshore
interconnection cables in typical and alternative configurations at preferred circuit spacing at peak loading
Horizontal Distance from Center
±10ft ±20ft ±30ft ±40ft ±50ft ±60 ft ±75 ft ±100 ft
Config Spacing Max (±3 m) (±6.1 m) (±9.1 m) (±12 m) (±15 m) (±18 m) (±23 m) (±23 m)
Typical 0 ft* 44 30 12 5.9 3.5 2.3 1.6 1.0 0.6
EW 1 Inter- Road
10 ft** 88 52 15 6.7 3.7 2.4 1.6 1.0 0.6
connection Crossing
Flat 0 ft* 145 33 6.3 2.0 0.9 0.5 0.3 0.1 0.1
* Spacing represents the edge-to-edge distance between adjacent duct banks.
** Spacing represents the center-to-center distance between circuits.
B-2
1805604.EX1 – 2338June 30, 2021
Table B-3. Calculated magnetic-field levels (mG) 3.3 ft (1.0 m) above ground for the EW 2 230-kV onshore export cables
with typical and alternative configurations at preferred circuit spacing at average loading
Horizontal Distance from Center
±10ft ±20ft ±30ft ±40ft ±50ft ±60 ft ±75 ft ±100 ft
Config Spacing Max (±3 m) (±6.1 m) (±9.1 m) (±12 m) (±15 m) (±18 m) (±23 m) (±23 m)
Typical 0 ft* 79 30 6.6 2.2 1.0 0.5 0.3 0.2 0.1
EW 2 Road
10 ft** 121 120 35 10 4.2 2.1 1.2 0.6 0.3
Export Crossing
Flat 0 ft* 285 77 14 4.5 2.0 1.0 0.6 0.3 0.1
* Spacing represents the edge-to-edge distance between adjacent duct banks.
** Spacing represents the center-to-center distance between circuits.
B-3
1805604.EX1 – 2338June 30, 2021
Table B-4. Calculated magnetic-field levels (mG) 3.3 ft (1.0 m) above ground for the EW 2 230-kV onshore export cables
with typical and alternative configurations at preferred circuit spacing at peak loading
Horizontal Distance from Center
±10ft ±20ft ±30ft ±40ft ±50ft ±60 ft ±75 ft ±100 ft
Config Spacing Max (±3 m) (±6.1 m) (±9.1 m) (±12 m) (±15 m) (±18 m) (±23 m) (±23 m)
Typical 0 ft* 93 35 7.8 2.6 1.2 0.6 0.4 0.2 0.1
EW 2 Road
10 ft** 142 141 42 12 5.0 2.5 1.4 0.7 0.3
Export Crossing
Flat 0 ft* 335 90 17 5.3 2.3 1.2 0.7 0.4 0.2
* Spacing represents the edge-to-edge distance between adjacent duct banks.
** Spacing represents the center-to-center distance between circuits.
B-4
1805604.EX1 – 2338June 30, 2021
Table B-5. Calculated magnetic-field levels (mG) 3.3 ft (1.0 m) above ground for the EW 2 138-kV onshore
interconnection in typical configuration at preferred circuit spacing at average loading
Horizontal Distance from Center
±10ft ±20ft ±30ft ±40ft ±50ft ±60 ft ±75 ft ±100 ft
Config Spacing Max (±3 m) (±6.1 m) (±9.1 m) (±12 m) (±15 m) (±18 m) (±23 m) (±23 m)
Typical 0 ft* 132 50 11 3.7 1.6 0.9 0.5 0.3 0.1
EW 2 Inter- Road
connection Crossing
10 ft** 202 200 59 17 7.1 3.6 2.0 1.0 0.4
Flat 0 ft* 475 128 24 7.6 3.3 1.7 1.0 0.5 0.2
* Spacing represents the edge-to-edge distance between adjacent duct banks.
** Spacing represents the center-to-center distance between circuits.
B-5
1805604.EX1 – 2338June 30, 2021
Table B-6. Calculated magnetic-field levels (mG) 3.3 ft (1.0 m) above ground for the EW 2 138-kV onshore
interconnection in typical configuration at preferred circuit spacing at peak loading
Horizontal Distance from Center
±10ft ±20ft ±30ft ±40ft ±50ft ±60 ft ±75 ft ±100 ft
Config Spacing Max (±3 m) (±6.1 m) (±9.1 m) (±12 m) (±15 m) (±18 m) (±23 m) (±23 m)
Typical 0 ft* 155 58 13 4.4 1.9 1.0 0.6 0.3 0.1
EW 2 Inter- Road
connection Crossing
10 ft** 237 235 69 20 8.3 4.2 2.4 1.2 0.5
Flat 0 ft* 559 151 28 8.9 3.8 2.0 1.2 0.6 0.3
* Spacing represents the edge-to-edge distance between adjacent duct banks.
** Spacing represents the center-to-center distance between circuits.
B-6
1805604.EX1 – 2338June 30, 2021
Figure B-1. Calculated magnetic-field levels at 3.3 ft (1.0 m) above ground for the EW 1 345-
kV onshore interconnection cable in the Typical configuration at average
loading.
B-1
1805604.EX1 – 2338June 30, 2021
Figure B-2. Calculated magnetic-field levels at 3.3 ft (1 m) above ground for the EW 1 345-
kV onshore interconnection cable for the Road Crossing configuration at the
preferred circuit spacing (10 ft [3 m]) at average loading.
B-2
1805604.EX1 – 2338June 30, 2021
Figure B-3. Calculated magnetic-field levels at 3.3 ft (1.0 m) above ground for the EW 1 345-
kV onshore interconnection cable for the Flat configuration at average loading.
B-3
1805604.EX1 – 2338June 30, 2021
Figure B-4. Calculated magnetic-field levels at 3.3 ft (1.0 m) above ground for the EW 2 230-
kV onshore export cable in the Typical configuration at average loading.
B-4
1805604.EX1 – 2338June 30, 2021
Figure B-5. Calculated magnetic-field levels at 3.3 ft (1.0 m) above ground for the EW 2 230-
kV onshore export cable for Road Crossing configuration at average loading.
B-5
1805604.EX1 – 2338June 30, 2021
Figure B-6. Calculated magnetic-field levels at 3.3 ft (1.0 m) above ground for the EW 2 230-
kV onshore export cable in the Flat configuration at average loading.
B-6
1805604.EX1 – 2338You can also read