Anticipated changes in the Nordic Seas marine climate: Scenarios for 2020, 2050, and 2080 - Core
←
→
Page content transcription
If your browser does not render page correctly, please read the page content below
Anticipated changes in the Nordic Seas marine climate:
             Scenarios for 2020, 2050, and 2080.
                                                       By

                       Tore Furevik1, Helge Drange2 , and Asgeir Sorteberg1,3
                               1
                                 Geophysical Institute, University of Bergen
                         2
                             Nansen Environmental and Remote Sensing Center
                              3
                                Bjerknes Collaboration for Climate Research
                                             Bergen, Norway

Abstract:
Possible future changes in the Nordic Seas marine climate are here discussed. The wide range of climate models
used in the Intergovernmental Panel on Climate Change predict a global mean temperature increase between 1-
6ºC by the end of this century, with the estimates using the intermediate IPCC B2 scenario being in the range
1.9-3.4ºC. For climate models forced by a 1percent per year CO2 increase only, the so-called CMIP2
integrations, the increase in temperatures is close to 2ºC after CO2 doubling. For the Arctic region, the warming
will probably be twice as high. A result is a rapid decline in the sea ice extent simulated by most models.
Changes in the Nordic Seas region have been analysed in a CMIP2-integration with the Bergen Climate Model.
In this model there is a trend towards more westerly winds, and by 2080 the entire Barents Sea is ice-free for all
months of the year, and the Arctic Ocean ice-free during the summer months. There is a 1-2ºC warming of the
Nordic Seas and Barents Sea, and a slight increase in the salinity. The Arctic Ocean is freshened, probably due to
more ice melting and river runoff from the Eurasian continent. There is no indication of a reduction of the deep-
water formation in the Nordic Seas.

1. Introduction
This is a contribution to the Arctic Climate Impact Assessment (ACIA) work, which goal is to
“evaluate and synthesize knowledge on climate variability, climate change, and increased
ultraviolet radiation and their consequences”. The impact assessment will address projected
future changes focusing on the periods near the years 2020, 2050, and 2080. ACIA is using
the B2 scenario, which is an intermediate scenario of the Intergovernmental Panel on Climate
Change (IPCC) Special reports, and describes a world with moderate increasing population,
economic development and technology change. The assessment will discuss the changes in
the Arctic in four different sub-regions (Figure 1): The Nordic Seas (including the Barents
Sea) sector towards the Pole, the Kara and Laptev Seas sector, the Chukchi and Bering Seas
and Alaskan coast sector, and finally the Labrador Sea, Baffin Bay, and Canadian
Archipelago sector. This note is an input to the marine climate part of ACIA sub-region 1, the
Nordic Seas sector.

This note is divided into seven sections. In the next section, predictions for the increase in the
global mean temperatures based on different models and emission scenarios are shown, and
the uncertainties in the climate scenarios are addressed (Section 2). In the following sections
we discuss the observed and predicted variability in the atmospheric temperatures and wind
systems (Section 3), the ocean circulation and water mass distribution (Section 4), the sea ice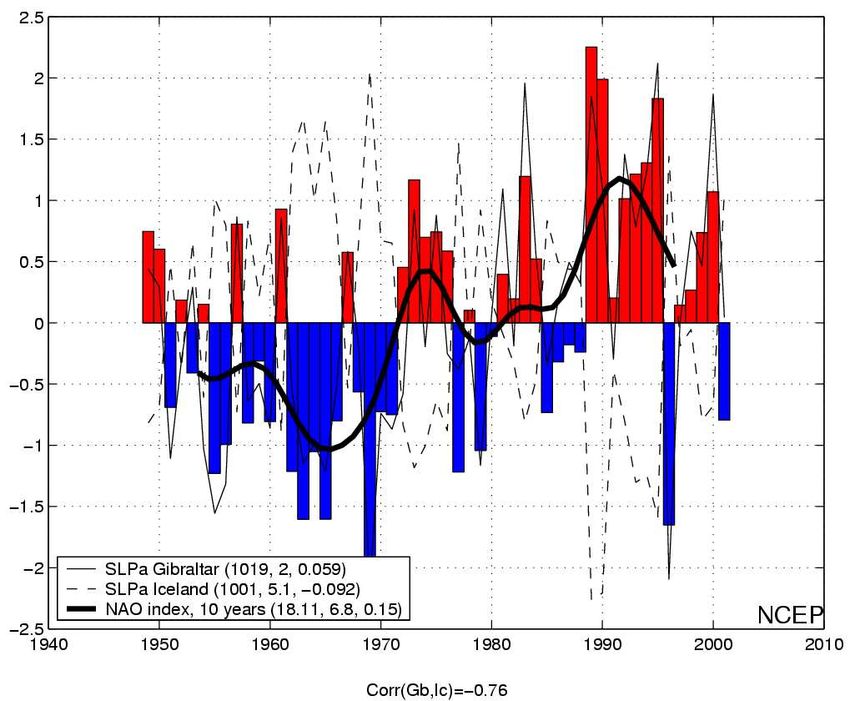
distribution (Section 5), and finally the mixing and deep-water formation (Section 6). A
summary table is given in Section 7.

Figure 1: The Arctic region. Dark shading marks permanent glaciers, and gray shading marks
permanent permafrost (Figure 16-1 in IPCC TAR: Impacts, adaptation and vulnerability).

2. B2 scenario predictions
Climate models using the moderate B2 scenario in average predict an increase in the global
mean temperatures of 0.7°C by the year 2020, 1.4°C by the year 2050 and 2.1°C by the year
2080 (Figure 2). The different climate models using this scenario predicts a temperature
increase by the year 2100 ranging from 1.9°C to 3.4°C, illustrating the large uncertainties in
the predictions.

An interesting program has been the coupled model inter-comparison project (CMIP), where a
control-integration and a perturbation-integration with a 1 percent increase in CO2 have been
compared for a range of different climate models. The change in the global mean temperature
for 18 of the models is shown in Figure 3, left. After 80 years (doubled CO2), the average
global mean temperature increase for the models is 2°C, or 0.25°C/decade, in the lower range
of the values found from the B2 scenario integrations. For the four models used in the B2
scenario (Figure 3, right), the average temperature increase averaged over the region north of
60°N is 0.4°C/decade, or almost twice the global trend.
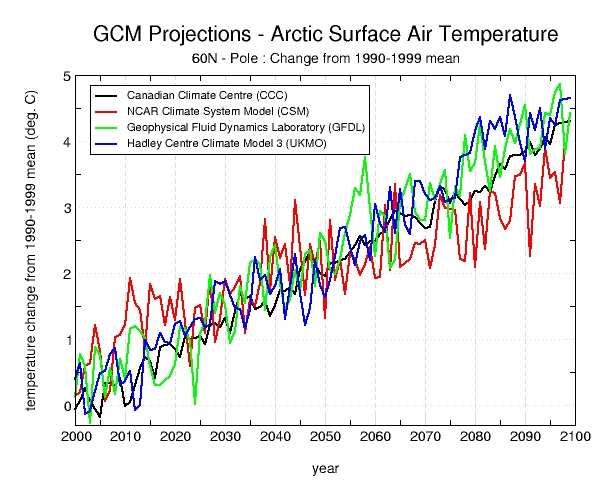
Figure 2: Future changes in global mean temperature different emission scenarios using
several different climate models. The bars show the range of simple model results in 2100
(Figure 9.14 in IPCC TAR: The Scientific Basis).

Figure 3: Left: Future changes in global mean temperatures for 18 different models
participating in the coupled model inter-comparison project second phase (CMIP2). The
only change from the control runs is a 1 percent increase in CO2 per year from ca 1990
values (Figure 9.3 in IPCC TAR: The Scientific Basis). Right: Future changes in Arctic mean
temperatures for 4 models using the B2 scenario (ACIA web pages,
http://zubov.atmos.uiuc.edu/ACIA/).

Turning from global to regional scale climate change, the uncertainties are generally much
larger. There are at least three reasons for this: 1) The natural variability in the local climate
may many places be of an order of magnitude larger than the variability in the global mean
state of the climate, so the signal to noise ratio becomes small; 2) we do not know all physics
behind the variability; and 3) parameterisations of unresolved topography and physics may be
inaccurate.
As the climate models have typically been too coarse to resolve local or regional topography
(typical grid size has been 200 km – 400 km), the usual approach to get high resolution
climate scenarios has been to take the results from a global model and use as input to a
regional atmospheric model. As there are large discrepancies between the climate scenarios
from the coarse models, output from several models should be dynamically downscaled in
this way, in order to give a best possible statistical significance for the results.

3. The atmosphere temperatures and wind system.

Observations
During the last decades, there has been a significant warming trend over the Arctic,
corresponding in average to approximately 5°C/century. The warming has not been uniformly
distributed, as there has been a slight cooling over the eastern Canada, northwest Atlantic and
Greenland area, and a stronger warming over Siberia.

The observed temperature pattern is related to the large-scale atmospheric pattern known as
the North Atlantic or Arctic Oscillation (NAO/AO), an atmospheric sea-saw in pressure
between the low-pressure region in the north, and the sub-tropical high in the south. The
strongest pattern is found in the North Atlantic, where the Icelandic low and the Azorean high
are the centers of action. A much-cited index for the NAO is the pressure difference between
the two poles, typically Lisbon or Gibraltar to the south, and southwest Iceland, to the north.
The NAO index resembles the global temperature pattern, with a preferred positive state
during the 1930s and 40s, a steadily decrease to a minima in the 1960s, and then a steady
increase towards record highs in the 1990s. The trend is a manifestation of a strengthening of
the North Atlantic westerlies, with increased heat and moisture transport responsible for a row
of warm and wet winters experienced in the North-east Europe experienced in the end of last
century.

Predictions
Figure 4 shows the predicted temperature increase from the 1961 to 1990 period, to the last
three decades in this century, as a mean over all models using the B2 scenario. They show a
general warming of typically 1-2°C over the oceans and 2-3°C over the continents. There is a
strong increase in the temperature trends towards the Arctic, with a temperature increase over
Norway ranging from 3°C in the south to 5°C in the north, and temperature increase over
northern part of Canada and Siberia reaching 6°C.

For the Nordic Seas area, the predicted temperature increase is ranging from 3°C in the south
to 6°C in the Fram Strait and eastern part of the Barents Sea region. In the Arctic Ocean, the
warming is exceeding 8°C north of the Siberia, while north of Alaska, Canada, and Greenland
it is only 5°C.
Figure 4: The multi-model ensemble annual mean change of the temperature (color shading),
its range (thin blue isolines) (Unit: °C) and the multi-model mean change divided by the multi-
model standard deviation (solid green isolines, absolute values) for the SRES scenario B2. Both
SRES scenarios show the period 2071 to 2100 relative to the period 1961 to 1990. See text for
scenario definitions and description of analysis technique. In (b) and (d) the ratio mean
change/standard deviation is increasing towards the low latitudes as well as in (a), (c) and (e),
while the high latitudes around Antarctica show a minimum (Figure 9.10 in IPCC TAR: The
Scientific Basis).

Here a warning should be given: The strongest temperature increase is evidently found in
areas where there is ice in present day climate (in the models), and not ice in the future
climate. Thus the strong warming found in the northern and eastern parts of the Nordic Seas,
is a result of errors in simulating the present day climate, giving too large ice cover, rather
than a warming of the open sea areas of the present day climate. In order to give realistic
scenarios for the atmosphere and ocean parameters in the Nordic Seas region, it is essential to
know how the NAO or AO will behave in a world with higher concentrations of greenhouse
gasses and sulphate (aerosols). However, the physics leading to the variability and recent
trend in the NAO/AO are not known. Several recent simulations with a relatively high-
resolution atmospheric model indicate that the NAO is forced from the tropics, and in
particular from the Pacific and Indian Ocean. The exact mechanism is not clear, but is seems
to be linked to changes in the precipitation pattern and release of latent heat. If they are right,
with increased greenhouse gas forcing and warmer waters in the tropical regions, we may
expect a continued trend towards stronger and more persistent westerlies, with especially
warmer and wetter winters as the result.

Analysis of the model output from several different climate models (Benestad, Cicerone 6,
2000), show a large spread in the simulated development of the NAO. However, in average
the models give no significant change in the NAO during the next 100 years. We should not
put too much confidence into this result, as the present day climate models are not able to
capture the observed trend in the NAO. There may be several reasons for this, among the
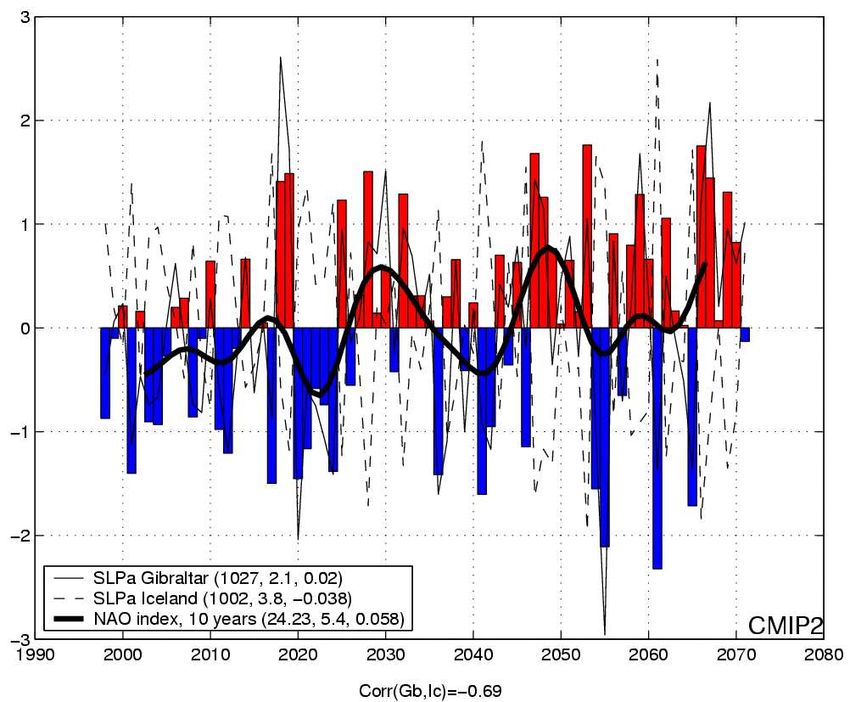
most cited are too coarse resolution in the ocean models (especially in the tropics), too low
vertical resolution in the stratosphere, or simply that the observed low frequency variability
and trend in the NAO is an accumulated result of high frequency noise (weather). While the
two first two problems may be solved with better computer resources, the latter point gives
bad prosperities, as in that case the NAO and a significant part of the development in
atmospheric and oceanic climate in our region cannot be predicted.

In a recently finished CMIP2 integration with the Bergen Climate Model (BCM), there is a
trend in the NAO during the 75 years of integration, representing and increase in the
westerlies of approximately 2 percent/decade. There is also a weak tendency to become more
variability in the winter NAO, a feature that has been seen in observations during the last 50
years (Figure 5).

To summarize, it is probably that the low frequency variability in the westerlies (NAO) may
be linked to the global warming, either as a direct feedback from the tropics, as a result of
stratospheric cooling, or as a combination of both. If that is the case, the possibility for a
further strengthening of the westerlies is certainly realistic.

Figure 5: The NAO index in the BCM CMIP2 integration (left) and the NCEP data (right). The
bars show the unfiltered NAO index calculated using the grid points nearest to the positions
22ºW, 64ºN (Iceland) and 5ºW, 36ºN (Gibraltar). The thick line shows the 10 years low pass
filtered index, and the thin lines the normalized pressure anomalies at Iceland and Gibraltar.
Values in the legend box are means, standard deviations and trends in the unfiltered pressure
and pressure difference time series.

4. Water mass distribution and currents.

Observations
There has been a substantial change in the climate conditions in the Nordic Seas during the
period with reliable instrumental records. Here are some key observations: large salinity
anomalies, more polar water and eastward shift of the front between Atlantic Water (AW) and
Polar Water (PW), a reduction in the deep water formation in the Greenland Sea, a warming
of the deep waters and reversal of the deep currents in the Nordic Seas, and a reduction in the
Faroe Bank overflow.

Predictions
Due to the large thermal capacity of the water, the oceans will probably be less warmed than
the atmosphere. Estimates for the Nordic Seas by the Hadley Center model give a temperature
increase of the range 1-3ºC during the next 100 years, which is in agreement with other
models (e.g. Max Planck). However, due to lack of ocean data from the other models, and to a
common problem with the sea ice distribution in the models, it is difficult to use the models in
discussions of the development of the regional climate. We will therefore quote some
numbers from a newly finished 80 years CMIP2 integration (1 percent/year increase in the
CO2 concentration) with the Bergen Climate Model (BCM). The evolutions of the temperature
and salinity fields are shown in Figures 6 and 7.

BCM CMIP2
From the experiment with the BCM, we have looked at the model years 1) 20-28 (ca 2016-
24), 2) 50-58 (ca 2046-2054), and 3) 76-80 (ca 2072-2076), thus the three periods are
approximately the focus time periods in the ACIA framework. There are no significant
differences between summer and winter temperature changes, so only March values are
shown here.

sea surface temperatures (Figure 6)
From today and to 2020 there is a cooling of between 0 and -1ºC in most of the model area.
Largest drop in temperature is found along the marginal ice zone in the Barents Sea and off
the east Greenland coast, with maximum of more than 1ºC in the Denmark Strait. Some of
this cooling is probably associated with the weak westerlies in this period (see Figure 5). In
the central Nordic Seas there is a warming of 0.5ºC compared to the start state. In 2050 the
entire Nordic Seas has become warmer than the initial state, with the exception of a small spot
in the Denmark Strait. Largest warming is now found in the northeastern Barents Sea, in the
Baltic Sea, and to the south of Iceland. By the time of a doubling of the CO2 (2070), surface
temperatures in the Nordic Seas have increased by 1-2ºC, with highest values found in the
Baltic Sea, the North Sea and the Barents Sea. Minimum warming (less than 0.5ºC) is found
in the Denmark Strait.

sea surface salinities (Figure 7)
Salinity changes in the Nordic Seas are generally small, except for the areas influenced by
coastal runoff and melting of sea ice. By the year of 2020, there has been a freshening of
typically 0.1 to 0.3 psu in the Baltic Sea, southeast in the Barents Sea and in the Kara Sea, and
also a week freshening along the east Greenland coast. The freshening trend continues to the
2050s, with values in the Baltic Sea and north of Siberia in the range of 0.1 to 0.5 psu. There
is also a significant freshening in the Polar Ocean (0.3 to 0.5 psu), which is evidently advected
south with the East Greenland Current (EGC) into the Denmark Strait and East Icelandic
Current (EIC). In the AW regime the waters have become slightly more saltine, but still
without exceeding 0.1 psu. In the 2070s the model gives a 0.1 to 0.2 psu more saline water
south of the inflowing area, and less than 0.1 psu more saline AW in the Nordic Seas. In the
Baltic Sea, north of Siberia and in the Polar Ocean, salinities have decreased between 0.5 and
1 psu, and again the tongue of negative salinity change can be seen along the East Greenland
Coast.
Figure 6: Evolution of the temperature (SST) and sea-ice field in the BCM CMIP2
integration. Left column shows the March SST and sea ice distribution around the years 2020,
2050, and 2075, and right column changes from year 2000 to 2020, 2050 and 2075
respectively.

Currents (figure not shown)
From 2000 to 2020 there is a small (
Figure 7: Evolution of the salinity (SSS) and sea-ice field in the BCM CMIP2 integration. Left
column shows the March SSS and sea ice distribution around the years 2020, 2050, and 2075,
and right column changes from year 2000 to 2020, 2050 and 2075 respectively.

5. The sea ice thickness and distribution.

Observations
It has for a long time been a well-established fact that the strongest climate warming will be in
the Arctic, and in the Arctic region covered by thin ice. The Arctic basin has therefore been
looked upon as a “canary bird”, which should give an early warning about changes in the
climate. As a result, especially three papers which where published in the last month of the
previous century got much attention in the newspapers and televisions around the world.
There had been a 20 percent decrease in the summer extent of the Arctic sea ice the last 30
years (Johannessen et al, 1999, Science), the ice had thinned by 40% in the central Arctic the
last 30-40 years (Rothrock et al 1999, Geophysical Research Letter), and finally the
measurements fitted well with the results obtained by model simulations using climate models
forced by CO2 and aerosols (Vinnikov et al, 1999, Science). See left panel in Figure 8.
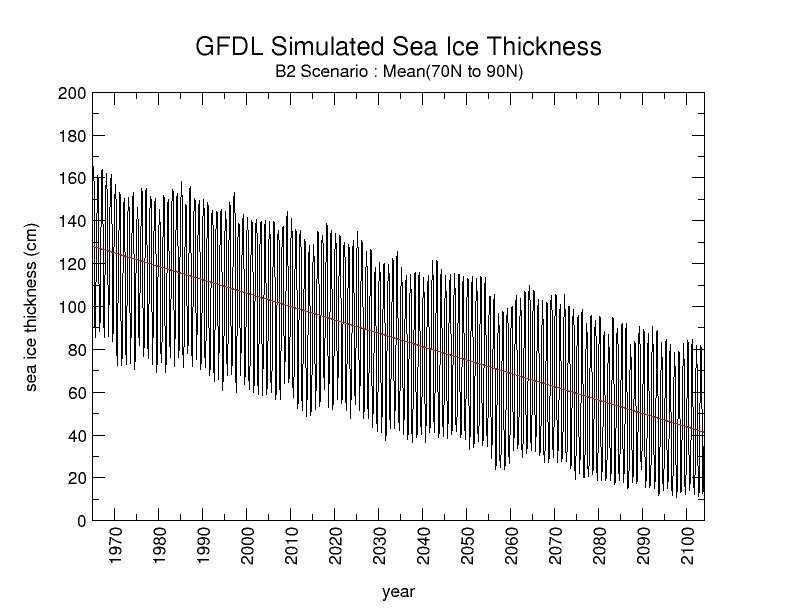
Figure 8: Left: Change in annual mean sea-ice extent for two different climate models with
CO2 and aerosols, compared to observations (Figure16-6 in IPCC TAR: Impacts, adaptation
and vulnerability). Right: Predicted decrease in the sea ice volume in the Arctic from two
different climate models (ACIA web pages, http://zubov.atmos.uiuc.edu/ACIA/).

Predictions
The decline in the ice cover seems to be a robust result obtained by many different climate
models. Some results are shown in the right hand panels in Figure 8. In the Canadian Center
climate model (CCC), Arctic becomes ice free during summer as early as in 2030, while for
the American model (GFDL), Arctic does not become ice free before after the turn of the next
century.

The change in ice cover between present day climate and the twenty years period around year
2055, is shown for four different models in Figure 9. Note that both the HadCM3 and CSM
models predicts a decrease in the ice cover in areas where we do not have ice today, thus
emphasizing the problems of using the climate scenarios to do regional climate studies. There
is also a large discrepancy in the simulated changes in the ice cover in the Arctic Ocean.
However, to a degree of certainty we can expect a large decrease in the sea ice cover in the
Nordic Seas – Arctic Ocean during this century, and most of the areas will be ice-free at least
during summer. Thus we may expect the marginal ice zone in the Barents Sea to gradually
retreat towards north and east, and the entire Barents Sea and Siberian Shelf will probably be
ice-free during summer already in a few decades.

Results from the CMIP2 experiment with the Bergen Climate Model, where the CO2
concentration was increased with 1 percent/year), showed that the winter maximum in the
Barents Sea will retreat with an average speed of 10 km/year, leaving the entire shelf area ice-
free by the year of 2070. Also much of the East Greenland Coast will be ice free in the second
half of this century. During most summers there is only ice present in the region north of
Greenland and Canada, and for some summers it is ice-free also here.
Figure 9: Change in annual mean sea-ice thickness between the periods 1971 to 1990 and
2041 to 2060 as simulated by four of the most recent coupled models. All models were run
with similar forcing scenarios: historical greenhouse gas and aerosol loading, then future
forcing as per the IS92a scenario. The color bar indicates thickness change in meters -
negative values indicate a decrease in future ice thickness (Figure 9.9 in IPCC TAR: The
Scientific Basis).

6. Deep water formation

Observations
Since the 1960s when there was an active and deep-reaching convection in the Greenland Sea,
there is evidence of a reduction in the deep-water formation in this area (Dickson et al, 1996,
progress in oceanography). In addition, measurements from the Faroe-Shetland overflow
indicate a reduction in the transport of dense water from the Nordic Seas toward the North
Atlantic (Hansen et al, 2001, Nature). It is uncertain to what extent this is influencing the
global thermohaline circulation, and the heat transport towards our latitudes.

Predictions
There have been many warnings about an abrupt stop in the thermohaline circulation, and a
possible rapid change towards a colder climate in the northern Europe, as a possible scenario
under global warming.
Figure 10: Simulated water-volume transport change of the Atlantic “conveyor belt”
(Atlantic overturning) in a range of global warming scenarios computed by different climate
research centers. Shown is the annual mean relative to the mean of the years (1961 to 1990)
(Unit: SV, 106 m3s-1). The past forcing is only due to greenhouse gases and aerosols (Figure
9.21 in IPCC TAR: The Scientific Basis).

These scenarios are all built on idealized experiments, or experiments with very coarse
resolution models, not necessarily simulating a realistic climate and physics. From Figure 10
it is seen that many of the models in IPCC simulate a reduction in the overturning in the North
Atlantic, but none of them an abrupt stop as many have warned about. In the German model,
ECHAM4/OPYC, there is no reduction at all. This is explained by better resolution in the
tropics, as more fresh water is transported from the tropical Atlantic to the Pacific, resulting of
advection of more salty water into the sinking regions in the northern parts of the Atlantic.

In the CMIP2 integration with the BCM no significant reduction in the overturning is found
(not shown). In the central Nordic Seas, there is a tendency for the mixed layer depth to
become shallower as a response to slightly less density in the area, indicating more shallow
convection here. There is a tendency for deeper mixing closer to the ice edge, as the mixed
layer depth increases in the Barents Sea and in the western and northern parts of the
Greenland Sea.

7. Summary

Due to large discrepancies between the different models, and the failures in many models to
simulate the sea ice extent in the Norwegian and in particular the Barents Seas, it is difficult
to give qualified guesses for the state of the Nordic Seas and Arctic region for the years 2020,
2050, and 2080. The spatial and temporal time scales are simply too small. While the overall
trends can be given with some sort of confidence, the presence of the possible unpredictable
North Atlantic Oscillation can for periods of several years mask the trends in the data sets.

In Table 1 we have given a summary of this note. While most results are objectively analyzed
based on many models, some of the specific values may be biased towards the scenario given
by the Bergen Climate Model. The reasons are the availability of the data, and the fact that the
BCM gives a more realistic ice cover in the Barents Sea, than most of the other models.

                         Observed
                 variability/change in the
                                                      2020                  2050                  2080
                Nordic Seas during the last
                         3 decades.
                   A warming trend in the
                                                 Ca 1ºC warmer.        Ca 2ºC warmer.        Ca 3ºC warmer.
Atmospheric      eastern part, cooling in the
                                                Spatial differences   Spatial differences   Spatial differences
temperature        western part, probably
                                                   due to NAO            due to NAO            due to NAO
                  associated with the NAO
                                               Ca 5% (?) more      Ca 10% (?) more       Ca 15% (?) more
                                            westerlies. Depends westerlies. Depends westerlies. Depends
Wind systems      Increased westerlies
                                              on the state of the on the state of the   on the state of the
                                                    NAO.                 NAO.                   NAO.
                                                                                          AW distributed
               Probably increased NAC.                             The Nordic Seas     more East. Possibly
               More narrow NWAC, and         Ca 5% weakening          Gyre further         a strengthened
   Ocean     possible increased flux to the of the Nordic Seas reduced. The inflow        transport to the
  currents       Barents Sea and Arctic     Gyre. Less inflow of of AW more in the Barents Sea, and a
              Ocean. Decreased flux out            AW (?)           eastern (Faroe-         reduced flow
                  through FS channel.                             Shetland) branch.      through the Fram
                                                                                                Strait.
              Increased influence of PW. The observed trends Ca 1ºC warmer and 1-2ºC warmer, most
             Warmer water in the NWAC.          will probably     0-0.1 psu saltier in in the Barents Sea.
Water mass
                More fresh intermediate      continue. Possibly    the AW domain.        More continental
distribution
             water. Warming of the deep cooling in negative Fresher water along runoff. More salty
                         water.                  NAO years.            the coast.            AW inflow.
                                                                                          Barents Sea and
                                            The observed trends The se- ice edge in
                                                                                        most of EGC ice-
                                                will probably       the Barents Sea
             Substantial reduction in both                                              free entire winter.
   Sea ice                                   continue. Possibly     moves towards
                the extent and thickness.                                               Most of the Arctic
                                            more ice in negative   northeast ca 100
                                                                                           Ocean ice free
                                                 NAO years.           km/decade.
                                                                                          during summer.
                 Less convection in the      Deeper mixed layer       Generally a
                                                                                       Deeper mixed layer
               Greenland Sea, and more      southwest of Iceland   shallower mixed
                                                                                        in the Barents Sea
Deep-water    convection in the Labrador      and in the central  layer depth in the
                                                                                       and western Nordic
   form.       Sea. The total overturning       Nordic Seas.          Nordic Seas,
                                                                                          Seas. Elsewhere
                has probably been fairly     Possibly related to indicating less deep
                                                                                           more shallow.
                        constant.                NAO state.          water formed.

Table 1: Summary of the results given in this report.
You can also read