Cell Membranes - Elsevier
←
→
Page content transcription
If your browser does not render page correctly, please read the page content below
Chapter 2
Cell Membranes

  © 2020 Elsevier Inc. All rights reserved.
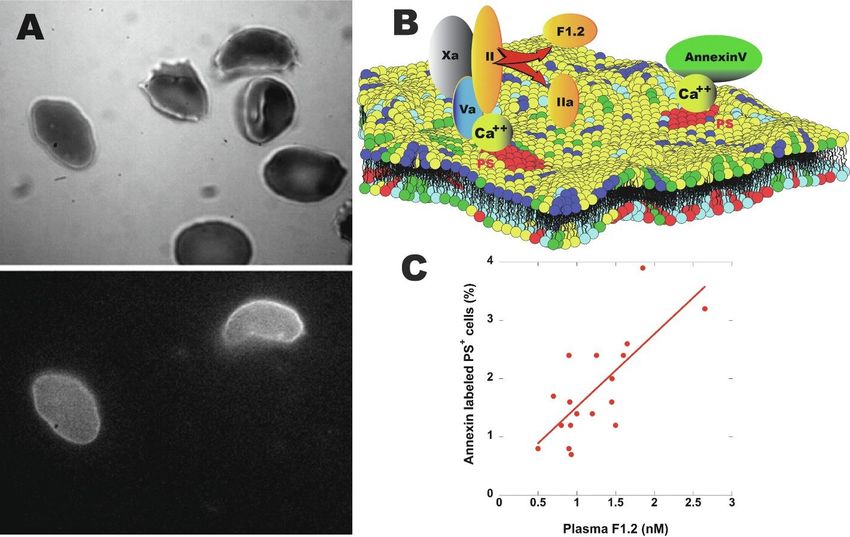
Figure 2–1 The hydrophobic effect drives rearrangement of lipids, including the formation of bilayers. The driving force of the
hydrophobic effect is the tendency of water molecules to maximize their hydrogen bonding between the oxygen and hydrogen atoms.
Phospholipids placed in water would potentially disrupt the hydrogen bonding of water clusters. This causes the phospholipids to bury
their nonpolar tails by forming micelles, bilayers, or monolayers. Which of the lipid structures is preferred depends on the lipids and the
environment. The shape of the molecules (size of the head group and characteristics of the side chains) can determine lipid structure. (A)
Molecules that have an overall inverted conical shape, such as detergent molecules, form structures with a positive curvature, such as
micelles. (B) Cylindrical-shaped lipid molecules such as some phospholipids preferentially form bilayer structures. (C) Biological
membranes combine a large variety of lipid molecular species. The combination of these structures determines the overall shape of the
bilayer, and a change in composition or distribution will lead to a change in shape of the bilayer. Similarly a change in shape needs to be
accommodated by a change in composition and organization of the lipid core.

                                                   © 2020 Elsevier Inc. All rights reserved.                                                  2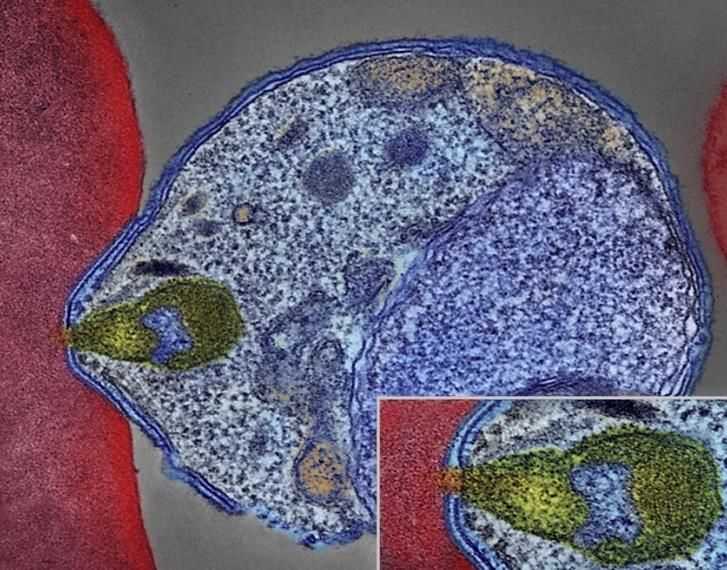
Figure 2–2 The principle of the fluid mosaic model of biological membranes as proposed by Singer and Nicolson. In this model, globular
integral membrane proteins are freely mobile within a sea of phospholipids and cholesterol.

                                                 © 2020 Elsevier Inc. All rights reserved.                                               3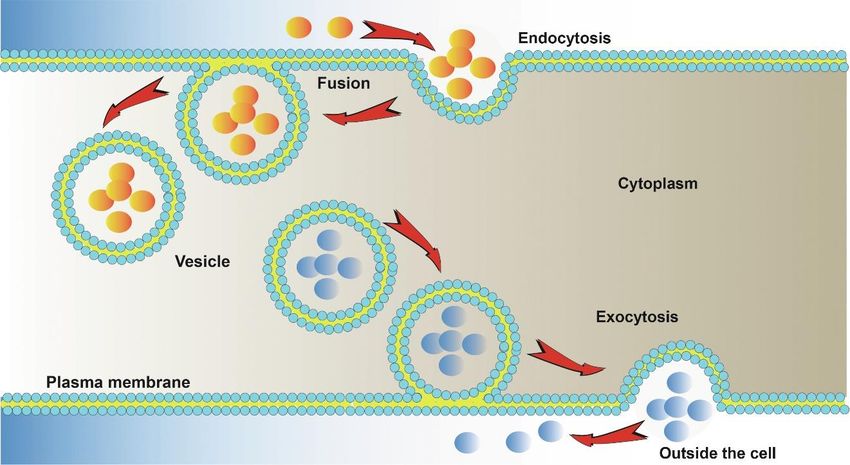
Figure 2–3 Structure of phospholipids. All phospholipids have a polar hydrophilic head group and nonpolar hydrophobic hydrocarbon
tails. Glycerophospholipids are characterized by their glycerol backbone. Long carbon chains connected to the first and second carbon of
glycerol provide the hydrophobic part of the molecule. The phosphate and additional head group structure provide the hydrophilic portion
of the molecule. In sphingomyelin the backbone is sphingosine. A long-chain fatty acid provides the second hydrophobic tail. Note that
both phosphatidylcholine and sphingomyelin have a choline-containing polar head group.

                                                 © 2020 Elsevier Inc. All rights reserved.                                                 4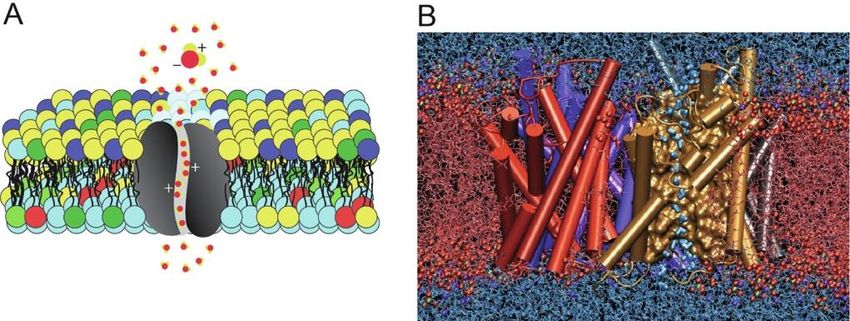
Figure 2–4 Structure of the glycerophospholipids. DPPC, dipalmitoylphosphatidylcholine; POPE, palmitoyl-oleoyl
phosphatidylethanolamine; and cholesterol.

                                                © 2020 Elsevier Inc. All rights reserved.                        5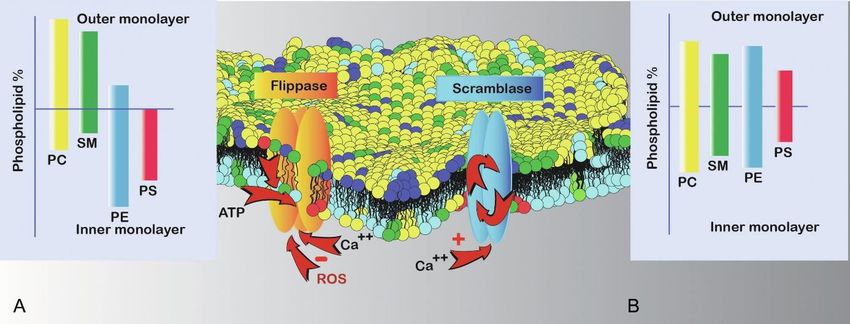
Figure 2–5 Endocytosis and exocytosis. Particles and other entities can be taken up by the cell by an active process called endocytosis.
The plasma membrane rearranges its lipids and encloses the particle to be taken up. As a last step the membrane fuses and closes.
Lipids in the membrane have to be remodeled to restore the lipid bilayer to its original composition. Examples are resorption processes in
the gut, or phagocytosis. Exocytosis is a similar process in the reverse direction. Examples are secretion of enzymes and hormones and
release of neurotransmitters.

                                                  © 2020 Elsevier Inc. All rights reserved.                                                  6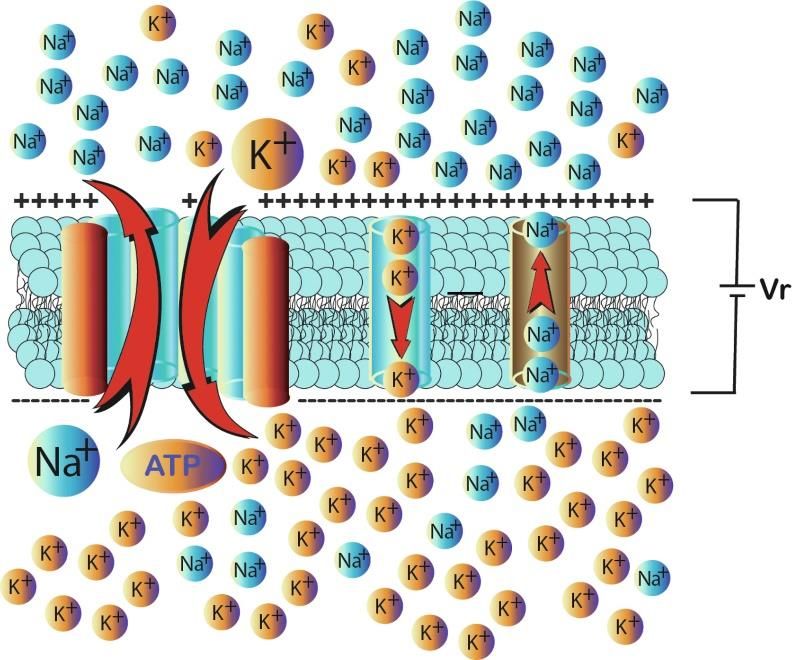
Figure 2–6 Repair of an oxidatively damaged phospholipid. Reactive oxygen species (ROS) oxidize unsaturated fatty acid in
phospholipids (PL). This changes the polarity of the fatty acyl chain and the phospholipid tilts toward the water phase. Phospholipase A2
recognizes this breach in the structure and hydrolyzes the phospholipid to lysophospholipid (LPL). FAs are activated to acyl coenzyme A
(FA-CoA) by acyl-CoA synthetase (ACSL) using ATP. FA-CoA and LPL are used by LPL acyl-CoA acyltransferase (LAT) to form
phospholipids, releasing CoA for the next cycle. Lipid-binding entities like acyl-CoA binding domain proteins (ACBD) modulate this
process.

                                                  © 2020 Elsevier Inc. All rights reserved.                                                 7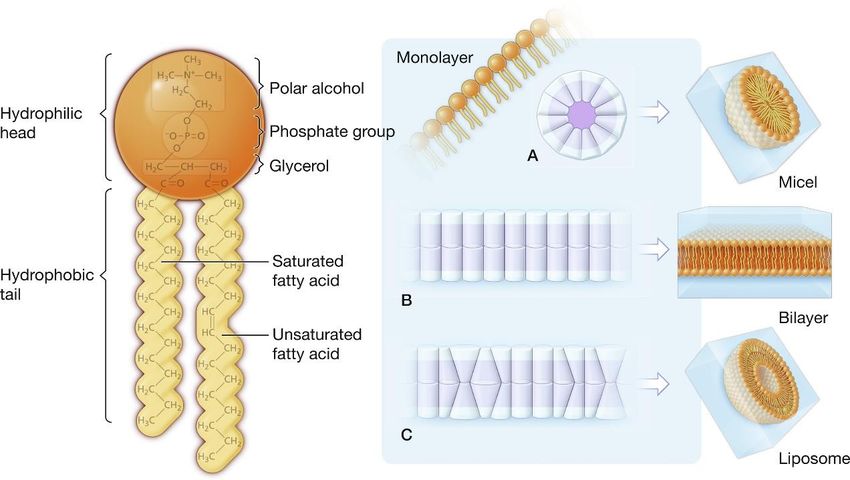
Figure 2–7 Phospholipases hydrolyze phospholipids. The ester bond hydrolyzed by phospholipases determines the nomenclature of
these enzymes. Phospholipase A2 (PLA2), phospholipase D (PLD), and phospholipase C (PLC) are shown.

                                               © 2020 Elsevier Inc. All rights reserved.                                        8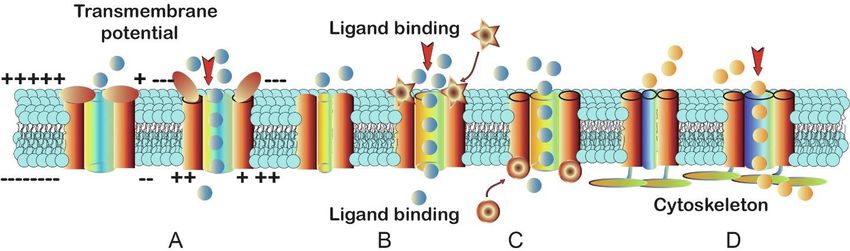
Figure 2–8 G protein-mediated signal transduction. A ligand binds to a G protein-coupled receptor (GPCR) in the membrane. This, in
turn, activates a phospholipase C, which hydrolyzes phosphatidylinositol biphosphate (PIP2) to form diacylglycerol (DAG) and inositol
triphosphate (IP3). IP3 acts to increase cytosolic calcium as part of a signal transduction cascade.

                                                  © 2020 Elsevier Inc. All rights reserved.                                             9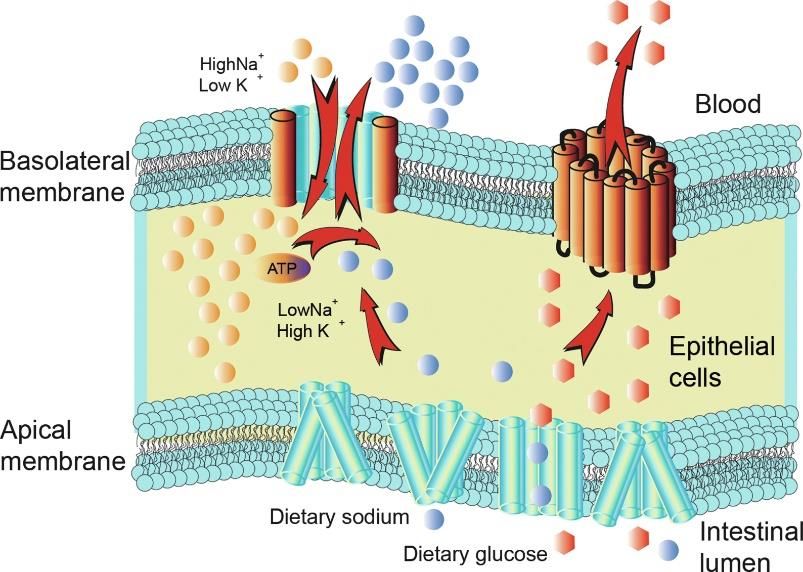
Figure 2–9 The motion of phospholipids within the lipid bilayer. (A) The fatty acyl tails undergo constant flexion as they interact with their
neighbors. (B) Phospholipids can rotate rapidly around a central axis. (C) They are able to move in the plane of the bilayer at very fast
rates. (D) Lipids are capable of transbilayer movement (flip-flop).

                                                    © 2020 Elsevier Inc. All rights reserved.                                                10
Figure 2–10 Red cell lipid turnover and lipoproteins. LCAT acts on phosphatidylcholine (PC) and cholesterol (C) in HDL to generate
cholesterol ester (CE) and lysophosphatidylcholine (LPC). LPC in the red cell is reacylated to PC by an ATP consuming process fueled
by RBC glycolysis (see Fig. 2–6). PC is transported back to HDL and is used for the next cycle to make cholesterol ester.
© 2020 Elsevier Inc. All rights reserved. 11Figure 2–11 The distribution of phospholipids in the human red cell membrane. (A) Normal distribution: The choline-containing
phospholipids, phosphatidylcholine (PC) and sphingomyelin (SM), are mainly found in the outer monolayer, whereas the amino
phospholipids are predominantly [phosphatidylethanolamine (PE)] or exclusively [phosphatidylserine (PS)] found in the inner monolayer.
(B) Scrambled distribution: Deactivation of the flippase and activation of a scrambling process will lead to the exposure of PS on the
surface of the cell.
© 2020 Elsevier Inc. All rights reserved. 12Figure 2–12 Integral and peripheral membrane proteins. Integral and peripheral membrane proteins can interact with the lipid bilayer in
many different ways. The following situations are presented: (A) a single-pass glycosylated integral membrane protein (note that a single
α-helical segment of the protein crosses the bilayer); (B) a multipass glycosylated integral membrane protein (this structure is found in
transporters and membrane channels); (C) membrane proteins can interact with membrane skeleton protein structures to stabilize the
membrane; (D) a peripheral membrane protein associated with the polar head groups of phospholipids by an ionic interaction; (E) a
membrane protein for which the protein itself does not enter the bilayer but instead is covalently linked to a fatty acid tail; and (F) a
membrane protein for which the protein itself does not enter the bilayer but instead is covalently linked by sugars to phosphatidylinositol.
© 2020 Elsevier Inc. All rights reserved. 13Figure 2–13 Hemoglobin S and membrane changes. Polymerization of sickle hemoglobin under low oxygen tension changes red cell
morphology, separates the lipid bilayer from the membrane skeleton, puts mechanical stress on the membrane, and results in the
shedding of PS-exposing microparticles. The unstable character of sickle hemoglobin increases oxidant stress, alters the metabolome
and proteome, changes the redox status of the cytosol, and damages membrane lipids and proteins. Oxidized lipids are repaired as
shown in Figure 2–11. Damage to the proteins involved in this repair system results in impaired repair, membrane viability is lost and the
sickle cell membrane takes a central role in adhesion, vaso occlusion, ischemia reperfusion, and inflammatory processes. The increase in
cytosolic calcium and oxidant stress leads to apoptotic plasma membrane processes including the loss of phospholipid asymmetry. PS
exposure results in recognition and removal of the sickle red blood cell, increased adhesion, imbalanced hemostasis, and hemolysis. All
these processes contribute to the vasculopathy that characterizes sickle cell disease.
© 2020 Elsevier Inc. All rights reserved. 14Figure 2–14 A colorized electron microscopic picture of a malaria parasite (right, blue) attaching to a human red blood cell. The inset
shows a detail of the attachment point at higher magnification, used by the parasite to penetrate the red cell membrane and find home
inside the cell to hide from the immune system.
© 2020 Elsevier Inc. All rights reserved. 15Figure 2–15 Image flow cytometry and sickling kinetics. (A) Red cells enter the flow cell in a single file. A high-resolution microscope
produces detailed bright-field, dark-field, and fluorescence imagery and intensity of each “event” in the flow cell. A typical flow cytometry
dot plot is shown. Pixel analysis algorithms such as “circularity” and “shape ratio” can be used to characterize the morphology of the red
cell. Each “dot” represents an image, and examples are shown. Events in sectors S1 and S2 show images of normal red cell shape.
Sectors S5 and S6 show highly distorted (sickled) cells. (B) Sickle blood exposed to 1% oxygen. At each time point, 10,000 events are
analyzed by image flow cytometry, and the percentage of abnormal shaped (sickled) cells is calculated. The curve fit provides a sigmoid
relation of morphology changes in time, which defines the sickling kinetics of sickle blood exposed to low oxygen.
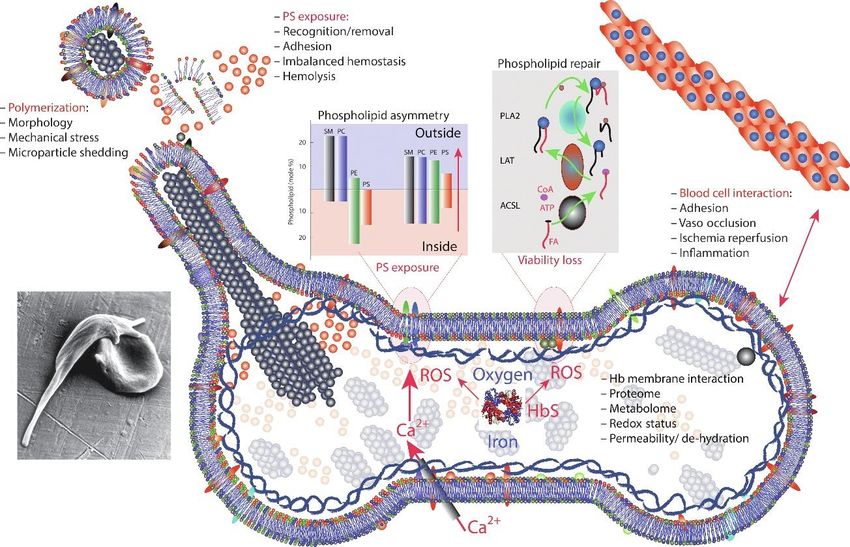
© 2020 Elsevier Inc. All rights reserved. 16Figure 2–16 (A) An example of sickle cells incubated with fluorescent annexin V. The top micrograph is in normal light; the bottom is in
fluorescence. Some cells bind fluorescently labeled annexin V, a protein that binds to phosphatidylserine (PS) on the surface of cells in
the presence of calcium. (B) Both the prothrombinase complexes of annexin V bind to PS on the surface of the cell in the presence of
calcium. (C) The percentage of red cells that expose PS, as measured by flow cytometry in relation to the level of fragment 1.2 (F1.2) in
the plasma of the patient. PS exposure on platelets is essential for the normal action of the hemostatic system as it provides a surface
where coagulation factors attach and prothrombin is cleaved to release thrombin and F1.2. PS-exposing RBC that are not quickly enough
removed lead to an imbalance in the normal pathways, and indeed, PS-exposing red cells are related to the prothrombotic state in these
patients.
© 2020 Elsevier Inc. All rights reserved. 17Figure 2–17 Examples of transport across a biological membrane. (A) Diffusion of small hydrophilic or hydrophobic particles driven by a
concentration gradient. (B) Diffusion of hydrophilic or charged particles driven by a voltage gradient. (C) Osmosis, diffusion of solute
driven by a concentration gradient of a nonpermeable compound. (D) Facilitated diffusion. (E) Active transport against a concentration
gradient. (B) Diffusion among the three compartments A, B, and C. At time zero, label is added to follow the diffusion between the
different compartments. In time the fraction of label will decrease in compartment A, as compared with start. Similarly the concentration in
the other two compartments will alter in time, defined by the rate constants (kab, kba, kbc, and kcb) that modulate to movement between
the compartments. Since kab > kbc, the label in pool B appears to increase and then decreases as label moves into pool C. Label moves
in both directions, and at equilibrium, no net flow occurs. The size of the compartments can be deducted from the concentration of label in
each at equilibrium, and the rates can be deducted from the time curves.
© 2020 Elsevier Inc. All rights reserved. 18Figure 2–18 The movement of water through a membrane, facilitated by the water channel aquaporin. (A) the water channel allows
water to move rapidly through the apolar region of the bilayer. (B) A more detailed depiction of aquaporin (www.ks.uiuc.edu/
Research/aquaporins).
© 2020 Elsevier Inc. All rights reserved. 19Figure 2–19 The red cell as an osmometer. When red cells are placed in a buffer of isotonicity (290 mOsm), they have their normal
volume. Water will leave the cell when the tonicity of their surrounding medium increases to hypertonicity, and the cell shrinks. A
decrease in tonicity toward hypotonicity will lead to the influx of water, and the cells swell. Their shape changes from the typical biconcave
shape to a sphere. The surface area of the membrane is limited, and the pressure inside the cell increases as more water enters the
cytosol to compensate for the lower tonicity. Cells in the population start to burst (hemolyze), and hemoglobin leaves the cell. The picture
on top shows samples after centrifugation. The supernatant contains more and more hemoglobin as osmolality decreases. At 150 mOsm,
approximately 50% of the cells have hemolyzed, a process that rapidly progresses to 100% at lower tonicity of the surrounding medium.
© 2020 Elsevier Inc. All rights reserved. 20Figure 2–20 The Donnan effect. A semipermeable membrane will allow the diffusion of Na+ and Cl− ions, but not the negatively charged
protein, in chamber A. Initially, there is an equal number of cations and anions in chambers A and B, which means that the Cl− is at much
greater concentration in B than in A to balance the anionic charge of the impermeable protein. With time, Cl− will flow down its
concentration gradient from B to A. To maintain electroneutrality, Na+ would also move from B to A. However, this would cause the
osmotic concentration to be greater in chamber A than in chamber B; therefore water moves from B to A.
© 2020 Elsevier Inc. All rights reserved. 21Figure 2–21. Glucose transport into red blood cells: facilitated diffusion. (A) A glucose transport protein (permease) for glucose. (B)
Glucose moves down its concentration gradient into red blood cells at a rate much faster than would be predicted by simple diffusion
through the lipid bilayer (black line). The plot for rate of glucose uptake versus external glucose concentration is hyperbolic (red line). The
rate increases with external glucose concentration until it reaches a maximal velocity (Vmax). The Km is the concentration of external
glucose at which half maximal velocity is reached.
© 2020 Elsevier Inc. All rights reserved. 22Figure 2–22. The Na/K-ATPase is an electrogenic pump. It moves three Na+ ions out of the cell and two K+ ions into the cytoplasm at
the expense of ATP hydrolysis to ADP and inorganic phosphate.
© 2020 Elsevier Inc. All rights reserved. 23Figure 2–23. Coupled transport. The transport of one molecule across a biological membrane can be coupled by the transport protein
to the movement of another molecule. If the movement of both molecules is in the same direction, the cotransport is referred to as
symport. If the molecules are being moved in opposite directions, the cotransport is referred to as antiport.
© 2020 Elsevier Inc. All rights reserved. 24Figure 2–24. Transport of glucose into and out of intestinal epithelial cells. Glucose enters from the intestinal lumen through the
apical membrane of the epithelial cells by a glucose Na+ symport transporter. The binding of one Na+ molecule and one glucose molecule
to separate sites on the extracellular domain of a glucose Na+ symport protein causes the transporter to change conformation. The
change of conformation creates a channel through which Na+ and glucose can be transported into the cytosol. The symport protein then
returns to its original conformation. The Na+ ions are pumped back out of the cell by Na/K-ATPase, located on the basolateral membrane.
Glucose then exits the cell by facilitated diffusion, by permeases located in the basolateral membrane.
© 2020 Elsevier Inc. All rights reserved. 25Figure 2–25. Structure of the helix and transmembrane channel formed by gramicidin A. Two gramicidin A peptides dimerize head
to head to span the lipid bilayer.
© 2020 Elsevier Inc. All rights reserved. 26Figure 2–26. A model of the acetylcholine receptor. (A) The pentameric configuration of the receptor is typical of many other
members of the ligand-gated ion channel family. Two of the subunits are identical, and three are different; each of the two α-subunits
contains an extracellular binding site for acetylcholine (ACh). (B) Three conformational states of the acetylcholine-gated ion channel. In
the absence of ACh, the gate is closed. ACh is released, and the binding of two acetylcholine molecules alters the protein conformation to
open the channel pore. However, the effect is only transient; the pore soon closes with acetylcholine still bound to the receptor sites.
Once the ligand dissociates from the receptor, the channel can return to a closed but receptive conformation, and ACh is rapidly degraded
by acetylcholinesterase (AChE), a GPI-anchored protein that can move very rapidly to scavenge its substrate.
© 2020 Elsevier Inc. All rights reserved. 27Figure 2–27. Classes of ion channels stimulated by different gating mechanisms. Ion channels are distinguished according to the
signal that opens them. (A) Voltage-gated channels require a deviation of the transmembrane potential. (B,C) Ligand-gated receptors
respond to the binding of a specific ligand, either an external neurotransmitter molecule or an internal mediator such as a nucleotide or
ion. (D) Mechanically gated channels can sense movement of the cell membrane linked by cytoskeletal filaments to the channel protein.
Each effector causes an allosteric change that opens the channel, thereby causing an ion flux across the membrane.
© 2020 Elsevier Inc. All rights reserved. 28Figure 2–28. The separation of charge across the cell membrane forms a membrane potential. (A) A net excess negative charge
inside the membrane and a matching net excess positive charge outside the membrane form a transmembrane potential difference that is
maintained across an impermeable lipid bilayer. Charge on either side of the membrane is concentrated in a thin layer (1 nm thick) and
formed by an extremely small percentage of the total ions in the cell. (B) Opposing forces regulate K+ flux across the plasma membrane.
Membrane potential is primarily based on four ion species: K+, Na+, Cl−, and organic anions (−), such as amino acids and other
metabolites. The resting membrane potential of a cell permeable only to K+ depends on the passive diffusion of K+ out of the cell down its
concentration. If left unchecked, K+ efflux would eventually create an excess negative charge in the cell (an overbalance of organic
anions) and a buildup of [K+]o, were it not for an electrical driving force moving K+ in the opposite direction. An equilibrium results when
these two opposing forces counterbalance each other.
© 2020 Elsevier Inc. All rights reserved. 29Figure 2–29. Passive and active fluxes maintain the resting membrane potential. The cell at rest maintains a steady state whereby
Na+ influx and K+ efflux defined by passive diffusion are balanced by active transport of these ions in the opposite direction by Na/K-
ATPase.
© 2020 Elsevier Inc. All rights reserved. 30Figure 2–30. Prototypical neuron. Incoming local potentials from dendrites converge at the cell body and reach the axon at its origin.
The action potential, typically triggered at a region known as the axonal hillock, is propagated down the length of the axon, where it will
initiate a chain of events leading to neurosecretion from the terminal branches.
© 2020 Elsevier Inc. All rights reserved. 31Figure 2–31. Three conformation states of the voltage-gated Na+ channel. (A) In response to a brief pulse of current, depolarization
of a mammalian neuron to a threshold of about 50 mV (red curve) triggers the opening of the voltage-gated Na+ channel by opening an
activation gate formed by the channel protein lining. (B) Ions flow, and the membrane potential increases (red curve). The open state is
metastable and is inactivated rapidly by a separate inactivation-gating mechanism provided by the cytosolic portion of the channel protein.
(C) After reaching a maximum of 50 mV, the membrane potential declines to its resting state because Na+ channels inactivate, and the
efflux of K+ ions through nongated leak channels continues unabated. Another action potential is not possible until the Na+ channels have
returned to the closed but activatable state. In the absence of voltage-gated Na+ channels, the modest depolarization evoked by the
current stimulus would have immediately begun to decay (green curve).
© 2020 Elsevier Inc. All rights reserved. 32You can also read