WIND IN COMPLEX TERRAIN. A COMPARISON OF WASP AND TWO CFD-MODELS.

Page created by Ana Romero
 
CONTINUE READING
WIND IN COMPLEX TERRAIN. A COMPARISON OF WASP AND TWO CFD-MODELS.
Wind in complex terrain.
                    A comparison of WAsP and two CFD-models.

Erik Berge                Arne R. Gravdahl    Jan Schelling             Lars Tallhaug                 Ove Undheim
Kjeller Vindteknikk AS    Vector AS            Hydro Oil & Energy       Kjeller Vindteknikk AS        Institutt for energiteknikk*
erik.berge@vindteknikk.no gravdahl@vector.no jan.schelling@hydro.com lars.tallhaug@vindteknikk.no ove.undheim@vindteknikk.no

*Presently at Kjeller Vindteknikk AS

Abstract:                                                                models develop a steady-state time-independent
                                                                         solution for the wind and turbulence fields. Thus, a
WAsP and the two CFD-models WindSim and                                  physically more realistic picture of the flow field can
3DWind have been compared at a complex terrain                           be obtained compared to WAsP. Examples of such
site in western Norway for the two dominating wind                       models applied to Norwegian wind resource
directions south and north. One year of measurements                     assessment are WindSim [4] and 3DWind [5]. Still,
from two 50 m masts and one 10m mast were                                these CFD-models avoid the inclusion of the energy
available. The paper analyses the mean absolute                          equation, thus stratified flow cannot be realistically
error, the vertical variations of wind speed and                         handled. Also, the assumption of a steady state
turbulence with height, and meso-scale wind                              turbulent field may be doubtful since the turbulence
variations across the wind farm. Despite the                             actually often is very intermittent and transient.
simplicity and known weaknesses of WAsP in                                   Nested      models      that    handle     real-time
complex terrain, no improvements of the average                          meteorological data from the synoptic scale down to
wind speed calculations were obtained by use of the                      the micro-scale, including buoyancy effects on the
CFD-models. Meso-scale wind variations of the order                      micro-scale flow, have also been developed and tested
2-3 m/s during a particular weather situation were                       [6]. Such models still require weeks of computational
encountered for a case study by use of a meso-scale                      efforts on today’s most powerful computers [6], in
model.                                                                   order to generate a wind resource map for a wind
                                                                         farm. Thus the temporal and economical costs of such
Keywords: Complex terrain, WAsP, CFD-models.                             models may still be too high for practical
                                                                         applications.
                                                                             In complex terrain, meso-scale wind variations
                                                                         within a wind farm area may as well be anticipated
1 Introduction                                                           (spatial scales of 2 km to 200 km). Meso-scale
                                                                         models, that solve the coupled equations of dynamical
Large wind energy developments are at the planning                       and thermo-dynamical processes in the atmosphere,
stage in Norway. Many of the planned wind farms                          may be needed together with the micro-scale models
will be located in rather complex coastal sites where                    to achieve a complete resource analysis. Examples
wind resource assessment is difficult.                                   on such models are the WRF-model [7], the MC2-
    Wind models are potentially important at complex                     model [8] and the RAMS-model [9].
terrain sites in the wind resource assessment since                          The aim of the present study has been to validate
measurements can only be afforded at selected                            the two CFD-models WindSim and 3DWind and to
positions, and the wind variations may be large over                     compare with the WAsP model at a complex terrain
short distances.                                                         site in Norway. In addition, examples on meso-scale
    For micro-scale flow (spatial scales of 1 m to 2                     wind variations based on the WRF-model are given.
km), the WAsP model [1] is most commonly used in                         One year of measurements from one 10 m and two 50
the wind resource analysis, but in areas with flow                       m measuring masts have been made available from a
separation the model is not very well suited for                         Hydro Oil & Energy site in western Norway. Both
resource assessment. However, simple terrain                             average mean wind and turbulence conditions have
corrections (so called RIX-analysis see [2]) have been                   been analyzed. An important issue has been to
applied with success to the WAsP simulation for quite                    determine whether or not the CFD-models could
complicated terrain [2,3].                                               improve the confidence in the wind map at the
    CFD-models are also utilized in micro-scale wind                     complex terrain site.
resource assessment. Most commonly, the CFD-
WIND IN COMPLEX TERRAIN. A COMPARISON OF WASP AND TWO CFD-MODELS.
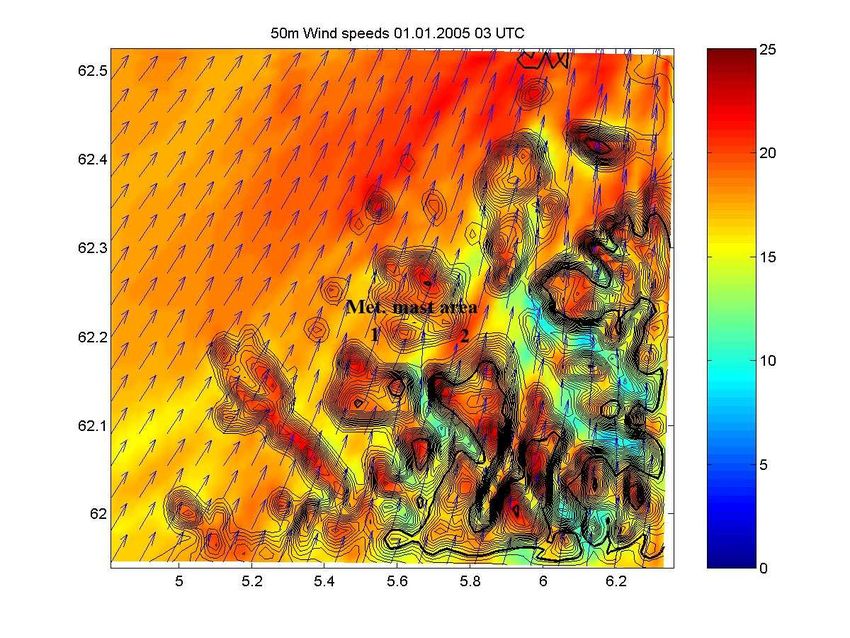
2 Measuring program                                      mast, while 50 m steel tube masts where employed at
                                                         sites 2 and 3.
                                                             The wind speed measurements were collected with
2.1     The Gurskøy region
                                                         the NRG Maximum #40 anemometer. Comparison
Hydro Oil & Energy initiated in 2000 a field             with RISØ wind speed sensors have shown that the
measuring campaign at Gurskøy in western Norway.         NRG sensor underestimates the wind speed for wind
The area is located about 25 km east of Stadt, one of    speeds lower than 2 m/s. For an annual average wind
the windiest regions in Norway. The Gurskøy island       speed in the range 7-9 m/s the underestimation will
has a complicated local terrain structure with           be about 0.04 m/s, i.e. much less than the overall
mountaintops of about 600 m with steep edges down        uncertainty of the measurements, including the
to local valleys and fjords (see Figure 1).              uncertainties of long-term variability of the wind, of
Considerable local flow separation is expected in this   about 5% (see [3]).
type of terrain. From the sectors W to N open ocean          The wind rose at site 1 is presented in Figure 2.
flow modified by the local terrain may be expected.      We note the dominance of winds from S and SW and
Toward S and E high mountains of 800-1500 m are          N and NE.
encountered at distances of approximately 15 km or           The sites 1 and 2 are situated on an east-west
more, with associated meso-scale wind effects.           ridge with considerable speed-up for both southerly
                                                         and northerly flow. The hillside to the south stretches
2.2     Description of the measuring sites               all the way down to the fjord, while a mountain rises
The measurements were collected from april 2002 to       to about 400 m further to the south. Turbulence could
may 2003 for the sites 1 (z=424 m), 2 (z=390 m) and      be expected at all three sites north of this mountain
3 (z=352 m) (see Figure 1). At site 1, the               for the dominating southerly flow. At site 1 there is
measurements were carried out with a 10 m steel tube     some sheltering toward W and NW, but this is a wind
WIND IN COMPLEX TERRAIN. A COMPARISON OF WASP AND TWO CFD-MODELS.
Figure 1: Location of the three measuring sites 1, 2 and 3 at the Gurskøy island. Height contours are for every 20
                                                         m.

                                                                                               Turbulent scheme          k-ε            k-ε
direction with low frequency. Site 2 is partly sheltered                                      Table 1: Set-up of WindSim and 3Dwind for the
for the direction NE. Site 3 is located in a SW to NE                                         simulation.
oriented hillside. Speed-up for SW flow can be
expected at this site. The wind rose is consistent with                                       The details of the model set-up for the two CFD-
observations from other stations in this region.                                              models are compared in Table 1.
                                                                                                  Although an as similar set-up as possible has been
                       Expected Long−Term Wind Rose at 304                                    the intention, inevitably some differences are found.
                       330
                                       0

                                                       30
                                                                                25 −>
                                                                                20 − 25
                                                                                15 − 20
                                                                                                  Both WindSim (for a documentation of WindSim
                                                                                10 − 15
                                                                                 5 − 10       see http://windsim.com) and 3DWind [5], [10] are
                                                                                 0− 5

                 300                                                60                        wind flow solvers based on the 3D Reynolds
                                                                                              Averaged Navier-Stokes equations. The models solve
                                                0.05 0.1
                                                             0.15 0.2
                                                                         0.25
                                                                                              the atmospheric flow for a “steady-state” case for a
           270                                                           90
                                                                                              chosen wind direction. By “steady-state” it is meant
                                                                                              that the model is run until the solution converges to
                 240                                               120                        one wind and turbulence distribution for the entire
                                                                                              domain that do not vary outside a pre-set convergence
                       210                            150
                                                                                              limit. By simulating for several different wind
                                      180
                                                                                              directions (sectors) an annual average wind speed can
                                                                                              be generated. The models are run for a given set of
Figure 2: Wind rose at site 1.                                                                constructed boundary and initial conditions. The k-ε
                                                                                              turbulence closure scheme is applied in both models.
3 Micro-scale model set-up                                                                        An important advantage of a CFD-model
                                                                                              compared to WAsP is that the CFD-model calculates
                                                                                              the turbulent quantities of the flow, and thus gives
3.1 WAsP                                                                                      information about high turbulence areas that should
WAsP version 8.1 was employed in this study. Height                                           be omitted for wind power exploitation. Also, the
contours for each 5 m were available for an area of                                           direct effects of turbulence on the mean flow are
about 3km*3km covering the met mast. Outside this                                             calculated. Especially in complex terrain, where a
area 20 m height contours were used. A background                                             complicated turbulence structure is encountered,
roughness of 0.03 m describing the bare mountain                                              benefits of a CFD-model are expected. However, any
areas, was applied. Higher roughness values were                                              turbulence modeling will inevitable introduce new
applied to forests and small towns.                                                           parameterization assumptions and constants, which
                                                                                              also introduces uncertainty in the modeling (see for
3.2 The CFD-models                                                                            example [11]). Considerable uncertainty is therefore
                                                                                              linked to the quantification of the turbulence and its
                                           WindSim                               3DWind       effects on the mean flow.
 Size of model domain                      20*20                                 17*14            Most CFD-models assume a neutral stratification
 (km2)                                                                                        of the atmosphere. For strong winds this is often a
 Total number of cells                     144*111*20                            142*160*4
                                                                                              good approximation. But even for wind speeds up to
                                                                                 8
                                                                                              10-15 m/s stable stratification has been observed, at
 Size of model domain                      3*2                                   1.44*2.22
 with 30m resolution
                                                                                              least in the coastal areas in central Norway [12].
 (km2)                                                                                        Vertical wind shears, turbulent fields etc. may
 Number of cells with                      100*67                                48*74        develop quite differently during stable (or unstable)
 30m resolution                                                                               conditions [12]. Thus, a limitation in the CFD-
 Height (m) of the lowest                  6, 20, 36, 57                         7, 15, 24,   approach is encountered here. Another limiting factor
 layers                                                                          33, 44       is the finite number of directions applied in the
 Number of layers in the                   20                                    48           derivation of the annual average wind speed. Since
 vertical                                                                                     the long-term wind speed is composed of wind flows
 Height (m) of the model                   2500                                  5000         from all different directions (though with some
 Boundary conditions (see                                                                     predominant directions), a sample of for example 12
 text for explanation)                                                                        sectors may be too small to represent an annual
 Coriolis force                            No                                    Yes          average properly.
A further comparison of the output of the model
                                                            simulations with the observations has been carried out. The
4 Results                                                   three models are all scaled to fit the observations at 50 m
                                                            height at either site 2 or site 3.
The CFD-models are initialized based on assumptions            Based on the scaled values of each of the two sites,
about higher level (~500m) and lateral boundary level       the annual average wind speed is estimated at the
wind speed and profiles. A logarithmic wind profile         other levels of the same mast (10m and 30m) and
(corresponding to neutral stability conditions) is
employed at the boundaries in both models. Thus, in
                                                                                                 Site 2 - S (scaled at site 3 50m)
order to compare the output of the CFD-models with
any measurements, the modeled wind speed fields                                     60
have to be scaled by use of the measurements. For                                   50
example, for a specific annual wind speed from sector
                                                                                    40

                                                                       Height (m)
                                                                                                                                                             OBS
S at 50 m at one of the sites, the output of the CFD-                                                                                                        WASP
                                                                                    30
model will be assumed equal to the measurement at                                                                                                            WINDSIM
this site. It is then further assumed that the wind field                           20                                                                       3DWind

can be scaled linearly based on the scaling at this                                 10
particular site. By employing this method model                                     0
simulations of the wind speed at all the measuring                                   0.00       0.50             1.00          1.50          2.00

sites can be obtained. Thus it is assumed that the ratio                                               Scaled windspeed

of the modeled and measured values at one site will
apply to the whole modeling domain. This                                                         Site 2 - N (scaled at site 3 50m)
assumption may not be valid everywhere in the
                                                                                    60
modeling domain, but it is quite commonly applied to
                                                                                    50
modeling. In the following section we assess the
model simulations by using this method. The CFD-                                    40
                                                                       Height (m)

                                                                                                                                                             OBS
                                                                                                                                                             WASP
models are scaled to yield correct wind speed at the                                30
                                                                                                                                                             WINDSIM
50 m level at Site 2 and Site 3 respectively, then the                              20                                                                       3DWind
results at the other measuring sites are extracted from                             10
the CFD-models.
                                                                                    0
    The WAsP model work differently. In order to                                     0.00       0.50             1.00          1.50          2.00
make the results from WAsP comparable to the CFD-                                                      Scaled windspeed
models, the measurements at 50 m from Site 2 and
Site 3 are inserted in the model and the wind speed of      Figure 3. Scaled vertical profiles at Site 2 for sector S
the other measuring mast are obtained for the same          (upper panel) and sector N (lower panel).
sectors as utilized by the CFD-models.
    Note that the CFD-models were run only for the                                                              Obs vs model Sector S

two sectors north (N) and south (S) to save                             2.00

                                                                        1.80

computational efforts. Each sector covers 30°                           1.60

centered around 360° and 180° respectively.                             1.40

According to the wind rose (see Figure 2), the
                                                            Modelled

                                                                        1.20

directions N and S represent ca. 13% and 18% of the                     1.00

                                                                        0.80
wind data respectively.                                                 0.60

                                                                        0.40

4.1      Annual average wind speed                                      0.20

                                                                        0.00
                                                                            0.00         0.20   0.40     0.60       0.80      1.00    1.20     1.40   1.60    1.80   2.00

In Figure 3 the vertical profiles at site 2 have been                                                                      Observed
                                                                                                            Wasp           WINDSIM     3DWind
obtained based on a “true” solution at 50 m height at
site 3. For the southerly sector the wind direction is
nearly perpendicular to the steep slope to the south of
site 2 and a strong speed-up is encountered. Both
WindSim and WAsP yield only small differences
from the observations, while 3DWind yields a large
overestimation of the wind speed. For the northerly
sector, the wind speed actually decreases from 10 m
to 50 m at site 2. All three models underestimate the
wind speed for this sector, still WAsP yields the best
results in this particular case.
Obs vs model Sector N                                      results underline that a RIX-correction should always
            2.00                                                                                        be supported by empirical data, and a generalization
            1.80
                                                                                                        of the method from one area to another is not
            1.60
                                                                                                        recommended.
            1.40
 Modelled

            1.20

            1.00                                                                                        4.2                 Turbulence and the directional
            0.80

            0.60
                                                                                                                            dependence
            0.40
                                                                                                        In Figure 5 the turbulence intensities at site 3 is
            0.20

            0.00
                                                                                                        presented. While 3DWind overestimates the
               0.00   0.20   0.40     0.60       0.80   1.00
                                                     Observed
                                                               1.20    1.40    1.60    1.80     2.00
                                                                                                        turbulence for sector S WindSim gives too low values.
                                      Wasp         WINDSIM    3DWind                                    For sector N both models are closer to the
                                                                                                        observations, but still 3DWind over predicts while
Figure 4. Observed vs. modelled annual normalized                                                       WindSim under predicts. The same pattern is
wind speed for sector S (upper panel) and sector N                                                      encountered for site 2 (not shown), and in other
(lower panel).                                                                                          similar model experiments using 3DWind. Our
                                                                                                        conclusion from these investigations is that the over
at the three measuring levels of the other 50m mast                                                     prediction of the turbulence in 3DWind at site 3 most
and finally at 10 m at site 1. The results are                                                          probable is linked to an underestimation of the
summarized in Figure 4 and Table 2. The total                                                           average wind speed at the same site. This also leads
number of data points                                                                                   to the overestimation of the predicted average wind
                                                                                                        speed level of 3DWind at site 2 based on the wind
                      WAsP          Wind-           3D-        WAsP            Wind-          3D-Wind   field scale to site 3 (upper panel of Figure 3). In
                         S          Sim S         Wind S          N           Sim N              N
   MAE                0.11          0.10          0.28         0.14           0.24            0.24      Figure 6 the turbulence pattern derived from 3DWind
   COR                0.88          0.84          0.74         0.89           0.58            0.79      is presented for the wind directions 180° and 190°.
                                                                                                        Separated flow and strong turbulence is developed on
Table 2: Mean Absolute Error (MAE) and correlation                                                      the lee side of the mountain to the south of the ridge
coefficient (COR) of ratios between models and                                                          where the three meteorological masts are located. At
measurement. Each statistical parameter is based on                                                     both sites 2 and 3 it is likely that the turbulence
12 data values.                                                                                         intensities could be rather sensitive to the exact wind
                                                                                                        direction.
to be verified are 12, thus any statistical analysis has                                                    From Figure 7 it is also noted that the annual
to be interpreted with care since the data points are                                                   average wind speed varies largely for different wind
few. For the sector S, WAsP and WindSim show                                                            speed directions. The variability at site 2 for the
similar behavior, while the errors are somewhat                                                         direction 170°, 180° and 190° is quite well captured
larger for 3DWind. For sector N, WAsP gives                                                             by 3DWind. It is also observed that the outcome of
somewhat surprisingly the best correspondence, while                                                                                    Site 3 sector S
WindSim has the lowest correlation. Based on the                                                                       60
results of Figure 3 and 4 and Table 2 we conclude                                                                      50
                                                                                                          Height (m)

that the errors are as large (and actually a little                                                                    40
larger) for the CFD-models compared to WAsP for                                                                        30
the two sectors analyzed. This is an important                                                                         20
finding, although we lack insight into the reasons                                                                     10

why the CDF-models are unable to improve the                                                                            0
                                                                                                                            0   0.05     0.1      0.15    0.2      0.25   0.3
simulations at Gurskøy. In the following sections we
present a discussion aiming to give a better                                                                                           Turbulence intensity
understanding of the modeling results.                                                                                           Obs           WindSIM          3DWind
    A RIX-analysis was carried out for the three sites
to check if the WAsP results could be improved. The
RIX-values using a radius of 2 km were 24.2%, 20%
and 17.2% for the site 1, site 2 and site 3 respectively.
In contrast to [3] no relationship between the
differences in RIX-values and the prediction error
was found. For example, employing the 10 m
measurements at site 1 gave an over prediction of the
wind speed at site 2 and 3, while an under prediction
could be expected from the RIX-analysis. These
Wind speed during the period April 2002 to May 2003
                                                                                               Site 3 sector N
                                                                                                                                                                               1.80
                   60                                                                                                                                                                         Site 1
                                                                                                                                                                                              Site 2
                                                                                                                                                                               1.60           Site 3
  Height(m)        50                                                                                                                                                                         3DWind at Site 2
                                                                                                                                                                               1.40
                   40
                                                                                                                                                                               1.20
                   30
                                                                                                                                                                               1.00
                   20
                                                                                                                                                                               0.80
                   10
                                                                                                                                                                               0.60
                                                  0
                                                          0                 0.05               0.1                      0.15            0.2                 0.25         0.3   0.40

                                                                                          Turbulence intensity                                                                 0.20

                                                                                                                                                                               0.00

                                                                            Obs                         WindSIM                               3DWind                                  0   3         6       9      12     15      18       21     24     27      30   33   36

                                                                                                                                                                                                                               Direction

Figure 5: Observed vs. modeled turbulence intensity                                                                                                                            Figure 7: Wind speed as a function direction scaled
at Site 3.                                                                                                                                                                     by the annual average wind speed at 50 m at site 2.

the CFD-model is largely dependent on the selection                                                                                                                            fields of the two models have been scaled in order to
of sectors. In the present case with complex terrain 12                                                                                                                        minimize the differences between the two models.
sectors yield inevitable to course resolution. Ideally at                                                                                                                      Note that during the scaling linearity is assumed,
least 36 sectors should be utilized, which on the other                                                                                                                        although this may not strictly be the case. From the
hand increase the computational demands.                                                                                                                                       figure we see quite much higher wind speeds in
                                                                                                                                                                               WindSim than in 3DWind especially in the turbulent
5. Comparison of the CFD model                                                                                                                                                 lee wakes. This is consistent with the findings in
                                                                                                                                                                               section 4.2 where a higher turbulent level is
data                                                                                                                                                                           encountered in 3DWind. This will reduce the
                                                                                                                                                                               horizontal wind speed, since a larger part of the
In Figure 8 the differences between WindSim and                                                                                                                                available kinetic energy of the flow is consumed by
3DWind for southerly flow are presented. The wind                                                                                                                              turbulent processes. Although the two models employ
                                                                                                                                                                               the same turbulent scheme we encounter a large
                                                               6
                                                          x 10                                Turbulence Intensity []

                                                  6.909

                                                  6.908
                                                                                                                                                                   1
                                                                                                                                                                               difference in the resulting wind field and turbulence
                                                                                                                                                                   0.9

                                                  6.907
                                                                                                                                                                   0.8
              Northing [UTM EUREF89 sone 32]

                                                  6.906                                                                                                            0.7
                                                                                    Haugshornet
                                                                                            Litlabø
                                                                                                  hornet
                                                                                                                                                                   0.6
                                                  6.905                                                    Hornelva

                                                                                                                                                                   0.5
                                                  6.904

                                                                                                                                                                   0.4

                                                  6.903
                                                                                                                                                                   0.3

                                                  6.902                                                                                                            0.2

                                                                                                                                                                   0.1
                                                  6.901

                                                              3.2    3.21    3.22     3.23      3.24    3.25     3.26          3.27   3.28    3.29
                                                                                        Easting [UTM EUREF89 sone 32]                                   5
                                                                                                                                                 x 10

                                                                 6
                                                          x 10                                Turbulence Intensity []

                                                  6.909

                                                                                                                                                                   1

                                                  6.908
                                                                                                                                                                   0.9

                                                  6.907
                                                                                                                                                                   0.8
                 Northing [UTM EUREF89 sone 32]

                                                  6.906                                                                                                            0.7
                                                                                    Haugshornet
                                                                                            Litlabø
                                                                                                  hornet
                                                                                                                                                                   0.6
                                                                                                                                                                               Figure 8: WindSim – 3DWind at 50 m for sector S.
                                                  6.905                                                    Hornelva

                                                                                                                                                                   0.5
                                                  6.904

                                                                                                                                                                   0.4         field. This emphasizes the importance of the turbulent
                                                  6.903
                                                                                                                                                                   0.3         processes in rough terrain and the complexity of a
                                                  6.902                                                                                                            0.2
                                                                                                                                                                               proper modeling of the turbulence.
                                                  6.901
                                                                                                                                                                   0.1
                                                                                                                                                                                   The frequency distribution of the wind speeds
                                                              3.2    3.21    3.22     3.23       3.24    3.25     3.26
                                                                                         Easting [UTM EUREF89 sone 32]
                                                                                                                               3.27   3.28    3.29
                                                                                                                                                 x 10
                                                                                                                                                        5
                                                                                                                                                                               covering the domain of Figure 8 is presented in
                                                                                                                                                                               Figure 9. The wind speed of each single grid-point at
Figure 6: Turbulence intensities for wind from 180°                                                                                                                            50 m in the modeling domain has been included in
(upper panel) and 190° (lower panel) based on                                                                                                                                  this distribution. The data are not scaled and thereby
3DWind model runs.                                                                                                                                                             not strictly comparable, still a good picture of the
                                                                                                                                                                               behavior of the two models is given. We immediately
                                                                                                                                                                               observe the much higher frequency of low wind
speeds in 3DWind compared to WindSim, which is            compared to the SW wind outside the coastline
consistent with the results of Figure 8 and the higher    (Figure 11). We encounter wind speeds varying from
turbulence level in 3DWind. WindSim also has a            about 15 m/s to above 20 m/s. Effects of the fjords
notable higher frequency of high wind speeds (above       and sheltering from the mountains to the south are
approximately 15 m/s). A comparison of the two            apparent.
models is also carried out for a potential wind farm          The vertical profiles from the SW and SE corner
area. The RMS differences of the two models in this       of Gurskøy (see Figure 12) show quite large
area become 1.54 m/s and 1.51 m/s for southerly and       differences in wind speed and temperatures from the
northerly sector respectively. For the total area of      western to the eastern side of the island. The wind
Figure 8 the corresponding numbers are 1.87 m/s and       speed at 100m varies with about 2-3 m/s while the
2.20 m/s. We can conclude that the differences are        temperature drops with about one degree. A statically
large also for a restricted wind farm area and large      stable layer is found below 100 m on the western side,
differences in energy production may be expected.         while a thicker stable layer is seen on the eastern side.
Based on the above results it is difficult to establish   We also observe that the wind shear is strongest for
any more confidence in the wind map generated from        the height intervals with highest vertical stability.
the CFD-models compared to the WAsP model.                Clearly, in a neutrally stratified atmosphere (no
                                                          change of potential temperature with height) less
                                                          vertical wind shear could be expected.
                                                          A second case with unstable cold northerly wind was
                                                          also examined. Smaller differences across the island
                                                          in both wind speed and temperature were encountered
                                                          in this case (not shown).

Figure 9: Frequency distribution of wind speeds from      7 Summary and conclusions
the area of Figure 8 for WindSim (left) and 3DWind
(right).                                                  The micro-scale models WAsP, WindSim and
                                                          3DWind have been compared and evaluated for a
                                                          complex terrain site in western Norway of Hydro Oil
6. Meso-scale simulations                                 & Energy. Previous analyses of the wind
                                                          measurements at this site had shown large deviations
Two meso-scale case studies were conducted by use of      between WAsP simulations and measurements (of the
the WRF-model (WRF-Weather Research and                   order of 1 m/s within 1 km horizontal distance). Thus
Forecasting, see http://www.wrf-model.org, [7] and        it was difficult to establish confidence in the wind
[13]). The model was set up for our region in the         map.
following way: Global meteorological data with 1
degree resolution were available from the National
Centers for Environmental Protection (NCEP) with 8
time-frames per day. The global data were
interpolated to a WRF-grid covering western Norway.
The WRF-model was further set up with terrain and
land-use data of a resolution down to approximately 1
km based on data accessible from the WRF-home
page. The set-up of the model domain for Gurskøy is
shown in Figure 10. The outer domain has 5 km
resolution employing a horizontal dimension of
80*80 and 31 layers in the vertical, while the inner
domain has 1 km horizontal resolution with the
corresponding grid-resolution of 80*65 and 31 layers
in the vertical. The domains are rather small in order
to save computational efforts, still we believe that
they are sufficiently large for illustrating the
variability of the meteorological parameters across the
island.
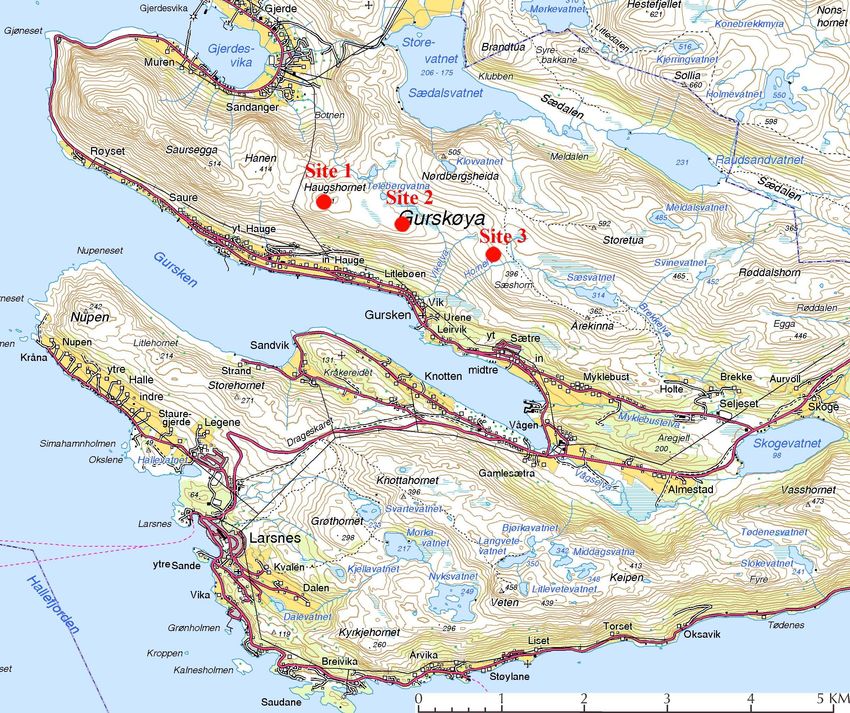
    The case presented is from 1 January 2005. A
strong SW flow dominates the wind pattern over
southern Norway and the adjacent seas. The wind
veers slightly more toward S over our area of interest
encountered moving from the western to the eastern
                                                          side of the island. A dependence of the vertical wind
                                                          profile on vertical stability is also found in the meso-
                                                          scale model simulations. One disadvantage of WAsP
                                                          and the two CFD-models is that meso-scale wind
                                                          variations are not taken into account in the modeling.
                                                          In particular, the effects of the vertical stability on
                                                          both the meso-scale and the micro-scale flow may be
                                                          anticipated to be important (see for example [8]), but
                                                          it is not accounted for in the micro-scale models. This
                                                          becomes a limitation of the three models when
                                                          applied to a complex terrain site such as Gurskøy.
                                                               An advantage of the CFD-models compared to
                                                          WAsP, is the explicit calculation of the turbulence
                                                          field. The comparison of the measured and modeled
                                                          turbulence      intensities shows that          3DWind
                                                          overestimates the turbulence while WindSim tends to
                                                          give too low values. The directional classification
                                                          uses 12 sectors of 30°. The model runs show that
                                                          large variation in the turbulence level may occur
                                                          within a 30° sector when the terrain is complex. Thus
                                                          smaller sectors should be employed, although this
                                                          increases the computational efforts of the CFD-
                                                          models. Through the analysis of the modeled
                                                          turbulence fields a better understanding of the
Figure 10: Outer domain (red) and inner domain            measurements at Gurskøy is obtained. For example,
(blue) of the meso-scale simulation.                      the 3DWind runs clearly indicate an influence of the
                                                          first mountain to the south on the turbulence level
    The present analysis shows that, despite the          (and consequently also the average wind speed level)
complex terrain, WAsP compares better than the            at the measuring sites. This mountain is of the same
CFD-models to the observations when results for the       height as sites 2 and 3 and located about 3 km to the
sectors south and north are considered. This              south.
conclusion is valid both for the vertical wind profiles        The results of this study emphasize the
and the annual average wind speed levels. The mean        importance of high quality measurements in complex
absolute error for sector south is 11%, 10% and 28%       terrain for a reliable wind resource mapping. Still,
for WAsP, WindSim and 3DWind respectively. For            both micro- and meso-scale models are important for
sector north the corresponding numbers are 14%,           the interpretation of the measurements and for an
24% and 24%. The RMS-differences in the wind              investigation of the turbulence and speed-up effects in
speeds between the two CFD-models have been               complex terrain. The data material of this report is
calculated for an area where wind energy exploitation     limited, and therefore further validations of the
is realistic. For both sector south and north an          micro- and meso-scale models in complex terrain are
average RMS-difference of about 1.5 m/s is found.         recommended. This is anticipated to give increased
    Meso-scale simulations with a complete                insight into the potential and limitations of the
meteorological model indicate large wind variations       models        for     wind       farm      development.
within the island due to the mountains to the south.
For one particular case with southerly flow, wind
speed variations of 2-3 m/s at 100 m height are
Figure 11: Wind speed at 50 m height at 03 UTC 01.01.2005. WRF-run with 1 km horizontal resolution. Height
contours (black lines) are drawn every 30 m. The vertical profiles are from the positions 1 (SW) and 2 (SE).

Figure 12:Vertical profiles of wind speed and potential temperature at the SW corner (red lines) and SE corner
(blue lines of the island Gurskøy. Height represent the heights above sea level.

References                                                  [2]. Bowen, A. J. and Mortensen, Niels G. Exploring
                                                                 the limits of WAsP the wind atlas analysis and
[1]. WAsP Manual: Wind Analysis and Application                  application program. In Proceedings of EWEC-
     Program (WAsP). Vol 2: Users Guide. Risø                    1996, Gøteborg, Sweden, 1996.
     National Laboratory, Roskilde, Denmark, ISBN           [3]. Berge, E., Nyhammer, F.K., Tallhaug, L. and
     87-550-178, 1993.                                           Jakobsen, Ø. An evaluation of the WAsP modell
                                                                 at a coastal mountainous site in Norway, 2006.
Wind Energy, in press.
[4]. WindSim documentation. http://windsim.com.
[5]. Undheim, O. The non-linear microscale flow
     solver 3DWind. Developments and validation.
     Ph.d. thesis at the Norwegian Technical
     University, Trondheim, Norway. 2005.
[6]. Eidsvik, K. J. A system for wind power
     estimation in mountainous terrain. Prediction of
     Askervein hill data. Wind Energy, 2005, 8, 237-
     249.
[7]. Michalakes, J., S. Chen, J. Dudhia, L. Hart, J.
     Klemp, J. Middlecoff, and W. Skamarock:
     Development of a Next Generation Regional
     Weather Research and Forecast Model.
     Developments in Teracomputing: Proceedings of
     the Ninth ECMWF Workshop on the Use of High
     Performance Computing in Meteorology. Eds.
     Walter Zwieflhofer and Norbert Kreitz. World
     Scientific, Singapore, 2001, pp. 269-27.
[8]. Benoit, R., Desgagné, M., Pellerin, P., Pellerin,
     S., Charter, Y. The Canadian MC2: a semi-
     Lagrangian,       semi-implicit       wide-band
     atmospheric model suited for finescale process
     studies and simulation. Monthly Weather Review
     1997, 125, 2382-2415.
[9]. Pielke, R.A., Cotton, W.R., Walko, R.L.,
     Tremback, C.J., Lyons, W.A., Grasso, L.D.,
     Nicholls, M.E., Moran, M.D., Wesley, D.A., Lee,
     T.J. and Copeland, J.H. A comprehensive
     meteorological modeling system–RAMS. Meteor.
     Atmos. Phys., 49, 1992, 69-91.
[10].   Undheim, O. 2003. Comparison of
    turbulence models for wind evaluation in
    complex terrain. In preparation for Proceedings
    of EWEC-2003 Madrid, Spain.
[11].   Stull, R. B. An introduction to boundary
    layer meteorology. Kluwer Academic Publisher,
    London, 1988.
[12].   Aasen, Svein Erik. The Skipheia Wind
    Measurements Station. Instrumentation, Wind
    Speed Profiles and Turbulence Spectra. Ph.d.
    thesis, University of Trondheim, Department of
    Physics, AVH, Trondheim, Norway. 1995.
[13].   Klemp, J.B., Skamarock, W.C. and Dudhia
    J. Conservative split-explicit time integration
    methods for the compressible non-hydrostatic
    equations (see http://www.wrf-model.org).
You can also read