Comparison of loads from HAWC2 and OpenFAST for the IEA Wind 15 MW Reference Wind Turbine - IOPscience
←
→
Page content transcription
If your browser does not render page correctly, please read the page content below

Journal of Physics: Conference Series

PAPER • OPEN ACCESS

Comparison of loads from HAWC2 and OpenFAST for the IEA Wind 15
MW Reference Wind Turbine
To cite this article: Jennifer Rinker et al 2020 J. Phys.: Conf. Ser. 1618 052052

View the article online for updates and enhancements.

                                This content was downloaded from IP address 46.4.80.155 on 12/05/2021 at 10:53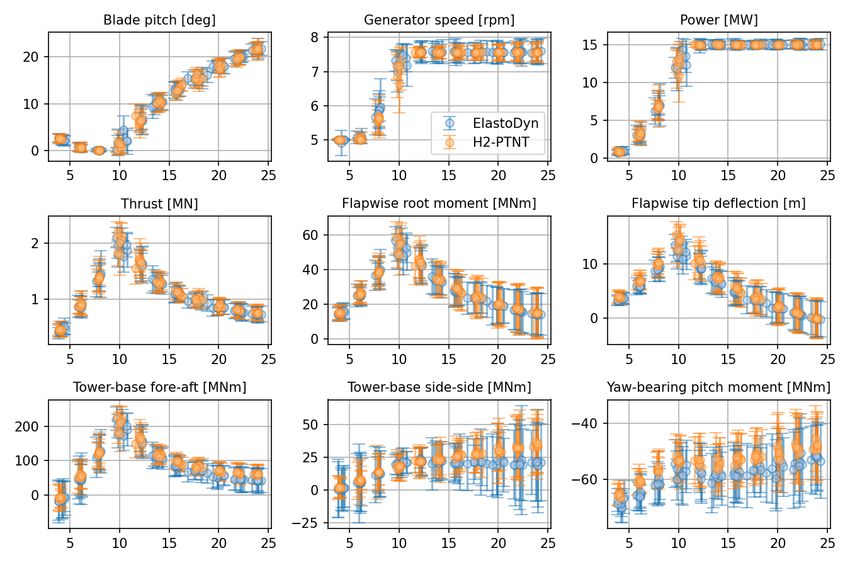
The Science of Making Torque from Wind (TORQUE 2020)                                                            IOP Publishing
Journal of Physics: Conference Series       1618 (2020) 052052                            doi:10.1088/1742-6596/1618/5/052052

Comparison of loads from HAWC2 and OpenFAST
for the IEA Wind 15 MW Reference Wind Turbine
                      Jennifer Rinker1 , Evan Gaertner2 , Frederik Zahle1 , Witold
                      Skrzypiński1 , Nikhar Abbas2 , Henrik Bredmose1 , Garrett Barter2 ,
                      Katherine Dykes1
                      1
                       Department of Wind Energy, Technical University of Denmark, Roskilde, Denmark.
                      2
                       National Wind Technology Center, National Renewable Energy Laboratory, Golden, CO,
                      USA.
                      E-mail: rink@dtu.dk

                      Abstract. Reference wind turbines (RWTs) that reflect the state-of-the-art of current wind
                      energy technology are necessary in order to properly evaluate innovative methods in wind turbine
                      design and evaluation. The International Energy Agency (IEA) Wind Technology Collaboration
                      Platform (TCP) Task 37 has recently developed a new RWT geared towards offshore floating-
                      foundation applications: the IEA Wind 15 MW. The model has been implemented in two
                      aeroelastic codes, OpenFAST and HAWC2, based on an underlying common ontology. However,
                      these toolchains result in slightly different structural parameters, and the two codes utilise
                      different structural models. Thus, to increase the utility of the model, it is necessary to
                      compare the aeroelastic responses. This paper compares aeroelastic loads calculated using
                      different fidelities of the blade model in OpenFAST (ElastoDyn and BeamDyn) and HAWC2
                      (prismatic Timoshenko without torsion and Timoshenko with fully populated stiffness matrix),
                      where both codes use the DTU Basic controller and the same turbulence boxes to reduce
                      discrepancies. The aeroelastic responses to steady wind, step wind and turbulent wind (per
                      IEC 61400-1 wind class IB) are considered. The results indicate a generally good agreement
                      between the loads dominated by aerodynamic thrust and force, especially for the no-torsion
                      blade models. Discrepancies were observed in other load channels, partially due to differences
                      in the asymmetric loading of the rotor and partially due to differing closed-loop dynamics, and
                      they will be the subject of future investigations.

1. Introduction
To successfully investigate the impacts of innovation on the efficacy and cost of wind energy
systems, it is essential that well-tested, state-of-the-art reference wind turbines (RWTs) are
shared publicly. On the one hand, commercial wind turbine models (even those out of production
for many years) embody sensitive intellectual property information related to many system
design aspects that cannot be shared publicly. On the other hand, sub-suppliers, developers,
consultancies, and research institutes need models for wind turbines that closely resemble
the commercial state-of-the-art in order to investigate scientific phenomena and innovative
technologies that will help advance performance and reduce costs for next generation wind
energy systems. One of the most well-known examples in wind energy is the National Renewable
Energy Laboratory (NREL) 5 megawatt (MW) [1], but a large number of other RWTs have been
produced to capture evolution in commercial technology over the years, including the Technical
              Content from this work may be used under the terms of the Creative Commons Attribution 3.0 licence. Any further distribution
              of this work must maintain attribution to the author(s) and the title of the work, journal citation and DOI.
Published under licence by IOP Publishing Ltd                          1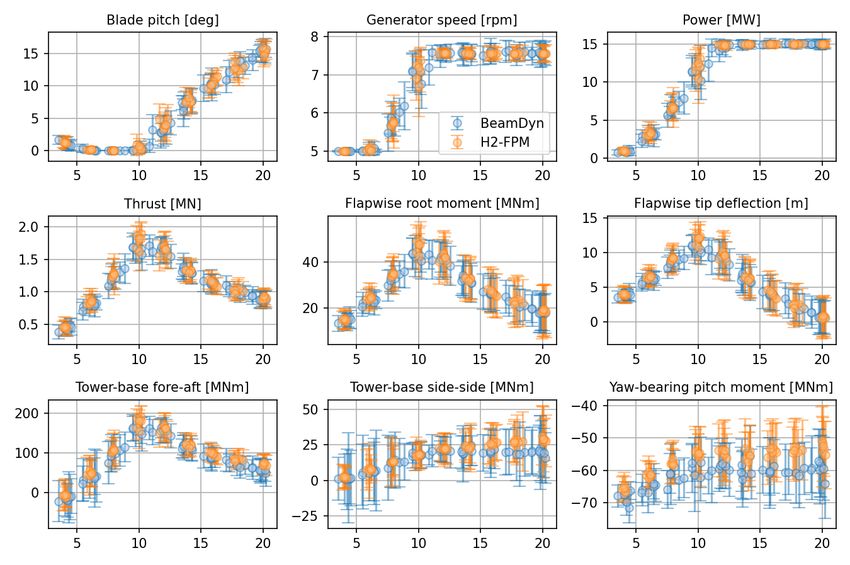
The Science of Making Torque from Wind (TORQUE 2020)                                   IOP Publishing
Journal of Physics: Conference Series       1618 (2020) 052052   doi:10.1088/1742-6596/1618/5/052052

University of Denmark (DTU) 10 MW [2] and the Wind Partnership for Advanced Component
Technology (WindPACT) RWTs [3].
    As the wind energy industry has developed, the need for new RWTs that reflect current
and future technologies has grown. To this end, the International Energy Agency (IEA) Wind
Technology Collaboration Platform (TCP) Task 37 on systems engineering has developed a
series of RWTs [4]: the IEA Wind 3.4 MW RWT, the IEA Wind 10 MW RWT and recently
the IEA Wind 15 MW, targeting offshore applications. The model was originally designed
by researchers from the National Renewable Energy Laboratory (NREL) before being further
developed collaboratively with researchers at the Technical University of Denmark (DTU). To
maximize its utility, a variety of design documents and aeroelastic input files are provided on
GitHub [5]. More information on the model specifications can be found in the design report [6].
    The underlying definitions of the RWT are defined according to the IEA Wind Task 37
wind turbine ontology, windIO [7]—a formal, common definition of a wind turbine model—and
this common ontology was converted to OpenFAST and HAWC2 implementations using different
toolchains. DTU’s toolchain used BECAS [8], HAWC2 [9] and HAWCStab2 [10], whereas NREL
used Sonata/Anba4 [11], WISDEM [12], and OpenFAST [13, 14]. The differences in toolchains
result in slightly different aeroelastic parameters, which will affect aeroelastic responses. To
complicate matters, the implementations in both OpenFAST and HAWC2 have multiple blade
models with different fidelities: OpenFAST has ElastoDyn and BeamDyn, and HAWC2 has
prismatic Timoshenko without torsion, prismatic Timoshenko with torsion and a Timoshenko
model with a fully populated stiffness matrix. For the IEA Wind 15 MW RWT to be useful
to both industry and researchers, it is essential that its inter-code aeroelastic behavior is well
understood. The most detailed source of information on differences between aeroelastic codes is
the set of reports from the Offshore Code Comparison projects (OC3 [15], OC4 [16] and OC5
[17]). However, these reports compare too many different aeroelastic codes and use an aeroelastic
model of a much smaller wind turbine, so we cannot draw relevant conclusions about differences
in the aeroelastic response of the IEA Wind 15 MW. Thus, this paper seeks to provide a baseline
inter-code comparison for the RWT, to yield key insights into the aeroelastic performance of
ElastoDyn, BeamDyn and HAWC2 and to provide a case study in using windIO for collaborative
research.
    The remainder of the paper is organised as follows. Section 2 describes the considerations
taken to reduce discrepancies in the blade structure, turbulence and controller. Comparisons of
the blade natural frequencies and steady-state, step-wind and turbulent responses are provided
in Sec. 3. Finally, the conclusions are drawn in Sec. 4.

2. Model comparisons
This section provides details on the modelling methodology, including particular efforts that were
made to reduce discrepancies between the two models. The version of the IEA Wind 15 MW
used in both OpenFAST and HAWC2 was the monopile model, but both hydrodynamics and
the monopile flexibility were disabled to mimic an onshore turbine. The remaining subsections
discuss specific aspects of the aerodynamics, blade structural modelling, turbulence modelling
and controller that could cause discrepancies and what measures were taken to reduce those
discrepancies.

2.1. Aerodynamics
The two aeroelastic codes use similar methodologies to calculate aerodynamic loading. The
OpenFAST model uses AeroDyn to calculate the aerodynamic forces. Tower shadow is modeled
using the baseline potential flow model and the unsteady airfoil aerodynamics are calculated
with the Beddoes-Leishman model. The HAWC2 model uses its standard potential tower shadow
model and a modified Beddoes-Leishman model for unsteady airfoil aerodynamics [18]. Both

                                                 2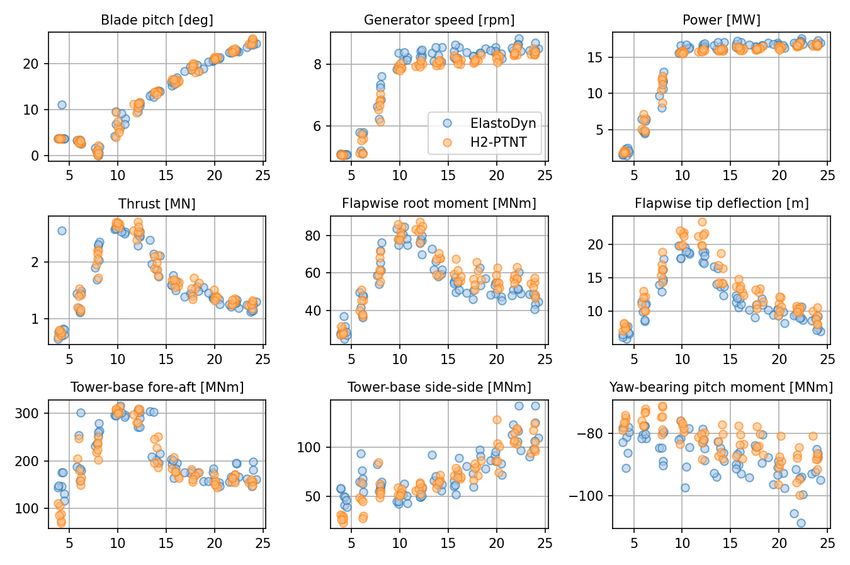
The Science of Making Torque from Wind (TORQUE 2020)                                   IOP Publishing
Journal of Physics: Conference Series       1618 (2020) 052052   doi:10.1088/1742-6596/1618/5/052052

models use Blade Element Momementum Theory, including empirical corrections like the Prandtl
tip loss model.

2.2. Blade structural models
Both OpenFAST and HAWC2 allow different modeling fidelities for the blade structure:
  • OpenFAST
     – ElastoDyn. ElastoDyn uses Euler-Bernoulli beam theory with assumed modes,
       modelling the blades as straight, isotropic beams with limited geometric nonlinearities
       and only flapwise and edgewise bending deflections (no torsion).
     – BeamDyn. BeamDyn uses geometrically exact beam theory with Legendre spectral
       finite elements, which better models blades with geometric nonlinearities and large
       deflections. A model is defined using distributed 6 × 6 mass and stiffness matrices.
  • HAWC2
     – Prismatic Timoshenko, no torsion (H2-PTNT). HAWC2’s default beam model
       is a prismatic Timoshenko beam, which allows both bending and torsional deflections.
       The H2-PTNT model disables torsion by setting the torsional stiffness to an arbitrarily
       large value.
     – Prismatic Timoshenko (H2-PT). HAWC2’s default beam model is a prismatic
       Timoshenko beam with both bending and torsional deflections.
     – Timoshenko with fully populated matrix (H2-FPM). HAWC2 also allows the
       specification of a Timoshenko beam model with fully populated 6 × 6 stiffness matrices,
       allowing more complex blade designs such as bend-twist-coupled blades. The inertial
       properties are modelled according to the prismatic Timoshenko beam theory.
The BeamDyn and H2-FPM blade properties were calculated using Sonata/ANBA4 and BECAS,
respectively, using the same underlying ontology [6]. Due to different reference axes, coordinate
systems, and modeling assumptions in OpenFAST and HAWC2, the same 6×6 matrices cannot
be used in both BeamDyn and H2-FPM. H2-PT and H2-PTNT properties were then extracted
from the corresponding higher-fidelity structural model. ElastoDyn properties were determined
using PreComp and pyFrame3dd, included in the WISDEM toolbox.
    The aeroelastic results presented in this paper compare ElastoDyn with H2-PTNT and
BeamDyn with H2-FPM. Because the focus of this paper is a comparison of the model behaviour
in the two different aeroelastic codes and due to space constraints, results from the H2-PT model
are not presented. However, the model was simulated and found to behave very closely to the
H2-FPM model.

2.3. Turbulence
The default turbulence simulators for OpenFAST and HAWC2 use different modeling
methodologies: OpenFAST uses the Kaimal spectrum with exponential coherence (KSEC),
whereas HAWC2 uses the Mann model. The Mann model uses a three-dimensional spectral
tensor that includes spatial correlation, whereas the KSEC model uses three one-dimensional
spectra and a spatial coherence model. These differences in inflow generation could have
significant impact on the aeroelastic results. Therefore, the turbulence boxes used in the HAWC2
simulations were converted to an OpenFAST-friendly format using PyConTurb [19] and then
used as inflow for the ElastoDyn and BeamDyn simulations.

2.4. Controller
A significant potential source of discrepancy in the dynamical behaviour of the models is different
controller logics. The default controller for the OpenFAST implementation of the RWT is

                                                 3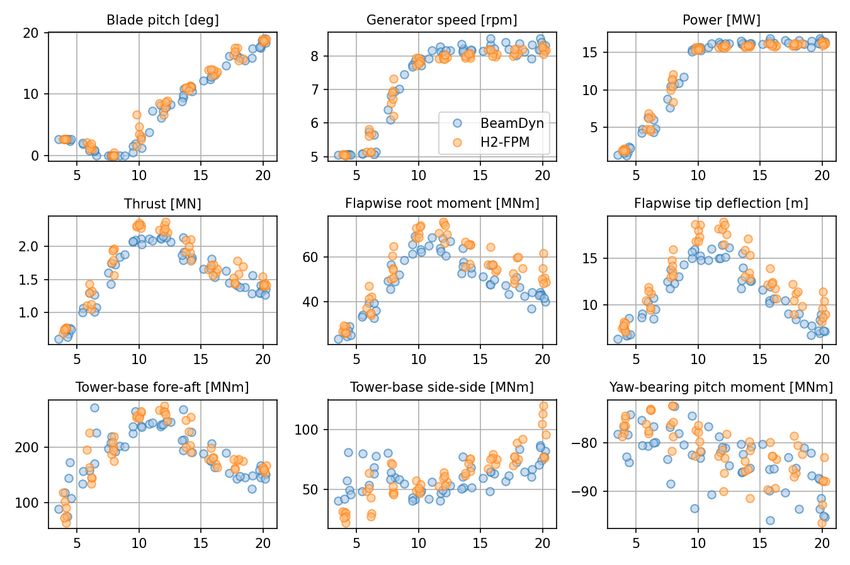
The Science of Making Torque from Wind (TORQUE 2020)                                   IOP Publishing
Journal of Physics: Conference Series       1618 (2020) 052052   doi:10.1088/1742-6596/1618/5/052052

NREL’s ROSCO (Reference Open Source Controller) [20, 21], whereas the HAWC2 model uses
the DTU Basic Controller [22]. For a code-to-code comparison, it is essential that as many
possible sources of discrepancy are removed from the comparison. Thus, for this paper, the
DTU Basic controller was compiled and coupled with OpenFAST, and the same controller
parameters were used for the corresponding OpenFAST and HAWC2 models. There are two
sets of controller parameters, one for the models with torsion and one for the models without
torsion. Thus, ElastoDyn and H2-PTNT used the same controller parameters, as did BeamDyn
and H2-FPM. Both sets of controller parameters were tuned using HAWCStab2 v2.16a [?] with
assumed partial-load poles (torque controller) and full-load poles (pitch controller) of 0.05 Hz,
70% critical, and 0.03 Hz, 70% critical, respectively. The controller parameters can be found in
the input files on the RWT GitHub [5].

3. Results
This section presents the comparisons of the aeroelastic results from HAWC2/HAWCStab2 and
OpenFAST. An analysis of the blade structural models is first presented in Sec. 3.1, which
includes the natural frequencies and a selection of distributed structural properties. Then,
Secs. 3.2, 3.3 and 3.4 compare the steady-state, step-wind and turbulent responses, respectively.
All OpenFAST results were simulated using version 2.2, the HAWC2 results were simulated
using version 12.8 1900 and the HAWCStab2 natural frequencies were generated using version
2.16a.

3.1. Comparison of blade structural models
We first present a basic comparison of the four blade models of interest to verify their
implementations. Fig. 1 plots the distributed mass density, flapwise stiffness, edgewise stiffness
and torsional stiffness of the models (torsional stiffness omitted for ElastoDyn and H2-
PTNT models). The values for the BeamDyn and H2-FPM models were extracted from the
corresponding diagonal values of the 6×6 matrices. As noted previously, slight differences
between the models are expected due to differences in the methodologies used to convert the
underlying ontology into the aeroelastic input files, but the overall agreement is quite good.

               Figure 1. Comparison of distributed blade structural properties.

   The structural natural frequencies of the blade calculated using OpenFAST’s linearization
option and HAWCStab2 [?] are compared in Table 1. The mode shapes were identified using
HAWCStab2’s mode-shape-visualization capabilities. The percent difference was calculated

                                                 4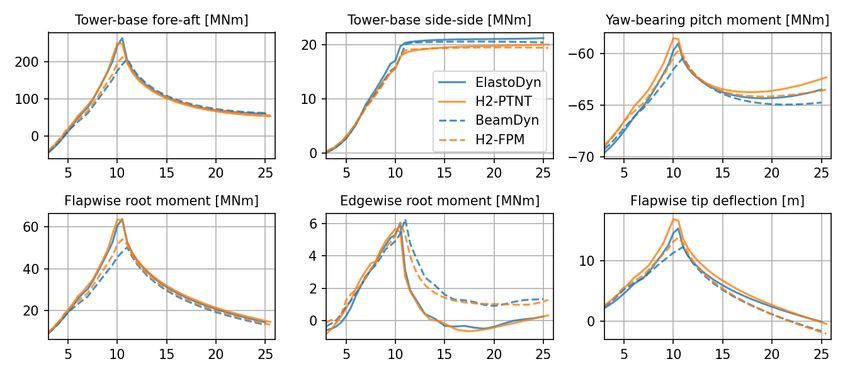
The Science of Making Torque from Wind (TORQUE 2020)                                   IOP Publishing
Journal of Physics: Conference Series       1618 (2020) 052052   doi:10.1088/1742-6596/1618/5/052052

                 Table 1. Blade structural natural frequencies in Hz (0 RPM).
        Mode      ED    H2-PTNT (% diff)              Mode BD H2-FPM (% diff)
       1st Flp   0.545    0.538      (1.2%)         1st Flp 0.517      0.521  (-0.8%)
      1st Edg    0.631    0.638     (-1.0%)        1st Edg 0.630       0.619   (1.8%)
     2nd Flp     1.618    1.658     (-2.4%)        2nd Flp 1.603       1.559   (2.8%)
     2nd Edg     1.981    2.024     (-2.2%)       2nd Edg 1.964        1.933   (1.6%)
      3rd Flp    3.239    3.385     (-4.4%)         3rd Flp 3.506      3.078  (13.0%)
     3rd Edg     4.264    4.381     (-2.7%)        3rd Edg 4.403       4.156   (5.8%)
      4th Flp    5.552    5.805     (-4.4%)         1st Trs 4.694      4.475   (4.8%)
     4th Edg     7.160    7.439     (-3.8%)         4th Flp 5.307      5.056   (4.8%)

according to pdif f = 2(fHAW C2 − fOpenF AST )/(fHAW C2 + fOpenF AST ) ∗ 100%. The agreement
between the two pairs of models (i.e., ElastoDyn vs. H2-PTNT and BeamDyn vs. H2-FPM) is
generally good. This small differences in natural frequencies are a natural result of the difference
in structural parameters, as discussed above. There is a larger difference in the 3rd flapwise
mode in the BeamDyn/H2-FPM models, but it may be ignored in further analyses because it
is sufficiently small and on a higher mode shape, which has a low modal participation factor in
the overall response.

3.2. Steady state
Before considering the dynamical response of the turbine, it is important that we first compare
the steady-state values (i.e., the mean aeroelastic response to steady wind). The steady values
were calculates by running closed-loop, time-marching simulations in OpenFAST and HAWC2
with constant wind (no shear), removing the first part of the simulation to remove start-up
effects and then taking the mean of the resulting aeroelastic response.
    A selection of steady-state operational and aerodynamic values are given in Fig. 2. The
models with torsion (ElastoDyn/H2-PTNT) are indicated by the solid lines, and those without
torsion (BeamDyn/H2-FPM) are indicated by the dashed lines. The following observations may
be made:
  • Good agreement in ElastoDyn and H2-PTNT operational data. The steady-state
    generator speed, blade pitch, generator torque and generator power all have good agreement
    between the ElastoDyn and H2-PTNT models. This verifies that the slight differences in
    structural parameters do not significantly impact the controller set-points in OpenFAST
    and HAWC2.
  • Small differences in BeamDyn and H2-FPM operational data. The structural
    differences between the BeamDyn and H2-FPM models are large enough to impact the
    controller set-points, as indicated by the differences in blade pitch angle, generator torque
    and generator power for the BeamDyn and H2-FPM models.
  • Small differences in ElastoDyn and H2-PTNT power coefficient (CP ) and thrust
    coefficient (CT ), but CP,max ≈ CP,design . There are slight differences between the CP and
    CT curves, as the OpenFAST calculation takes rotor deflection into account whereas the
    HAWC2 calculation does not. Regardless, the curves are quite similar, and the CP value
    in Region 2 (optimal TSR) is near the design CP value (0.489) [6].
  • Lower Cp and CT for BeamDyn and H2-FPM models. The CP and CT values for
    the models with torsion are generally lower, most notably in Region 2. This is indicative
    of the methodology used during the blade design, namely, that torsional deflection was not
    considered in the blade optimisation. Thus, the models with torsion will feature lower loads
    but also lower power generation.

                                                  5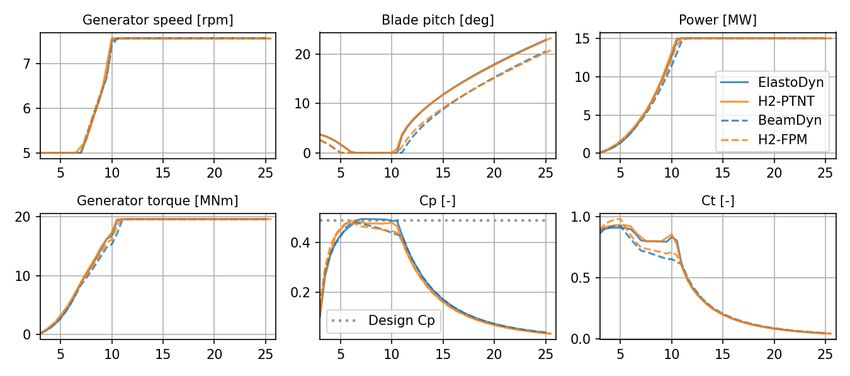
The Science of Making Torque from Wind (TORQUE 2020)                                   IOP Publishing
Journal of Physics: Conference Series       1618 (2020) 052052   doi:10.1088/1742-6596/1618/5/052052

          Figure 2. Comparison of steady-state operational and aerodynamic values.

    A selection of steady-state loads and deflections are plotted in Fig. 3. From the plots, the
following observations may be made:
  • Thrust- and torque-dominated loads for ElastoDyn and H2-PTNT match quite
    well. The tower-base fore-aft moment, flapwise blade root moment and edgewise blade
    root moment are all loads that are primarily dominated by the aerodynamic thrust or
    aerodynamic torque. For the ElastoDyn and H2-PTNT models, the aerodynamic thrust
    and torque match quite well (not shown), and therefore these load channels also feature
    very good agreement.
  • Small differences in the thrust- and torque-dominated loads for the BeamDyn
    and H2-FPM models. The differences in the BeamDyn and H2-FPM blade structural
    models and resulting difference in controller set-points result in thrust and torque curves for
    the BeamDyn and FPM models (not shown) that do not match as well as their no-torsion
    counterparts. These small differences in the thrust and torque curves for the BeamDyn and
    H2-FPM models then manifest as differences in the tower-base fore-aft moment, flapwise
    blade root moment and edgewise blade root moment. For example, the maximum flapwise
    blade root moment for BeamDyn is approximately 7.6% lower than H2-FPM.
  • Differences in the asymmetry-sensitive loads and deflections for all models.
    The tower-base side-side moment and yaw-bearing pitch moment are both sensitive to
    asymmetric rotor loading, which is caused by tilt, coning, etc. These load channels
    demonstrate distinct differences not only between BeamDyn and H2-FPM but also
    ElastoDyn and H2-PTNT. Thus, there are differences in the net lateral and vertical force
    exerted on the rotor by the aerodynamic loading, which result in different tower-base side-
    side and yaw-bearing pitch moment values. This difference in the net lateral and vertical
    rotor loading could be caused by the difference in blade deflections (Fig. 3 bottom right
    subplot) or by fundamental differences in the aerodynamic calculations.

3.3. Step wind
The closed-loop dynamic response of the IEA Wind 15 MW simulated in HAWC2 and
OpenFAST is given in Fig. 4. The step wind ranges from 3 to 25 m/s, and each step is 40 s
long. An initial 220 s was added at the beginning of the simulation to ensure that any transient

                                                 6
The Science of Making Torque from Wind (TORQUE 2020)                                   IOP Publishing
Journal of Physics: Conference Series       1618 (2020) 052052   doi:10.1088/1742-6596/1618/5/052052

                 Figure 3. Comparison of steady-state loads and deflections.

behaviour from the start of the simulation has died out. The Region 1 wind speeds are from
220 to 300 s, Region 2 from 300 s to 540 and Region 3 from 540 s onwards.

         Figure 4. Step-wind response for OpenFAST (orange) and HAWC2 (blue).

   The agreement between the two models is generally quite good, especially for the
ElastoDyn/H2-PTNT models, with more discernible differences between the BeamDyn and H2-
FPM responses. With the same controller and controller parameters between the two codes,
the differences can be attributed to the structural modeling, both in terms of the structural
property preprocessing and differences in the theoretical basis of the two codes. The resulting
blade deflections and torsion also change the respective aerodynamic responses of the blades.
Therefore, using the exact same controller parameters does not maximize agreement between the
models. Minor re-tuning that accounts for the differences in the aeroelastic response is expected
to further reduce discrepancies and will be the subject of future work. Generally though, the

                                                 7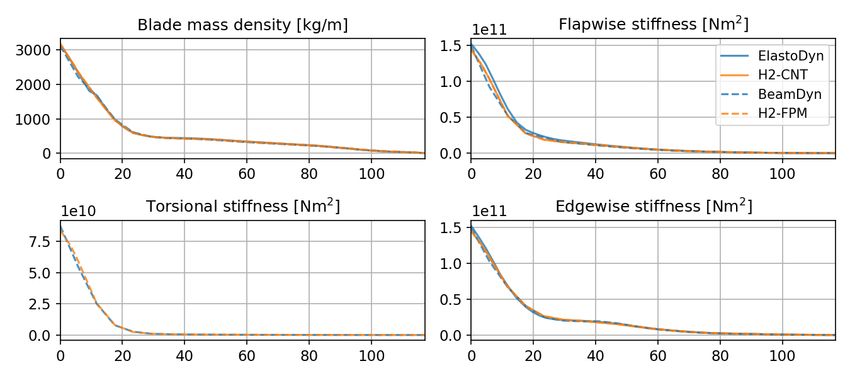
The Science of Making Torque from Wind (TORQUE 2020)                                   IOP Publishing
Journal of Physics: Conference Series       1618 (2020) 052052   doi:10.1088/1742-6596/1618/5/052052

difference in dynamics for these two models is small enough to be acceptable.

3.4. Turbulent wind
This section compares the aeroelastic responses for design load case (DLC) 1.1, as defined in
the wind turbine design standard International Electrotechnical Commission (IEC) 61400-1 [23],
wind class IB. 600-seconds turbulent simulations were run with mean wind speeds ranging from
3 to 25 m/s, in increments of 1 m/s, and the first 100 s were removed to eliminate transient
behaviour. The presented results for the BeamDyn and H2-FPm models only include wind
speeds up to 20 m/s due to a controller issue that forced shut-down during the transient start-
up phase. The mean values and standard deviations are presented first, followed by the extreme
values.

Figure 5. Mean (circles) and standard deviation (error bars) of aeroelastic response to class
IB turbulence with H2-PTNT and ElastoDyn.

   The statistics of a selection of load channels versus mean wind speed for ElastoDyn vs. H2-
PTNT and BeamDyn vs. H2-FPM are presented in Figs. 5 and 6, respectively. The following
observations may be made from the figures:
  • Good agreement in the operational data and thrust- and torque dominated
    channels for ElastDyn and H2-PTNT. Because the rotor thrust and torque for the two
    models match quite well, the flapwise root moment and tower-base fore-aft have generally
    good agreement.
  • Higher thrust and related loads with H2-FPM. Due to differences in the structural
    parameters, the H2-FPM model has a generally higher thrust than BeamDyn, which also

                                                 8
The Science of Making Torque from Wind (TORQUE 2020) IOP Publishing
Journal of Physics: Conference Series 1618 (2020) 052052 doi:10.1088/1742-6596/1618/5/052052
Figure 6. Mean (circles) and standard deviation (error bars) of aeroelastic response to class
IB turbulence with H2-FPM and BeamDyn.
results in generally higher flapwise root moment, tip deflections and tower-base fore-aft
moment.
• Differences due to asymmetric rotor loading in all models. Due to the addition of
wind shear, there are larger differences between OpenFAST and HAWC2 due to asymmetric
rotor loading. For example, for ElastoDyn vs. H2-PTNT, the mean yaw-bearing pitch
moment and the mean tower-base moments at higher wind speeds show poor agreement.
Similar trends are also seen in the BeamDyn vs. H2-FPM models.
• Larger variation in OpenFAST tower-base moments at low wind speeds. This
is likely due to the controller parameters being ill-suited to the slightly different open-loop
dynamics of the OpenFAST models. Future work could tune the controller parameters such
that the OpenFAST and HAWC2 models demonstrated identical closed-loop behaviour.
The extreme values for ElastoDyn vs. H2-PTNT and BeamDyn vs. H2-FPM are presented
in Figs. 7 and 8, respectively. From the plots, the following observations can be made:
• Larger max generator speed and power in OpenFAST above rated. This indicates
that the identical controller parameters used in the two models do not produce the same
closed-loop dynamics, resulting in larger OpenFAST overshoots. As noted above, future
work could include a controller study that seeks to match the closed-loop behaviour of the
two models.
• Generally good agreement for ElastoDyn vs. H2-PTNT loads and deflections.
Except for the yaw-bearing pitch moment, the maximum values for the flapwise root
moment, flapwise tip deflection and tower-base moments show generally good agreement.
9The Science of Making Torque from Wind (TORQUE 2020) IOP Publishing
Journal of Physics: Conference Series 1618 (2020) 052052 doi:10.1088/1742-6596/1618/5/052052
Figure 7. Extreme values of aeroelastic response to class IB turbulence with H2-PTNT and
ElastoDyn.
As noted above, differences in the maximum yaw-bearing moment occur due to differences
in the asymmetric rotor loading.
• Larger maximum blade responses for H2-FPM than BeamDyn. Because H2-FPM
features larger mean thrust and torque than BeamDyn, the maximum values for the loads
dominated by thrust and torque in H2-FPM are larger than their BeamDyn counterparts.
• Relatively good agreement in tower-base loads for BeamDyn vs. H2-FPM.
• Similar maximum yaw-bearing pitch moment for BeamDyn vs. H2-FPM.
Considering that the mean value of the BeamDyn yaw-bearing pitch moment is more
negative than the H2-FPM moment but their variations have similar amplitude, this might
be indicative of suboptimal closed-loop behaviour. A future in-depth control study would
be needed to examine this issue further.
4. Conclusions
This paper presents a detailed aeroelastic comparison of the IEA Wind 15 MW RWT as
implemented in OpenFAST and HAWC2/HAWCStab2. The model was implemented in the
two aeroelastic codes using separate toolchains, resulting in differences in structural properties,
and it is important to quantify the effect these differences will have on the respective aeroelastic
responses. To reduce the complexity of the analysis, particular efforts were made to reduce as
many discrepancies between the two models as possible. First, two different HAWC2 models
were used (Timoshenko without torsion and Timoshenko with a fully populated stiffness matrix)
to better match the structural models used in ElastoDyn and BeamDyn, respectively. Second,
10The Science of Making Torque from Wind (TORQUE 2020) IOP Publishing
Journal of Physics: Conference Series 1618 (2020) 052052 doi:10.1088/1742-6596/1618/5/052052
Figure 8. Extreme values of aeroelastic response to class IB turbulence with H2-FPM and
BeamDyn.
the Mann turbulence boxes from HAWC2 were reused in OpenFAST to eliminate differences
caused by inflow modelling. Lastly, the DTU Basic Controller with identical parameters was the
controller in both models. The aeroelastic responses of the two pairs of models were evaluated
by comparing their steady-state responses, step-wind responses and responses to turbulent wind
prescribed according to IEC 61400-1 design load case 1.1.
The responses of all four models showed generally good agreement, although differences did
arise that merit discussion. First, the load channels dominated by aerodynamic thrust and
torque (e.g., tower-base bending moment) showed very good agreement between ElastoDyn
and H2-PTNT. The differences in the structural values for BeamDyn and H2-FPM models
resulted in higher aerodynamic thrust, so the loads dominated by thrust were slightly higher
in the H2-FPM model. Interestingly, the load channels sensitive to asymmetric rotor loading
(e.g., tower-base side-side moment and yaw-bearing moment) showed differences, even for the
steady-state comparisons of ElastoDyn and H2-PTNT. Future work is needed to investigate
whether this difference is caused by differences in the blade deflected shape of in the fundamental
aerodynamics calculations. Lastly, although the same controller parameters were used in
both aeroelastic codes, the differences in structural parameters resulted in different closed-
loop behaviours. To remove this discrepancy, a future investigation must be made into tuning
the controller parameters for a better agreement of the OpenFAST and HAWC2 closed-loop
dynamics.
Despite the differences in certain responses, the results presented herein are of significant
value to other scientists who are interested in the aeroelastic response of the IEA Wind 15-MW
RWT. In particular, the use of the same turbulence boxes and the same controller sheds light
11The Science of Making Torque from Wind (TORQUE 2020) IOP Publishing
Journal of Physics: Conference Series 1618 (2020) 052052 doi:10.1088/1742-6596/1618/5/052052
onto exactly how close the aeroelastic responses from the two codes can be. Thus, the results
serve as an essential basis of comparison for future work that may utilize different controllers,
turbulence models or other modifications to the models.
Acknowledgement The DTU authors were supported by the European Union’s Horizon 2020
research and innovation programme under the COREWIND project, grant agreement No 826042.
This work was authored in part by the National Renewable Energy Laboratory, operated
by Alliance for Sustainable Energy, LLC, for the U.S. Department of Energy (DOE) under
Contract No. DE-AC36-08GO28308. Funding provided by the U.S. Department of Energy
Office of Energy Efficiency and Renewable Energy Wind Energy Technologies Office. The
views expressed in this article do not necessarily represent the views of the DOE or the U.S.
Government. The U.S. Government retains and the publisher, by accepting the article for
publication, acknowledges that the U.S. Government retains a nonexclusive, paid-up, irrevocable,
worldwide license to publish or reproduce the published form of this work, or allow others to do
so, for U.S. Government purposes.
References
[1] Jonkman J M, Butterfield S, Musial W and Scott G 2009 Definition of a 5-MW reference wind turbine for
offshore system development Tech. Rep. NREL/TP-500-38060 National Renewable Energy Laboratory
Golden, CO
[2] Bak C, Zahle F, Bitsche R, Kim T, Yde A, Henriksen L C, Natarajan A and Hansen M H 2013 Description
of the DTU 10 MW reference wind turbine Tech. Rep. I-0092 DTU Wind Energy
[3] Rinker J and Dykes K 2018 WindPACT reference wind turbines Tech. Rep. NREL/TP-5000-67667 National
Renewable Energy Laboratory Golden, CO
[4] Bortolotti P, Tarrés H C, Dykes K, Merz K, Suthuraman L, Verelst D and Zahle F 2019 IEA wind TCP
task 37: Systems engineering in wind energy - WP2.1 reference wind turbines Tech. rep. IEA Wind URL
https://www.nrel.gov/docs/fy19osti/73492.pdf
[5] IEA Task 37 2020 IEA GitHub repository URL https://github.com/IEAWindTask37/IEA-15-240-RWT
[6] Gaertner E et al 2020 Definition of the IEA wind 15-megawatt offshore reference wind turbine Tech. Rep.
NREL/TP-5000-75698 National Renewable Energy Laboratory Golden, CO
[7] IEA Wind Task 37 2020 windio documentation URL https://windio.readthedocs.io/en/latest/
[8] Blasques J 2012 User’s manual for BECAS: A cross section analysis tool for anisotropic and inhomogeneous
beam sections of arbitrary geometry Tech. Rep. Risø-R-1785 DTU Wind Energy Roskilde, Denmark
[9] Larsen T J and Hansen A M 2007 How 2 HAWC2, the user’s manual Tech. Rep. Risø-R-1597 DTU Wind
Energy Roskilde, Denmark
[10] Hansen M, Henriksen L, Tibaldi C, Bergami L, Verelst D, Pirrung G and Riva R 2018 HAWCStab2 User
Manual Tech. rep. DTU Wind Energy Roskilde, Denmark
[11] Feil R, Pflumm T, Bortolotti P and Morandini M Journal of Composite Structures In review
[12] Dykes K, Graf P, Scott G, Ning A, King R, Guo Y, Parsons T, Damiani R, Felker F and Veers P
2015 Introducing WISDEM: An Integrated System Model of Wind Turbines and Plants URL https:
//www.nrel.gov/docs/fy15osti/63564.pdf
[13] Jonkman J and Buhl Jr M L 2005 FAST User’s Guide Tech. Rep. NREL/EL-500-38230 National Renewable
Energy Laboratory Golden, Colorado
[14] National Renewable Energy Laboratory 2019 OpenFAST Documentation URL https://openfast.
readthedocs.io/en/master/
[15] Jonkman J and Musial W 2010 Offshore code comparison collaboration (OC3) for IEA task 23 offshore wind
technology and deployment Tech. Rep. NREL/TP-5000-48191 National Renewable Energy Laboratory
Golden, CO
[16] Popko W, Vorpahl F, Zuga A, Kohlmeier M, Jonkman J, Robertson A, Larsen T J, Yde A, Saetertro K
and Okstad K M et al 2012 22nd International Society of Offshore and Polar Engineers Conference URL
https://www.nrel.gov/docs/fy12osti/54124.pdf
[17] Robertson A N, Wendt F, Jonkman J M, Popko W, Dagher H, Gueydon S, Qvist J, Vittori F, Azcona J,
Uzunoglu E et al. 2017 Energy Procedia 137 38–57
[18] Hansen M H, Gaunaa M and Madsen H A 2004 A Beddoes-Leishman type dynamic stall model in state-space
and indicial formulations Tech. Rep. Risø-R-1354 DTU Wind Energy
[19] Rinker J M 2018 Journal of Physics: Conference Series 1037 062032
12The Science of Making Torque from Wind (TORQUE 2020) IOP Publishing
Journal of Physics: Conference Series 1618 (2020) 052052 doi:10.1088/1742-6596/1618/5/052052
[20] National Renewable Energy Laboratory 2019 ROSCO Version 0.1.0 GitHub repository URL https://
github.com/NREL/rosco
[21] Abbas N J, Wright A and Pao L 2020 vol 1452 (IOP Publishing) p 012002 URL https://doi.org/10.1088%
2F1742-6596%2F1452%2F1%2F012002
[22] Hansen M H and Henriksen L C 2013 Basic DTU wind energy controller Tech. Rep. DTU Wind Energy
E-0018 DTU Wind Energy Roskilde, Denmark
[23] International Electrotechnical Commission 2005 Wind turbines - part 1: design requirements 3rd ed.
13You can also read