The impact of state capacity on the cross-country variations in COVID-19 vaccination rates
←
→
Page content transcription
If your browser does not render page correctly, please read the page content below
Munich Personal RePEc Archive

The impact of state capacity on the
cross-country variations in COVID-19
vaccination rates

Tevdovski, Dragan and Jolakoski, Petar and Stojkoski,
Viktor

Faculty of Economics, University Ss. Cyril and Methodius in Skopje,
Skopje, North Macedonia, Association for Research and Analysis –
ZMAI, Skopje, North Macedonia, Macedonian Academy of Sciences
and Arts, Skopje, North Macedonia

8 March 2021

Online at https://mpra.ub.uni-muenchen.de/106504/
MPRA Paper No. 106504, posted 11 Mar 2021 08:37 UTC
The impact of state capacity on the cross-country
 variations in COVID-19 vaccination rates
 Dragan Tevdovski
 Faculty of Economics, University Ss. Cyril and Methodius in Skopje, Skopje, North
 Macedonia

 Petar Jolakoski
 Association for Research and Analysis – ZMAI, Skopje, North Macedonia

 Viktor Stojkoski
 Faculty of Economics, University Ss. Cyril and Methodius in Skopje, Skopje, North
 Macedonia,
 Association for Research and Analysis – ZMAI, Skopje, North Macedonia
 Macedonian Academy of Sciences and Arts, Skopje, North Macedonia
 vstojkoski@eccf.ukim.edu.mk

Abstract

The initial period of vaccination shows strong heterogeneity between countries’ vaccinations
rollout, both in the terms of the start of the vaccination process and in the dynamics of the
number of people that are vaccinated. A predominant thesis in the ongoing debate on the
drivers of this observed heterogeneity is that a key determinant of the swift and extensive
vaccine rollout is state capacity. Here, we utilize two measures that quantify different aspects
of the state capacity: i) the external capacity (measured through the soft power and the
economic power of the country) and ii) the internal capacity (measured via the country’s
government effectiveness) and investigate their relationship with the coronavirus vaccination
outcome in the initial period (up to 30th January 2021). By using data on 189 countries and a
two-step Heckman approach, we find that the economic power of the country and its soft power
are robust determinants of whether a country has started with the vaccination process. In
addition, the government effectiveness is a key factor that determines vaccine roll-out.
Altogether, our findings are in line with the hypothesis that state capacity determines the
observed heterogeneity between countries in the initial period of COVID-19 vaccines rollout.

Keywords: state capacity, COVID-19, Heckman selection

JEL Codes: C54, F51, F63

1. Introduction

The COVID-19 virus created the most severe global economic crisis since the Global
Depression. The recent innovation of COVID-19 vaccines brings hope that the World will exit
from the pandemic soon. As a means to provide an equitable access to vaccines for every
country, the World Health Organization created the COVAX system. However, the system has
so far failed in its goal, and the initial period of vaccination shows strong heterogeneity between
countries’ vaccinations rollouts. This is observed both in the terms of the start of the
vaccination process and in the dynamics of the number of people that are vaccinated.
Concretely, until end-January 2021, the vaccination started only in 54 countries in the World,
while the COVID-19 vaccines are not accessible for most of the countries. Also, there are high
discrepancies among the countries in speed of vaccination. Israel is leading with 46,7
administered COVID-19 doses per 100 people, followed by United Arab Emirates 27.1, United
Kingdom 10.8 and United States 7.1, while the rest of the countries are below 5 administered
COVID-19 doses per 100 people on January 30th, 2021.1
A predominant thesis in the ongoing debate on the drivers of this heterogeneity is that a key
determinant of the swift and extensive vaccine rollout is state capacity. This variable is not
strictly defined in the literature but is generally portrayed as a potential source of strength that
can fundamentally shape the implementation and the final impact of policies (Cingolani et al.
2015). As such it has attracted renowned interest in studies of economic development over the
past decade (for example, Besley and Persson 2010, Acemoglu et al. 2015, Cingolani 2018,
Khemani 2019, Williams 2020).
In our work, we bridge the gap between the theoretical debate and empirical evidence by
conducting a thorough econometric analysis on the impact of state capacity on the ability of a
country to start and implement the vaccination process. For this purpose, we utilize country
level data that covers the initial period of the vaccination process, up to January 30th, 2021 and
model the final outcome (the total number of administered vaccines per capita at the final date).
Evidently, the data is censored i.e., most countries display 0 vaccination rate. To circumvent
this problem, we assume that countries undergo a process of negotiation with vaccine providers
and accept an offer only if it suits their economy. This allows us to describe the vaccination
outcome as a two-step Heckman selection model. In the first step, we model the probability
that a country has started with the vaccination process by using all available data. In the second
step, we model the vaccination rate only for the countries that have started with the vaccination
process.
We follow the literature and view the importance of the state capacity in two dimensions that
determines COVID-19 vaccination success. The first is external capacity which describes the
ability of the state to influence outcomes outside of its territory. In this case, it determines the
likelihood that the country will secure reception of vaccines in a time period when vaccine
supply is much lower than demand (i.e., a non-censored observation). The second is the
internal state capacity. The internal capacity is relevant after the vaccines are received and it
determines the speed of vaccination among a country's population.
The impact of the external state capacity on the supply of vaccines is based on the economic
power and soft power of the country. As an approximation for economic power, we use the
total GDP of the country. In the gravity models of international trade, this observable represents
economic mass and is seen as a crude measure of economic power. An additional similar
measure can be the export of the country, which is an indicator of the success of an economy
in international trade. Nye (2004) defines soft power as the capacity for shaping the preferences
of others through appeal and cooperation. While there is no widely accepted measure of the
soft power and different rankings focused on different elements of interest, in this paper, we
use the membership of the country in the top 30 countries according to the Soft Power 30 index
(USC Center of Public Diplomacy, 2020). This is a formal index that ranks countries according
to three primary dimensions of soft power: culture, political values and foreign policy, based
on theoretical considerations of Nye (2011). For various applications of the index, we refer to
Rutland and Kazantsev 2016, Lai 2019, and Kacziba 2020.
We measure the internal state capacity with the World Bank’s indicator of government
effectiveness. The indicator captures perception about the quality of policies formulation and
implementation. As a consequence, it has been widely used as an indicator of the administrative
capacity (for example, Lee and Whitford 2009, Hanson and Sigman 2013).

1
 Source: Ourworld in data, https://ourworldindata.org/covid-vaccinations.
After controlling for a large set of potential socio-economic and COVID-19 specific
confounders, we find that the economic power of the country and its soft power are robust
determinants of the vaccines receipts and start of the vaccination process in the initial period,
which is characterized with very limited vaccines supply from producers. In addition, our
results suggest that after the vaccines’ supply is secured, the internal state capacity, measured
by the government effectiveness, is a key factor that determines vaccine roll-out. Altogether,
our findings are in line with the hypothesis that state capacity determines the observed
heterogeneity between countries in the initial period of COVID-19 vaccines rollout.
The rest of the paper is structured as follows. In Section 2 we present an econometric model.
In Section 3 we describe the data used for the testing of our hypotheses. In Section 4 we present
our main findings. Section 5 sets out our conclusions.

2. Method

Countries undergo a process of negotiation with a vaccine provider to determine the quantity
and price of vaccines. This process involves a great deal of geopolitics and, in the sense that
most of the countries negotiate only with vaccine providers which are recognized by its
geopolitical allies. This is evident by the fact that many countries from Eastern Europe in the
observed period declined offers of Sinovac from China or Sputnic V from Russia, while failed
to secure Western vaccines made by BioNTech-Pfizer, Moderna and AstraZeneca.2 In addition,
there might be skepticism in the quality of certain vaccines. For simplicity we assume that these
aspects are translated in the price of the vaccine. The resulting outcome for country is the
offer for the number of vaccinations per hundred population !∗ , which is unobserved. If the
offer is above a certain threshold that is acceptable for the price, the country will accept the
offer. Moreover, the start of vaccination is conditioned with physical distribution of the
vaccines in the observed period.3 Evidently, there is a bias in the selection of the sample
countries used for modeling the COVID-19 vaccination dynamics, as not everyone was able to
efficiently negotiate with vaccine providers and to secure receipt of the vaccines.
A simple way to correct for this bias is to utilize a Heckman selection model (Heckman, 1974;
Winship, 1992). The model represents a simple two-step approach. In the first step of the
estimation procedure, the researcher models the sampling probability of each observation. In
our case, this is the selection equation, where we quantify the probability that a certain country
has started with the vaccination process. This is modeled as a probit regression of the form

 ( ! = 1 | #! , #! ) = ( # #! + #! ),

where ! is an indicator variable which takes value 1 if country has started with the vaccination
process, and zero otherwise; #! is a vector of potential socio-economic variables that
determine the value of ! , with # being their marginal effects; and #! are control variables
that are specific to the COVID-19 dynamics in the country, with being their marginal effect.
The second step models the observed vaccination rate by correcting the bias in the random
error ! of the regression using the conditional expectation of the error estimated in the first
step. Formally, the second step of the equation is specified as

 ( ! | $! , $! , ! = 1) = $ $! + $! + ( ! | $ $! + $! ).

2
 See the report accessed at https://ecfr.eu/article/the-geopolitics-of-covid-vaccines-in-europes-eastern-
neighbourhood/
3
 In order to force pharmaceutical companies to fulfil COVID-19 contracts, European Union has introduced a
temporary export regime for COVID-19 vaccines on January 30th, 2021.
In the equation, $! is a vector of potential socio-economic variables that determine the
vaccination rate of a country which has started the vaccination process, with $ being their
marginal effects; and $! are control variables that are specific to the vaccination rate dynamics
in the country.

3. Data

We obtained COVID-19 number of vaccinations per hundred population data from Our World
in Data in Data – Coronavirus (COVID-19) Vaccinations database4. The explanatory variables
were taken from various sources, as will be explained in the following. For each variable, unless
otherwise specified, we take the last available data point as our observation, with the note that
we do not take data that came out after January 30th 2021. This is because we want to emphasize
the role of the country's capacity in being able to deliver COVID-19 vaccines in the initial
period of the vaccination process.
In the first step of the model specification, we include two control variables that may govern
the probability that a country has started with the vaccination process. They are the log of the
registered COVID-19 cases up to the last date of observation and the log of the average daily
government response index since the first registered case and up to the last date of observation.
The first variable quantifies the magnitude of the health crisis in the country, whereas the
second one is an estimate for the government behavior aimed at reducing the impact of the
crisis. The data for the registered Cases were taken from the Our World in Data Coronavirus
database5. The government response index was calculated using the methodology described in
(Stojkoski et al., 2020) with input data from the Oxford Government Response Tracker6. In
addition, the socio-economic variables that may drive the observation of whether a country has
started with the vaccination process and are included in our model are: the log of the GDP of
the country – measures the size of the economy and its economic power; the log of the share
of exports in GDP – quantifies the presence of the country in the global trade market; the log
of the total health expenditures as a percent of GDP – provides an proxy for the capacity of the
health sector in the country, the log of the Military expenditures as a percent of GDP –
determines the hard power of the country, and a dummy quantifying whether the country is
included in the top 30 countries that are ranked in terms of soft power – obviously, measuring
the soft power of the country.
In the second step, besides the control variables included in the first step we also include the
number of days since the first vaccination in the country and dummies for three different types
of vaccine providers present in the country i) Western block vaccines (Oxford/Az,
Pfizer/BioNTech and Moderna), ii) Chinese vaccines (Sino-Wuhan) and iii) Russian vaccines
(Sputnik). The first quantity is a measure for the duration of the vaccination process in the
country, whereas the second one is an approximation for the heterogeneity in the vaccine
choices of a country and indirectly it may be a quantity for the geopolitical orientation of the
country. Moreover, in the second step we include each of the socio-economic variables except
the soft power dummy, which is now substituted with our measure for the internal capacity of
the country – the government effectiveness. Also, we include the log of the share of persons
above 65 years of age in the total population of the country. We expect that countries with older
populations also speed up with the vaccination process as they are the most succeptible group

4
 Available at https://ourworldindata.org/covid-vaccinations.
5
 Available at https://ourworldindata.org/coronavirus.
6
 Available at https://www.bsg.ox.ac.uk/research/research-projects/coronavirus-government-response-tracker.
to the disease. Data sources, variable descriptions and their abbreviations are presented in more
detail in Appendix, Table A1.
Column 1 of Table 1 gives the mean value for each variable included in the sample. Columns
2 and 3 of the same table, give the summary statistics divided by group of countries which
respectively have started and have not yet started the vaccination process. In total, only 56 of
the 189 countries included in the sample have started with the vaccination process.
Interestingly, the countries which started with the vaccination process also reported a higher
number of registered cases per capita and had a stricter government response. Moreover, they
had higher GDP, larger exports as well as health and military expenditures as a percent of GDP,
older population and had more efficient government. All of this suggests that there are
significant discrepancies in the economic performance of the countries which started with the
vaccination process and those that have not.

Table 1. Descriptive statistics

 Started vaccination
 Variable All countries
 No Yes
 Vaccinations p.h.p (log) 0.55 / 0.55
 (1.57) / (1.57)
 COVID-19 cases p.m.p (log) 8.47 7.75 10.21
 (2.31) (2.28) (1.17)
 Days (first vaccine - last vaccine) 27.11 / 27.11
 (10.24) / (10.24)
 Government response (log) 57.22 56.83 58
 (11.56) (12.76) (8.70)
 GDP (log) 25.05 24.32 26.67
 (2.24) (2.04) (1.76)
 GDP per capita, PPP (log) 9.41 8.92 10.49
 (1.16) (1.02) (0.61)
 Exports (% of GDP, log) 3.57 3.45 3.84
 (0.61) (0.58) (0.61)
 Health expenditures (% of GDP, log) 1.77 1.69 1.97
 (0.43) (0.44) (0.36)
 Military expenditures (% of GDP, log) 0.39 0.33 0.51
 (0.92) (1.03) (0.67)
 Government effectiveness -0.05 -0.43 0.83
 (0.99) (0.84) (0.74)
 Population 65+ (log) 0.55 0.41 0.86
 (0.46) (0.38) (0.48)
 Number of countries 189 133 56
 Note: Standard deviation in parentheses
4. Results

4.1 Descriptive Analysis

We begin the analysis with a graphical representation of the association between the economic
power and the probability for the country to start with the vaccination process in the initial
period (December 15th 2020 - January 30th 2021). In this aspect, Figure 1 compares the boxplot
of the log of GDP of the countries that started with the vaccination with the boxplot of the log
of GDP of the countries that did not start in the observed period. The group of countries that
started the vaccination process not only have a higher median, minimum and maximum, but
also its first quartile is almost equal to the third quartile of the group of countries that did not
start the vaccination process.

Figure 1. Boxplots based on GDP.

In more detail in Figure 2 we present with dots all 189 studied countries. Also, we plot the
conditional probability density that a country started vaccination, given its GDP (in logs). The
line shows that higher values of GDP lead to an increase in the probability that a country starts
the vaccination process. Moreover, on this figure the countries that are in top 30 countries
according to soft power are marked with orange. The vaccination started in 87% of the
countries that are members of the Soft power 30. The four top soft power 30 countries where
vaccinations did not start are characterized with low levels of daily COVID-19 cases (they are
Australia, New Zealand, Japan and South Korea).
Figure 2. Conditional probability density for a country to start the vaccination process
given its GDP. The filled background color indicates the 95% confidence interval.

In Figure 3, we present a scatterplot between government effectiveness and vaccination rate
for all 56 countries that started with vaccination in the observed period. The plot uncovers a
positive relationship between observed variables, implying that countries with higher
government effectiveness achieved higher numbers of vaccinated persons, i.e., vaccination
rate.

Figure 3. Relationship between government effectiveness and vaccination rate. The line
shows the linear relationship between the variables (significant at 1%).

4.2 Heckman selection model results

 Mirroring our theoretical model, the empirical analysis follows the described two-step
process. In the first step, we quantify the probability for the start of the vaccination process in
the observed period. The second step models the observed vaccination rate.
 The results of the Heckman selection model are presented in Table 2. Columns (1-2) give
the model estimates with only the control variables included in the model, Columns 3-12,
represent results with four different specifications for the COVID-19 vaccination process. In
each model, the dependent variable of the first step is marked with started, while in the second
step with lvac. The estimated coefficients of the first model, as given in Columns 1 and 2 show
that the registered COVID-19 cases are significant in both steps and that the number of days
since the start of vaccination is significant in the second step, while the government response
index is not significant. The positive coefficients imply that more registered COVID-19 cases
in the country increases the probability country to start with the vaccinations in the observed
period and also that more registered COVID-19 cases speed up the vaccination rate in the
observed period. Also, as expected, more days since the start of vaccination lead to higher
vaccination rate.
In the second model, given in Columns 3-4 of the same table, we add our measures of soft
country capacity to the estimation. The results reveal that the country’s membership in the top
30 soft power increases the probability that the country received vaccines and started with the
vaccinations in the observed period. Also, the positive and significant government
effectiveness coefficient implies that higher government effectiveness leads to higher
vaccination rate in the country.
 The third model (Columns 5-6) includes additional variables in both steps in order to check
whether the capacity of the health sector or military power of the country influences the
vaccination process. The estimated coefficients show that the capacity of the health sector in
the country (the log of the total health expenditures as a percent of GDP) and the hard power
of the country (the log of the military expenditures as a percent of GDP) are not significant
determinants of the probability country to started with vaccination in observed period, while
the soft power is still significant and positive. Similarly, these additionally added variables do
not display a significant effect on the vaccination rate in the country.
 The fourth model (Columns 7-8) is augmented with economic and demographic variables.
In the first step, it additionally includes the log of the GDP and the log of the share of exports
in GDP, while in the second step it additionally includes log of the GDP and share of the
population above 65-years as the riskiest population group. The estimated coefficients in the
first step show that both economic variables are significant and positive, implying that the size
of the economy and the presence of the country in the international trade matter for both the
probability that the country started with the vaccination process and the speed with which it
distributes. Also, the soft power remains positive and significant. Additionally, the estimated
coefficients in the second step show that the size of the economy and the share of the population
above 65 years age are not significant, as well as previously added variables, while the days
since the start of vaccination and government effectiveness remains significant and positive.
 The estimated coefficients in each of the Heckman selection models back our theoretical
claims. In every case, the economic power increases the probability that a country will secure
the receipt of vaccines in the initial period of the start of vaccination. The bigger size of the
economy represents a bigger market for the vaccine supplier and gives the country a better
negotiation position. Also, stronger relative export capacity of the economy represents more
importance in international trade and improves the prospects of the country to receive vaccines.
Moreover, economic power is not a sole determinant of vaccine receipt, but also the soft power
matters. We argue that the reason for this is not only limited supply of the vaccines in the period
from December 15th 2020 to January 30th 2021, but also the fact that the competition for
vaccines is not between private subjects, but between governments, which use their diplomatic
and other apparatus. In addition, it is important to note that more registered COVID-19 cases
mean more pressure on governments to find a way to secure the vaccines receipt in the initial
period. Similarly, once the vaccines are secured, the speed of the vaccination depends on the
government effectiveness to organize and execute the process of vaccinations, as well as the
time of the realization of the process.
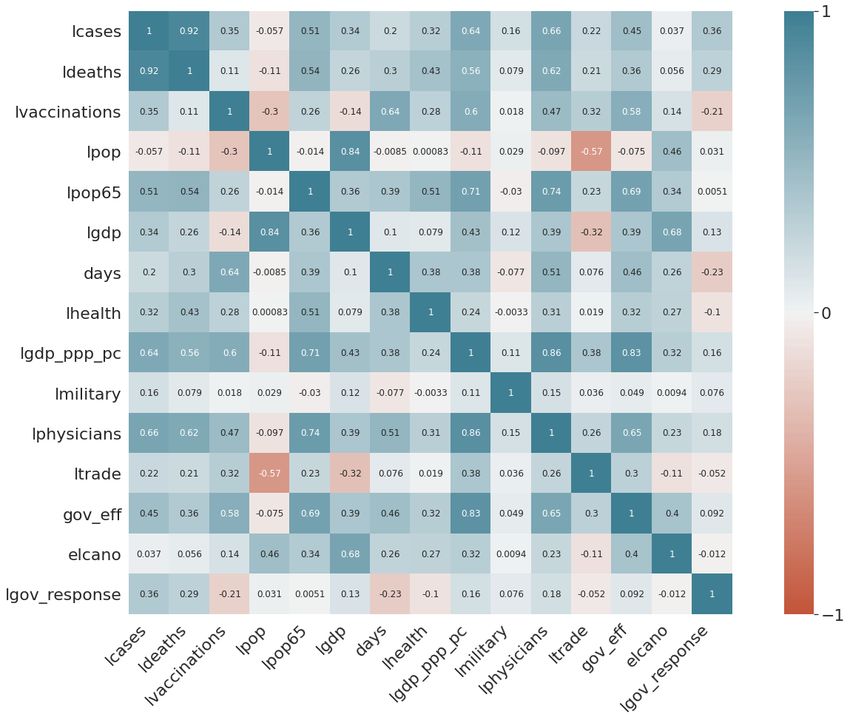
In the last model, we substitute the total GDP of the country with the GDP per capita and use
 it to check the significance of the predictors. In this case, the soft power variable is again a
 positive and significant predictor of the start of the vaccination, together with the number of
 registered COVID-19 cases and GDP per capita, which is an alternative measure of the
 economic power of the country, while the other variables remain not significant as in the
 previous models. In the second step, we observe that a significant predictor of the vaccination
 rate is only the number of the days since the first start of vaccination, whereas the newly
 included GDP per capita and the only variable that was previously significant, the government
 effectiveness, are not able to explain the COVID-19 vaccination dynamics together. However,
 the lost significance of the government effectiveness can be explained with high correlation
 between GDP per capita and government effectiveness (0.83). In Figure A1 in the appendix,
 we present a correlation matrix between all included variables in the analysis.

 Table 2: Estimated Heckman selection models for the vaccination process.
 Model 1 Model 2 Model 3 Model 4 Model 5
 (1) (2) (3) (4) (5) (6) (7) (8) (9) (10)
VARIABLE Vaccinati Started Vaccinati Started Vaccinati Started Vaccinati Started Vaccinati Started
 ons p.h.p. vaccinatio ons p.h.p. vaccinatio ons p.h.p. vaccinatio ons p.h.p. vaccination ons p.h.p. vaccinatio
 (log) n (log) n (log) n (log) (log) n

cases (log) 0.361** 0.525*** 0.297** 0.504*** 0.315*** 0.567*** 0.304** 0.469*** 0.254** 0.387**
 (0.165) (0.130) (0.123) (0.096) (0.121) (0.145) (0.146) (0.120) (0.128) (0.150)
days 0.087*** 0.069*** 0.085*** 0.071*** 0.068***
 (0.018) (0.015) (0.020) (0.018) (0.019)
gov_response -0.900 -0.452 -0.889 -0.205 -0.356 0.086 -0.502 0.021
(log)
 (1.276) (0.517) (1.232) (0.716) (1.287) (0.818) (1.334) (0.750)
GDP (log) -0.178 0.400***
 (0.199) (0.127)
gdp_ppp_pc 0.574 0.737***
(log)
 (0.697) (0.281)
exports (log) 0.320 1.090*** -0.022
 (0.309) (0.378) (0.344)
health_exp -0.328 -0.521 0.037 0.044 -0.439 -0.323
(log)
 (0.560) (0.515) (0.819) (0.555) (0.543) (0.599)
military_exp 0.239 0.180 0.281 -0.005 0.245 0.124
(log)
 (0.267) (0.193) (0.215) (0.202) (0.233) (0.177)
gov_eff 0.718*** 0.782*** 0.335
 (0.217) (0.255) (0.525)
pop_65 (log) -0.221 -0.003
 (0.427) (0.406)
Soft Power 30 2.129*** 2.337*** 1.224** 1.286***
 (0.352) (0.435) (0.487) (0.368)
Constant -2.022 -3.408* -5.120*** -5.538*** -0.878 -5.519 1.746 -19.707*** -6.979 -10.902**
 (5.632) (1.872) (1.213) (0.935) (5.597) (3.423) (10.182) (6.337) (6.517) (4.322)

Observations 165 165 187 187 151 151 148 148 148 148
Robust standard errors in parentheses. Every model includes dummies for the three types of vaccines i) Western block, ii) Chinese
and iii) Russian.
*** p
vaccination rate up until January 30th. In both cases, we repeat the estimation of the first four
 models discussed above, and each time our measures of soft power and external capacity
 remain significant predictors with a positive magnitude of, respectively, the probability that a
 country will start with the vaccination process and the vaccination rate in the initial period.
 Hence, our results are robust against the presence of outliers.

 Table 3: Estimated Heckman selection models (gov. effectiveness and GDP outliers
 excluded).

 Model 1 Model 2 Model 3 Model 4
 (1) (2) (3) (4) (5) (6) (7) (8)
VARIABLES Vaccinatio Started Vaccinatio Started Vaccinatio Started Vaccinatio Started
 ns p.h.p. vaccination ns p.h.p. vaccination ns p.h.p. vaccination ns p.h.p. vaccination
 (log) (log) (log) (log)

cases (log) 0.518* 0.821*** 0.113 0.692*** 0.711* 0.600*** 0.228 0.504***
 (0.309) (0.169) (0.316) (0.143) (0.383) (0.160) (0.487) (0.136)
days 0.083*** 0.065*** 0.070** 0.063**
 (0.024) (0.018) (0.035) (0.028)
gov_response -1.642 -0.618 -1.537 -0.187 -0.824 0.120
(log)
 (1.788) (0.704) (1.656) (0.808) (1.749) (0.915)
GDP (log) -0.243 0.313**
 (0.237) (0.140)
exports (log) 0.667 1.284**
 (0.460) (0.561)
health_exp (log) -1.575* 0.214 -1.134 0.560
 (0.957) (0.594) (1.413) (0.680)
military_exp 0.040 0.333 0.040 0.159
(log)
 (0.347) (0.240) (0.258) (0.231)
gov_eff 1.405*** 1.447***
 (0.454) (0.535)
pop_65 (log) -0.166
 (0.473)
Soft Power 30 1.735*** 1.599*** 0.879*
 (0.307) (0.355) (0.525)
Constant -1.209 -5.795* -3.442 -7.327*** 0.834 -8.669* 8.852 -19.759**
 (9.037) (2.998) (3.466) (1.443) (9.224) (4.832) (13.238) (8.104)

Observations 131 131 142 142 123 123 123 123
Robust standard errors in parentheses. Every model includes dummies for the three types of vaccines i) Western block, ii)
Chinese and iii) Russian.
*** p
Table 4: Estimated Heckman selection models (vaccination rate outliers excluded).

 Model 1 Model 2 Model 3 Model 4
 (1) (2) (3) (4) (5) (6) (7) (8)
VARIABLES Vaccinatio Started Vaccinatio Started Vaccinatio Started Vaccinatio Started
 ns p.h.p. vaccination ns p.h.p. vaccination ns p.h.p. vaccination ns p.h.p. vaccination
 (log) (log) (log) (log)

cases (log) 0.425*** 0.516*** 0.290*** 0.496*** 0.284** 0.556*** 0.331*** 0.488***
 (0.145) (0.130) (0.105) (0.099) (0.115) (0.142) (0.092) (0.125)
days 0.088*** 0.070*** 0.079*** 0.064***
 (0.016) (0.013) (0.018) (0.017)
gov_response -0.490 -0.403 -0.250 -0.084 1.091 0.242
(log)
 (1.081) (0.511) (1.017) (0.732) (0.982) (0.881)
GDP (log) 0.042 0.498***
 (0.101) (0.118)
exports (log) 0.276 1.163**
 (0.298) (0.454)
health_exp (log) 0.195 -0.497 -0.583 0.107
 (0.473) (0.518) (0.591) (0.605)
military_exp 0.076 0.158 0.265 -0.020
(log)
 (0.199) (0.202) (0.161) (0.215)
gov_eff 0.573*** 0.519**
 (0.182) (0.217)
pop_65 (log) 0.633**
 (0.315)
Soft Power 30 2.197*** 2.407*** 1.191**
 (0.352) (0.416) (0.488)
Constant -4.431 -3.545* -4.660*** -5.526*** -3.570 -5.856 -11.672** -23.542***
 (4.492) (1.870) (1.063) (0.966) (4.507) (3.602) (5.432) (6.985)

Observations 162 162 184 184 148 148 145 145
Robust standard errors in parentheses. Every model includes dummies for the three types of vaccines i) Western block, ii)
Chinese and iii) Russian.
*** p
well as the time of the realization of the process. On the other hand, the country’s policy
response, total health expenditures, military expenditures, and proportion of the population
above 65 years age are not significant. We also performed robustness checks, which were in
line with the baseline results.
These results put a new light on the already known wisdom that the role of the state is crucial
in a severe crisis, such as world wars, systemic economic crisis and pandemics. This particular
time, during the COVID-19 pandemic, the vaccine rollout is a game changer as it reduces the
health risks and directly impacts the speed and extent of economic recovery. Therefore, all
countries around the world entered in a strong competition for vaccine receipt and
implementation of the vaccination process in the initial period, which was characterized also
by the non-functioning of the COVAX system, the global response system which was created
with the aim to secure fair distribution of the vaccines in the countries around the world. In this
aspect, the results of this paper are a stark reminder for the need for transparent and fair global
response regarding fair and equitable availability of vaccines to every country.

References
Acemoglu, D., García-Jimeno, C. and Robinson, J.A., 2015. State capacity and economic
development: A network approach. American Economic Review, 105(8), pp.2364-2409.
Besley, T. and Persson, T., 2010. State capacity, conflict, and
development. Econometrica, 78(1), pp.1-34.
Cingolani, L., 2018. The role of state capacity in development studies. Journal of
Development Perspectives, 2(1-2), pp.88-114.
Cingolani, L., Thomsson, K. and De Crombrugghe, D., 2015. Minding Weber more than
ever? The impacts of state capacity and bureaucratic autonomy on development goals. World
Development, 72, pp.191-207.
Hanson, J.K. and Sigman, R., 2013, September. Leviathan's latent dimensions: measuring
state capacity for comparative political research. In APSA 2011 Annual meeting paper.
Heckman, J., 1974. Shadow prices, market wages, and labor supply. Econometrica: journal of
the econometric society, pp.679-694.
Kacziba, P., 2020. Political Sources of Hungarian Soft Power. Politics in Central Europe,
16(s1), pp.81-111.
Khemani, S., 2019. What Is State Capacity?. World Bank Policy Research Working Paper,
(8734).
Lee, S.Y. and Whitford, A.B., 2009. Government effectiveness in comparative perspective.
Journal of Comparative Policy Analysis, 11(2), pp.249-281.
LAI, H., 2019. Soft Power Determinants in the World and Implications for China. The
Copenhagen Journal of Asian Studies, 37(1), pp.8-35.
Nye Jr, J.S., 2004. Soft power: The means to success in world politics. Public affairs.
Nye, J.S., 2011. The future of power. Public Affairs.
Rutland, P. and Kazantsev, A., 2016. The limits of Russia’s ‘soft power’. Journal of Political
Power, 9(3), pp.395-413.
Stojkoski, V., Utkovski, Z., Jolakoski, P., Tevdovski, D. and Kocarev, L., 2020. The socio-
economic determinants of the coronavirus disease (COVID-19) pandemic. arXiv preprint
arXiv:2004.07947.
Williams, M.J., 2018. Beyond state capacity: bureaucratic performance, policy
implementation and reform. Journal of Institutional Economics, pp.1-19.
Winship, C. and Mare, R.D., 1992. Models for sample selection bias. Annual review of
sociology, 18(1), pp.327-350.

Appendix

Table A1: Data sources and description of variables.

Variable Code Definition Data Source Note
 Confirmed COVID-19 cases per million Our World in Data, Measured in
COVID-19 cases p.m.p cases
 population Coronavirus logs
 Indication whether the country has started Our World in Data,
Started vaccination /
 with the vaccination procedure. Coronavirus Binary
 COVID-19 vaccination does administered Our World in Data, Measured in
Vaccinations p.h.p /
 per hundred people Coronavirus logs
 Oxford COVID-19
 Oxford's daily government response index Government
Government response gov_response measures the variation in daily Response Tracker,
 government responses to COVID-19. Blavatnik School of Measured in
 Government logs
 Number of days between the first vaccine
Days days and last available data for vaccinations Our World in Data,
 p.h.p. Coronavirus
 GDP at purchaser's prices is the sum of
 gross value added by all resident
GDP producers in the economy plus any
 product taxes and minus any subsidies not Measured in
 gdp included in the value of the products. WDI, World Bank logs
 This indicator provides per capita values
 for gross domestic product (GDP)
GDP per capita, PPP expressed in current international dollars
 converted by purchasing power parity Measured in
 gdp_pc_ppp (PPP) conversion factor. WDI, World Bank logs
 Exports of goods and services represent
Exports (% of GDP) the value of all goods and other market Measured in
 exports services provided to the rest of the world. WDI, World Bank logs
Health expenditures (% Level of current health expenditure Measured in
of GDP) health_exp expressed as a percentage of GDP. WDI, World Bank logs
 Military expenditures data from SIPRI are
Military expenditures (% derived from the NATO definition, which
of GDP) includes all current and capital Measured in
 military_exp expenditures on the armed forces. WDI, World Bank logs
 Captures perceptions of the quality of
 public services, civil
 service and the degree of its independence
Government
 from political
effectiveness
 pressures, quality of policy formulation
 and implementation, and credibility of the
 gov_eff government WGI, World Bank
Population (65+, % of Population ages 65 and above as a Measured in
total) pop_65 percentage of the total population. WDI, World Bank logs
 Soft power is the ability to attract and co-
Soft Power 30 opt, rather than coerce (in contrast to hard
 / power). Soft Power 30 Binary
Figure A1. Correlation matrix between the studied variables.
You can also read


