Implementation of Lean Manufacturing Process to Reduce Waste: A Case Study
←
→
Page content transcription
If your browser does not render page correctly, please read the page content below

IOP Conference Series: Materials Science and Engineering

PAPER • OPEN ACCESS

Implementation of Lean Manufacturing Process to Reduce Waste: A
Case Study
To cite this article: D Rahmanasari et al 2021 IOP Conf. Ser.: Mater. Sci. Eng. 1096 012006

View the article online for updates and enhancements.

                               This content was downloaded from IP address 46.4.80.155 on 11/09/2021 at 23:45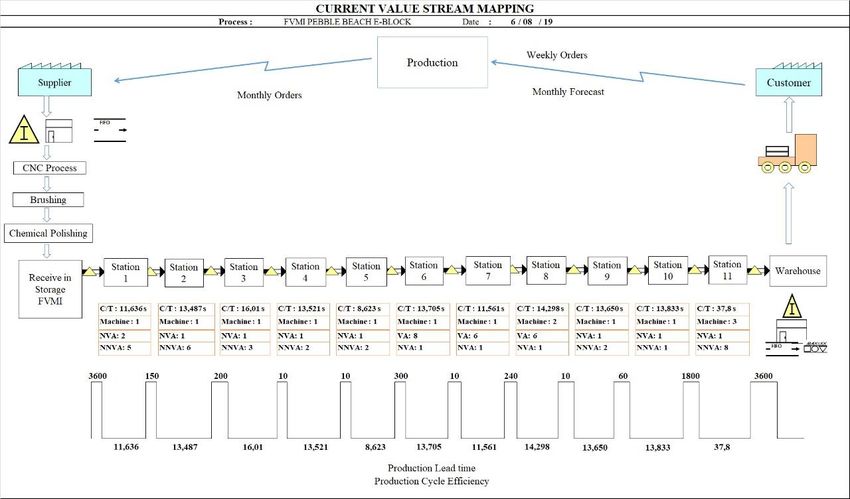
ICIMECE 2020                                                                                                             IOP Publishing
IOP Conf. Series: Materials Science and Engineering              1096 (2021) 012006           doi:10.1088/1757-899X/1096/1/012006

Implementation of Lean Manufacturing Process to Reduce
Waste: A Case Study

                     D Rahmanasari1, W Sutopo2, and J M Rohani3

                     1
                      Undergradute Program of Industrial Engineering, Faculty of Engineering, Universitas Sebelas
                     Maret, Surakarta, 57126, Indonesia
                     2
                      Department of Industrial Engineering, Faculty of Engineering, Universitas Sebelas Maret,
                     Surakarta, 57126, Indonesia
                     3
                      Universiti Teknologi Malaysia, Faculty of Engineering, School of Mechanical Engineering,
                     Department of Materials, Manufacturing and Industrial Engineering, Johor Bahru, Malaysia.
                     E-mail: diahhrahma@student.uns.ac.id1, wahyudisutopo@staff.uns.ac.id2, jafri@fkm.utm.my3

                     Abstract. Excessive waste production is often happening in the inefficient use of resources in
                     manufacturing. There is still some excessive waste found in the electronic components
                     company as a case study. It resulted from the careless use of resources and indirectly weakness
                     their market positioning. The purpose of this paper is to present an implementation of a lean
                     manufacturing process to reduce waste. This study aims to analyze and reduce the waste that
                     occurs using lean manufacturing approaches. The value stream mapping (VSM) and waste
                     relationship matrix (WRM) were applied to describe and to analyze the production flow of
                     waste. Then, a waste assessment questionnaire (WAQ) is used to determine the percentage of
                     waste that occurs. Value Stream Analysis Tools (VALSAT) is used for complete mapping
                     tools. Three methods are considered for determining the feasibility, namely, net present value,
                     internal rate of return, and profitability index. Base on analysis, we choose on the 3rd largest
                     waste to be improved. According to the data analysis, it is found that increasing the number of
                     production machines, carrying out appropriate maintenance activities, increasing training and
                     supervision, and adding work facilities are recommendations for the improved production
                     process. The proposed guidance seems to help the company reduce the seven waste and
                     increase unit production. It is expected that the production process will be more effective and
                     efficient.

1. Introduction
Companies must pay more attention to the condition of their competition with competitors. Essential
aspects should be considered in the supply chain management, including product design, material
sourcing, and selection, manufacturing processes, final product delivery to consumers, and product
management [1]. Quality products at affordable prices and timeliness following the time of absolute
demand must be met when the company wants to survive in market competition. The companies
should have some activities for increasing product value-added and for eliminating waste as well as
improving productivity [2,3]. Manufacturing companies often implement lean manufacturing to
optimize their production process due to waste activities that arise [2], [4,5]. Lean manufacturing is
the most popular approach to eliminating waste in the manufacturing industry, and it refers to the

              Content from this work may be used under the terms of the Creative Commons Attribution 3.0 licence. Any further distribution
              of this work must maintain attribution to the author(s) and the title of the work, journal citation and DOI.
Published under licence by IOP Publishing Ltd                          1
ICIMECE 2020 IOP Publishing
IOP Conf. Series: Materials Science and Engineering 1096 (2021) 012006 doi:10.1088/1757-899X/1096/1/012006
manufacturing process without waste [4]. Lean is an ongoing effort to reduce waste and increase the
added value of products to provide value to customers (customer value) [5].
The concept of Lean's thinking is oriented to the Toyota Production System (TPS), which
determines activities that have value and eliminates non-added value activities so that each step of
production adds value to the process [6]. Lean manufacturing is a powerful tool and the most effective
way to utilize the resources and reduce the waste production system [7].
Lean manufacturing is defined as a system of continuous improvement that integrates daily work in
producing and delivering products, services, and information to identify waste that affects the flow in
production, grace period, quality, and cost [8]-[10]. Popular definitions of lean manufacturing and
Toyota Production System (TPS) are a complete technique when combined and mature, which will
help to reduce and then eliminate the seven types of waste [11]. TPS has applied all aspects of lean
manufacturing objectives. This system will make the company more concise and more flexible and
more responsive by reducing waste [11]. Waste can be defined as any work activity that does not add
value to transforming inputs into outputs along the value stream [12]. The seven types of waste and
their explanation are overproduction, defects, unnecessary inventory, inappropriate processing,
excessive transportation, waiting, and unnecessary motion [13].
Regarding the implementation of lean manufacturing, companies should implement a methodology
that incorporates key factors as integrated management systems [14]-[16], strategy and culture [17],
and operations [18], which are focused on improving their performance. This study aims to increase
sustainable performance in the company by eliminating waste of activities that do not add value in the
process [19, 20, 21] and provides recommendation improvement to the company. Lean production is
aimed at creating products with many variations but still has a low cost.
2. Approaches for Implementing Lean Manufacturing Process
The approaches for analysis equipment replacement consist of four stages, i.e., problem identification
and collecting data, data analysis using five tools, namely value stream mapping (VSM); waste
relationship matrix (WRM); waste assessment questionnaire (WAQ); value stream analysis tools
(VALSAT); and failure mode and effects analysis (FMEA). Recommendation for improvement is
proposed based on feasibility analysis using three methods as follows: net present value (NPV),
internal rate of return (IRR), and profitability index (PI). Figure 1. shows the flowchart of the
implementing lean manufacturing process to solve the problem.
Problem Data Analysis (VSM, Feasibility
Recommendation
identification and WRM, WAQ, analysis for
to improvement
collecting data VALSAT, FMEA) recommendation
Figure 1. Flowchart methodology
Value stream mapping (VSM) is a map that illustrates all the steps in the work process (including
rework) related to the conversion of customer needs into a product and shows how much value is
added from each stage to the product [22,23]. The use of VSM as a process for improvement at the
system level. Then, waste relationship matrix (WRM) were applied to describe and to analyze the
production flow of waste. After the waste relationship matrix (WRM) method is completed, it is
followed by a waste assessment questionnaire (WAQ). A waste assessment questionnaire (WAQ) is
used to determine the percentage of waste that occurs. It is a proposed method that articulates the
definition of each of the seven types of waste and its impacts [24]. This method is intended not only to
help see waste but also to measure the relationship and its effects. Criteria are made to measure each
relationship's strength directly so that a waste matrix is created, which classifies each relationship
directly [24]. Value Stream Analysis Tools (VALSAT) are utilized for complete mapping tools.
2ICIMECE 2020 IOP Publishing
IOP Conf. Series: Materials Science and Engineering 1096 (2021) 012006 doi:10.1088/1757-899X/1096/1/012006
Failure Mode and Effects Analysis (FMEA) is one method of failure analysis / potential failure that
is applied in product development, system engineering, and operational management. FMEA is carried
out to analyze the potential for errors or failures in the system or process, and the identified potentials
will be classified according to the magnitude of the potential failures and their effect on the process.
3. Result and Discussion
3.1 Value Stream Mapping (VSM)
Value Stream Mapping (VSM) is made to describe all activities that give and do not add value in
material flow. This tool is an adaptation of the Toyota production system to help identify waste in the
production system. There are two types of Value Stream Mapping, i.e., current state value stream
mapping (CSVSM) to represent the current condition and future state value stream mapping (FSVSM)
to describe the proposed improvement. Figure 2 shows the result of CSVSM.
Figure 2. Current state value stream mapping (CSVSM)
To analyze the CVSM results in more detail, several performance indicators are used to measure
the level of performance in the field. For more details CVSM analysis can be seen in Table 1.
Table 1. Analysis of CSVSM
No Performance CVSM Detail Analysis
Indicators
1 High production cycle Cycle Time of all workstations is - Production time in the field runs slower than the standard time
time greater than takt time set on request
- This process is carried out by humans and is not assisted by an
automatic machine.
- Daily production target is not reached
- The production process is not appropriate, so improvements are
needed.
2 Uptime (98%) The company's standard is - The reject standard has been set by the management after
maximum production rejects 3%. calculating the various losses.
3 Time Effectiveness Total Cycle Time : 168.124 This time ratio is huge. This is because the bottle neck and waiting
Total Lead Time : 10,158.124 time are so long that most of the time is used to wait for the next
process. Improvements need to be made in order to reduce waiting
time in order to reduce lead time.
4 Material and process The amount of WIP material is too - WIP is too much because of the waiting time to go to the next
flow much process. Therefore it is necessary to make improvements.
3ICIMECE 2020 IOP Publishing
IOP Conf. Series: Materials Science and Engineering 1096 (2021) 012006 doi:10.1088/1757-899X/1096/1/012006
3.2 Waste Relationship Matrix (WRM)
The value and the results of the conversion of interrelation between waste are obtained based on the
company's weighting assessment of waste. The results of the questionnaire assessment scores are then
grouped according to the level of interrelation between waste. Furthermore, the results of the
questionnaire assessment were made into a Waste Relationship Matrix (WRM). The relationship in
each type of waste is symbolized by O (overproduction), I (inventory), D (defect), M (motion), T
(transportation), P (process), and W (waiting).
Table 2. Waste Matrix Value
F/T O I D M T P W Skor %
O 10 0 0 0 0 0 0 10 4.808
I 0 10 4 6 6 0 0 26 12.5
D 0 10 10 4 6 0 6 36 17.31
M 0 6 6 10 0 2 8 32 15.38
T 0 8 4 6 10 0 8 36 17.31
P 0 6 6 2 0 10 8 32 15.38
W 0 8 10 4 4 0 10 36 17.31
Scor 10 48 40 32 26 12 40 208 100
% 4.81 23.08 19.23 15.38 12.50 5.77 19.23 100 X
3.3 Waste Assessment Questionaire (WAQ)
The WAQ method approach is a continuation of the WRM method to assess the seven types of waste
further. The application of the WAQ method refers to the research results [24]. The steps for applying
the WAQ method areas showed at Tabel 3. Figure 3 shows the final graphs in the final value (Yj final)
ranking from Table 3.
Table 3. WAQ calculation results
O I D M T P W
Skor (Yi) 0.62 0.6358 0.667 0.7294 0.6158 0.743 0.717
Pi factor 23.1 288.46 332.8 236.69 216.35 88.76 332.8
(Yi final) 14.3 183.4 222.1 172.64 133.22 65.92 238.5
Result (%) 1% 18% 22% 17% 13% 6% 23%
Ranking 7 3 2 4 5 6 1
23% 22% 18% 17% 13% 6% 1%
W D I M T P O
Figure 3. Ranking of Waste Assessment
3.4 Value Stream Mapping Tools
Value stream mapping tools are used to map the origin of waste in the production flow in more detail.
The application of this method refers to the approach developed by ref. [25].
4ICIMECE 2020 IOP Publishing
IOP Conf. Series: Materials Science and Engineering 1096 (2021) 012006 doi:10.1088/1757-899X/1096/1/012006
Table 4. Value stream mapping tools
Mapping Tools
Supply
Process Production Quality Demand Decision
Waste/Structures Weight Chain Physical
Activity Variety Filter Amplification Point
Response Structure
Mapping Funnel Mapping Mapping Analysis
Matrix (PS)
(PAM) (PVF) (QFM) (DAM) (DPA)
(SCRM)
Overproductions 1.4 1.386 4.159 1.386 4.159 4.159
Unnecessary 17.8 53.416 160.247 53.416 160.247 53.416 17.805
Inventory
Product Defect 21.6 21.559 194.031
Unnecessary 16.8 150.842 16.760
Motion
Transport 12.9 116.406 12.934
Inappropriate 6.4 57.600 19.200 6.400 6.400
Processing
Time Waiting 23.2 208.398 208.398 23.155 69.466 69.466
TOTAL 609.607 389.564 95.771 201.817 233.872 133.440 30.739
Based on the ranking in Table 4, it is known that the most related tool processes activity mapping
(PAM). Refer to [25], and the tools must be focused on the highest-ranking tools. Therefore, the
researchers chose to use the highest tools to make detailed waste mapping; the tool processes activity
mapping.
3.5 Process Activity Mapping (PAM)
PAM is used to map the process in more detail by categorizing each process. The purpose of this
categorization is to separate and know what processes are included in value-added (VA), non-value
added (NNVA), and non-value-added (NVA). The results of the PAM that have been made are then
tabulated to facilitate the identification process—Figure 4. shows a tabulation of VA, NVA, and
NNVA percentage. Based on Figure 4 it can also be seen the comparison between value added,
non value added, and necessary but non value added activities. Value added activities have a
percentage of 33%, non value added activities have a percentage of 20%, and necessary but
non value added activities are 47%.
NVA
VA 20%
33%
NNVA
47%
Figure 4. Percentage VA, NVA, dan NNVA
5ICIMECE 2020 IOP Publishing
IOP Conf. Series: Materials Science and Engineering 1096 (2021) 012006 doi:10.1088/1757-899X/1096/1/012006
3.6 FMEA Analysis
35% 120%
30% 100%
25%
80%
20%
60%
15%
40%
10%
5% 20%
0% 0%
Waiting Defect (Skill Defect Inventory Waiting Defect
Time (less of Operator) (Machine (WIP) Time (Quality of
machine) Problem) (Material Material)
Handling)
% Cummulative %
Figure 5. RPN score
Figure 5. shows the Pareto diagram of the failure mode or failure mode of the most critical. The first is
waiting time due to lack of machine production, and the second defect is caused by inaccurate
machine set-up and lack of skilled employees, third is a defect caused by poor machine maintenance.
The fourth is the unnecessary Inventory of WIP during production due to lack of machine production.
3.7 Recommendations for Improvement
Recommendations for improvement are given to the four most significant RPN values resulting from
the FMEA analysis. The proposed improvements are as follows:
1. add the machine;
From the calculation of the RPN in the FMEA Table, it is known that the causes that influence the
type of waste waiting time and unnecessary inventory are the same, namely the main cause is due
to the lack of machine capacity in the production line. In addition, related to the analysis of takt
time which has a cycle time that is greater than takt time, which means the process runs slower
than it should. Therefore, additional capacity related to the number of machines needs to be done
in order to reduce the existing queuing time and to overcome the amount of cycle time to takt
time.
2. providing training or knowledge to workers for uniforming skills and work standards;
3. conducting directions and supervision, and;
4. perform maintenance activities in the form of preventive maintenance to avoid sudden machine
trouble so that the time required for production is not long.
Based on the results of the RPN score, the addition of machines has a dominating score and highest
score of 70. As for the other recommendations, it has a low score which can support in overcoming the
total waste problem in the company. Therefore, researchers provide recommendations that prioritize
adding machines to the production process. In addition to reducing waste, these recommendations can
also overcome the company's production targets that were not achieved due to high waiting times. By
solving the problem of waiting time as a priority problem, the company's production target can be
achieved and can achieve product demand.
Meanwhile, the other 3 recommendations can be applied by the company to reduce overall waste so
that the production process is more effective and efficient.
3.8 Feasibility Analysis
The implementation of the recommendations given is carried out, namely the production process's
addition of machines. Then an analysis of the investment feasibility of the machine on the company's
6ICIMECE 2020 IOP Publishing
IOP Conf. Series: Materials Science and Engineering 1096 (2021) 012006 doi:10.1088/1757-899X/1096/1/012006
finances. This analysis uses indicators in making alternative decisions to find the best alternative. The
indicators used are the net present value, internal rate of return, and profitability index.
Table 5. Profit of add the machine alternative
New Machine 1st year 2nd year 3rd year 4th year 5th year
Alternatives
Sales IDR IDR IDR IDR IDR
16,036,539,626.95 17,663,221,326.17 19,463,138,800.42 21,405,767,073.44 23,567,831,106.09
Direct Production IDR IDR IDR IDR IDR
Costs 8,136,102,368.16 9,208,719,450.07 10,292,449,826.04 11,354,333,562.67 12,452,650,706.93
Profit IDR IDR IDR IDR IDR
7,900,437,258.79 8,454,501,876.11 9,170,688,974.38 10,051,433,510.77 11,115,180,399.17
Indirect Production IDR IDR IDR IDR IDR
Costs 120,000,000.00 120,000,000.00 120,000,000.00 120,000,000.00 120,000,000.00
Depreciation IDR IDR IDR IDR IDR
9,350,000.00 9,350,000.00 9,350,000.00 9,350,000.00 9,350,000.00
Cash Flow Before Tax IDR IDR IDR IDR IDR
7,771,087,258.79 8,325,151,876.11 9,041,338,974.38 9,922,083,510.77 10,985,830,399.17
Tax IDR IDR IDR IDR IDR
1,942,771,814.70 2,081,287,969.03 2,260,334,743.59 2,480,520,877.69 2,746,457,599.79
Net Cash Flow IDR IDR IDR IDR IDR
5,828,315,444.09 6,243,863,907.08 6,781,004,230.78 7,441,562,633.08 8,239,372,799.37
Profit Margin 36.34% 35.35% 34.84% 34.76% 34.96%
BEP IDR IDR IDR IDR IDR
8,265,452,368.16 9,338,069,450.07 10,421,799,826.04 11,483,683,562.67 12,582,000,706.93
BEP UNIT 1,822,189.68 1,871,506.62 1,898,822.25 1,902,085.85 1,894,549.33
It was based on the calculation of net cash flow using a minimum attracted rate of return (MARR) is
10% resulting in an NPV of IDR 34.8 Billion. It shows that the calculation result is positive, which
shows that the investment in adding new machines to the production process is feasible. The
feasibility of adding fixed machine investment according to the profitability index (PI) method to
calculate the ratio between the value of future net cash flows with the present investment value. Based
on the PI calculation above, it is 5.90 showing that the investment in adding a new machine is feasible.
We also get a 24.21% internal rate of return (IRR). Based on an analysis of existing financial
projections, it can be found that the investment plan for adding new machines is feasible. Based on
Net Present Value (NPV), the addition of machines IDR 34.8 billion. The Profitability Index of adding
a new machine is only 5.90. The internal recovery interest rate is 24.21%. Within five years, the
company's alternative to adding new machines to reduce waste in the production process is feasible.
3.9 The Comparison before and after implementation
Table 5 shows the result of the comparison between the implementation before and after improvement.
After making improvements, it is proven that the company's profit has increased by 58.29% from the
previous.
Tabel 6. Comparison of before and after implementation
Aspect Before After
Unit/day 6125 10796
Sales for five years IDR62,003,471,202.57 IDR98,136,497,933.08
Direct Production Cost for five
IDR32,507,127,500.90 IDR51,444,255,913.87
years
Profit per 5 years IDR29,496,343,701.67 IDR46,692,242,019.21
7ICIMECE 2020 IOP Publishing
IOP Conf. Series: Materials Science and Engineering 1096 (2021) 012006 doi:10.1088/1757-899X/1096/1/012006
There are seven types of waste identified: waste product defects, waiting time, unnecessary
inventory, unnecessary motion, overproduction, transportation, and inappropriate processing.
Based on the value stream mapping and waste assessment model, the highest-ranking of waste
is waiting time with a percentage of 23%, defect with a 22% discount, and inventory with a rate
of 18%. The types of waste identified, as for the most influential factors in causing waste to
occur for waiting time. The waste waiting time here is the lack of machines on the production
line, resulting in a difference in processing time, which causes the waiting time of the material
to enter the next process. Besides, waste waiting time is also due to the material handling
transportation time between work stations.
The cause of product defects in the actuator is the presence of excessive pressure on the
material, impulses, and the presence of material that falls during the production process due to
the lack of ergonomics of production facilities and equipment used. Defects also occur caused
by the operators are less thorough, less focused, and less skilled in doing the product production
process. Based on the material, the problem is caused by inappropriate material. Unnecessary
Inventory (WIP) The cause of unnecessary waste inventory (WIP) is the lack of machines and
operators, thus causing WIP. Machines that have different cycle times between stations cause
waiting time in the next process. Based on FMEA analysis, the improvement that has the
highest rating is to increase the number of machines. Companies can reduce production time, so
that company productivity increases and will get more benefit. The company can consider
alternatives to adding new machines by proposing an appropriate financing scheme. After
adding the machines, the company can improve the operating system by referring to the new
machines purchased.
4. Conclusion
This paper presents a case study for implementing a lean manufacturing process in the
electronic components company as a case study. This article proposed a data analysis
framework using VSM, WRM, WAQ, VALSAT, and FMEA tools. The proposed guidance
seems to help the company reduce the seven waste and increase unit production. The investment
was analyzed using NPV, IRR, and profitability index. An investment feasibility analysis is
carried out, which can be used to prove the feasibility of the proposed addition of new
production machines. It is expected that the production process will be more effective and
efficient. Therefore, future research is needed to analyze the seven existing wastes, increase
company productivity, and improve company performance.
Reference
[1] Alfarisi S and Sutopo W 2019 Proc. Int. Conf. on Simulation of Green Operations
Supply Chain in Waste of Plastic, IOP Conference Series: Materials Science and
Engineering vol 495 (Sarawak: CUTSE 2018)
[2] Womack J and Jones D 2003 Lean Thinking (New York: Simon - Schuster)
[3] Purwani A, Hisjam M and Sutopo W 2020 Municipal solid waste logistics management:
A study on reverse logistics. InAIP Conference Proceedings 2020 Apr 13 (Vol. 2217,
No. 1, p. 030181). AIP Publishing LLC. (Surakarta: ICIMECE 2019)
[4] Suresh R, Ganesan K and Prasad M 2013 An optimal balancing of multiple assembly line
for a batch production unit Int. J. Lean Think 4 22–32
[5] Gasperz V 2007 Lean Six Sigma for Manufacturing and Service Industries (Jakarta: PT.
Gramedia Pustaka Utama)
[6] Prasad M, Ganesan K, Paranitharan K and Rajesh R 2019 An analytical study of lean
implementation measures in pump industries in India Int. J. Enterprise Network
Manage 10 133–151
[7] Lin CK, Helmi SA, Hisjam M and Ali A 2020 Implementation of lean manufacturing in
an electronic assembly company. In AIP Conference Proceedings 2020 Apr 13 (Vol.
2217, No. 1, p. 030198). AIP Publishing LLC. (Surakarta: ICIMECE 2019)
8ICIMECE 2020 IOP Publishing
IOP Conf. Series: Materials Science and Engineering 1096 (2021) 012006 doi:10.1088/1757-899X/1096/1/012006
[8] Vinodh S, Arvind K, and Somanaathan M 2010 Application of value stream mapping in
an Indian camshaft manufacturing organization J. Manufacturing Tech. Management
21 888-900
[9] Santos G, Barbosa J 2006 QUALIFOUND - a modular tool developed for Quality
Improvement in Foundries J. Manufacturing Tech. Management 17 351-362
[10] Marques C, Lopes N, Santos G, Delgado I and Delgado P 2018 Improving operator
evaluation skills for defect classification using training strategy supported by attribute
agreement analysis J. Measurement 119 129–141
[11] Wilson, L 2010 How to Implement Lean Manufacturing (USA: McGraw-Hill)
[12] Liker, J 2006 The Toyota Way (Jakarta : Erlangga)
[13] Hines P and Taylor D 2000 Going Lean: A Guide to Implementation (Cardiff: Lean
Enterprise Research Centre)
[14] Jimenez G, Novoa L, Ramos L, Martinez J and Alvarino C 2018 Diagnosis of Initial
Conditions for the Implementation of the Integrated Management System in the
Companies of the Land Cargo Transportation in the City of Barranquilla (Colombia),
HCI International 2018 – Posters' Extended Abstracts vol 852 (Springer Cham: HCI
2018) pp 282-289
[15] Jimenez G 2014 Procedimientos para el mejoramiento de la calidad y la implantación de
la Norma ISO 9001 aplicado al proceso de asesoramiento del Centro de
Investigaciones y Desarrollo Empresarial y Regional en una Institucion de Educacion
Superior basados en la gestion por procesos, Congreso de Gestion de la Calidad y
Proteccion Ambiental GECPA 2014 (Cuba: GECPA 2014) pp 1–22.
[16] Jimenez G, Hernandez L, Hernandez H, Cabas L and Ferreira 2018 Evaluation of Quality
Management for Strategic Decision Making in Companies in the Plastic Sector of the
Colombian Caribbean Region Using the TQM Diagnostic Report and Data Analysis,
HCI International 2018 – Posters' Extended Abstracts vol 852 (Springer Cham: HCI
2018) pp 273-280
[17] Jimenez G and Zapata E 2016 Metodologia integrada para el control estratégico y la
mejora continua, basada en el Balanced Scorecard y el Sistema de Gestión de
Calidad: Aplicacion en una organizacion de servicios en Colombia, 51a Asamblea
Anual del Consejo Latinoamerica-no de Escuelas de Administracion CLADEA 2016
(Medellin: CLADEA 2016) pp 1–20
[18] Troncoso A, Neira D, Ortíz M, Jiménez G and Hernández H 2018 Using Discrete-Event-
Simulation for Improving Operational Efficiency in Laboratories: A Case Study in
Pharmaceutical Industry, Advances in Swarm Intelligence ICSI 2018 vol 10942
(Springer Cham: ICSI 2018) pp 440-451
[19] Meade D, Kumar S, Houshyar A 2006 Financial analysis of a theoretical lean
manufacturing implementation using hybrid simulation modeling J. Manufacturing
Systems 25 137–52
[20] Doolen T and Hacker M 2005 A review of lean assessment in organizations: an
exploratory study of lean practices by electronics manufacturers J. Manufacturing
Systems 24 55–67
[21] Hobbs D 2004 Lean manufacturing implementation: a complete execution manual for
any size manufacturer (Florida: J. Ross Publishing)
[22] George M 2002 Lean Six Sigma: combining Six Sigma quality with lean speed (New
York: McGraw-Hill Companies)
[23] Rother M, and Shook J 2003 Learning to See Value Stream Mapping ti Create Value and
Elimite Muda (USA: The Lean Enterprise Institute, Inc)
[24] Rawabdeh I 2005 A Model for The Assessment of Waste in Companies J. Operations
and Production Management 25 800-822
[25] Hines P and Rich N 1997 The Seven Value Stream Mapping Tools J. Operation and
Production Management 17 46-64
9You can also read