PROJECT CEPHS AND CHEFS - OCTOPUS, SQUID, CUTTLEFISH, SUSTAINABLE FISHERIES AND CHEFS
←
→
Page content transcription
If your browser does not render page correctly, please read the page content below
PROJECT CEPHS AND CHEFS – OCTOPUS, SQUID,
   CUTTLEFISH, SUSTAINABLE FISHERIES AND CHEFS

                            TECHNICAL REPORT

                       Retailer and Consumer Survey
                  (WP5 – Value Chain: From Producers to Consumers;
                      Action 5.3 Retailer and Consumer Survey)

Data collection
December 2019
Report
October 2020

                              Data analysis and Technical Report by Dr. Cristina Pita,
                                        Dr. Katina Roumbedakis, Dr. Teresa Fonseca
                                    Partner #2: University of Aveiro (UAVR), Portugal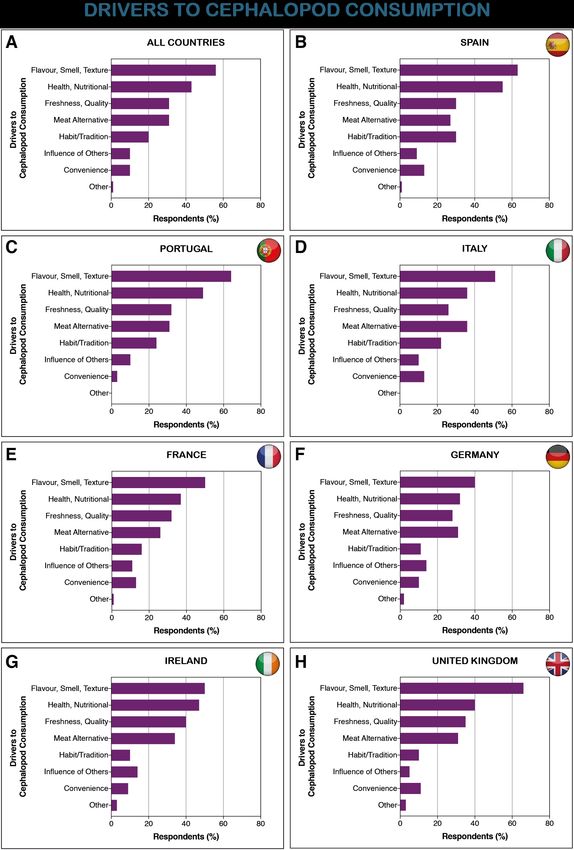
WP 5 Value chain: from producers to consumers | Action 5.3 Retailer and consumer survey

Quadro com ISBN info

                                                                                                     2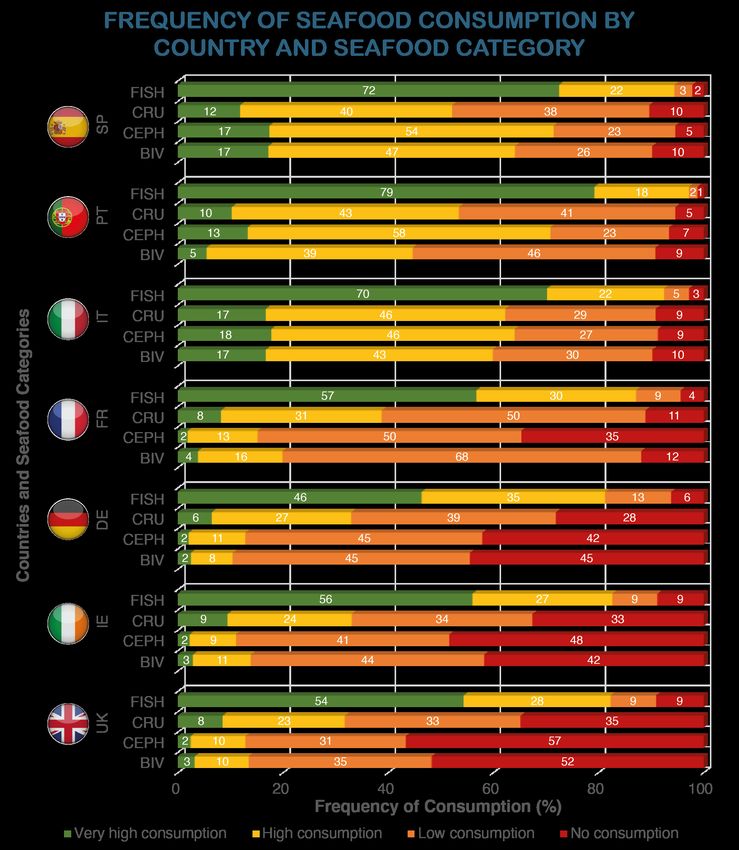
WP 5 Value chain: from producers to consumers | Action 5.3 Retailer and consumer survey

                                           Project identification
Project Name             'Cephs and Chefs – Octopus, Squid, Cuttlefish, Sustainable Fisheries and Chefs'
Acronym                  EAPA_282/2016
Code Number              CephsandChefs
Start date               2017-12-01
End date                 2021-04-30 (5 months extension)
Project duration         41 months
                                           Partner identification
Partner name             University of Aveiro
Partner number           2
Country                  Portugal
                                             Contact persons
Principal Investigator Dr. Cristina Pita
E-mail                   c.pita@ua.pt
Postdoc fellow           Dr. Katina Roumbedakis
E-mail                   katina.roumbedakis@ua.pt
                                            Task identification
WP number                5
WP name                  Value chain: from producers to consumers
Action number            5.3 Retailer and consumer survey
Action description       Led by USC with UAVR, retailer and consumer survey will be used to determine
                         frequency of cephalopod consumption and improve knowledge about
                         consumer trends (e.g. ready meals, processed foods) and the willingness of
                         consumers to pay for certified products in the different regions of the Atlantic
                         Area, to ultimately increase the consumption of sustainable cephalopods.
                         These results will feed into international Trade events (WP6.2) and marketing
                         development strategies (WP7.1).
                                                Deliverables
Outputs title            Retailer and consumer attitude survey
Outputs description      Survey to identify most consumed cephalopods products, consumption
                         opportunities, openness to new products, etc.

                                                                                                            3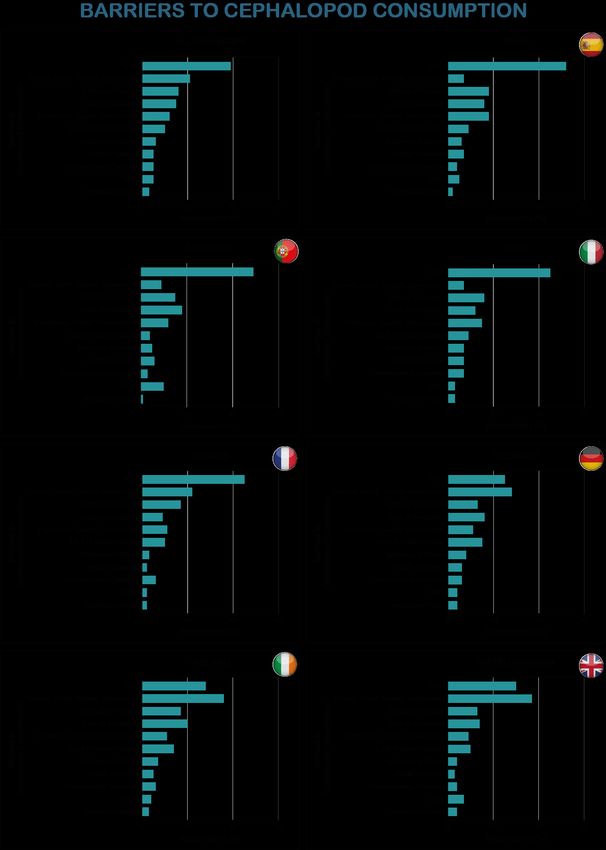
WP 5 Value chain: from producers to consumers | Action 5.3 Retailer and consumer survey

                                                                                     4
WP 5 Value chain: from producers to consumers | Action 5.3 Retailer and consumer survey

TABLE OF CONTENTS
EXECUTIVE SUMMARY ..................................................................................................................7
INTRODUCTION...............................................................................................................................9
DATA COLLECTION ......................................................................................................................10
1.    Survey Structure and Questions ........................................................................................10
2.    Seafood Categories...............................................................................................................12
3.    Data Analysis ..........................................................................................................................12
I. SOCIO-ECONOMIC AND DEMOGRAPHIC CHARACTERISTICS OF THE SURVEY’S
RESPONDENTS..............................................................................................................................13
II.   CONSUMER HABITS REGARDING FISHERY PRODUCTS............................................15
1.    Frequency of Seafood Consumption .................................................................................15
1.1 Frequency of Cephalopod Consumption ..........................................................................18
1.1.1       Cephalopod Consumption by Gender ........................................................................18
1.1.2       Cephalopod Consumption by Age ...............................................................................19
1.1.3       Cephalopod Consumption by Annual Household Income......................................20
2.    Local of Seafood Consumption...........................................................................................21
2.1 Local of Cephalopod Consumption ...................................................................................22
III. PREFERENCES REGARDING FISHERY PRODUCTS TYPE ..........................................23
IV. DRIVERS AND BARRIERS TO CEPHALOPOD CONSUMPTION ..................................28
1.    Drivers to Cephalopod Consumption ................................................................................28
2.    Barriers to Cephalopod Consumption ..............................................................................30
V.    FACTORS INFLUENCING PURCHASE DECISION OF SEAFOOD ...............................32
1.    Price of Products ...................................................................................................................32
2.    Origin of Products .................................................................................................................33
3.    Wild vs Farmed Products .....................................................................................................35
VI. RELEVANT INFORMATION ON SEAFOOD LABELS.......................................................37
VII. WILLINGNESS TO TRY DIFFERENT SPECIES AND NEW FORMATS AND
PRESENTATION OF CEPHALOPOD PRODUCTS ...................................................................41
CONCLUSIONS ..............................................................................................................................43
ACKNOWLEDGEMENTS ..............................................................................................................44
REFERENCES .................................................................................................................................44

                                                                                                                                              5
WP 5 Value chain: from producers to consumers | Action 5.3 Retailer and consumer survey

                                                                                     6
WP 5 Value chain: from producers to consumers | Action 5.3 Retailer and consumer survey

EXECUTIVE SUMMARY
   •   The retailer and consumer survey included a balanced number of adult men and women, with
       varied age. A majority of respondents have up to 3 family members, with an annual household
       income up to 30,000 €/£, and live up to 60 km from the coast.

   •   Almost two thirds of the consumers eat fish at least once a week, however, the consumption of
       other fisheries products, such as crustaceans, cephalopods and bivalves, is much lower.

   •   Spain, Portugal and Italy are the countries with higher consumption of all seafood categories.

   •   Men consume cephalopods slightly more frequently than women.

   •   Cephalopod consumption vary considerably from country and age range.

   •   A majority of people consume fisheries product at home.

   •   A majority of Spanish, Portuguese, Italians and French consumers eat cephalopods at home,
       while Irish, German and British consumers eat cephalopods mostly during holidays abroad.

   •   Around a third of the respondents prefer to buy fresh seafood, but fillets, clean and frozen
       products are also frequently bought.

   •   A majority of the respondents consume cephalopods because they like the flavour, smell and/or
       texture and because of they consider this seafood healthy and with nutritional benefits.

   •   For Spanish, Portuguese, Italians and Frenchs the main barrier for not consuming cephalopods is
       the price, whereas, most of the Irish, German and British respondents don’t like the flavour,
       smell, texture and appearance of these molluscs.

   •   Seafood origin is by far the most relevant information on seafood labels, being very relevant for
       four in ten consumers. However, information about environment/sustainability, health and
       nutritional values and animal welfare is also very relevant from almost a third of seafood
       consumers.

   •   Around a fifth of the consumers would like to try new cephalopod species and
       products/presentations.

Keywords: Consumption, consumer survey, preferences, (cultural) habits, perception, crustacean,
cephalopods, seafood, bivalves, Atlantic Ocean, Europe

                                                                                                        7
WP 5 Value chain: from producers to consumers | Action 5.3 Retailer and consumer survey

                                                                                     8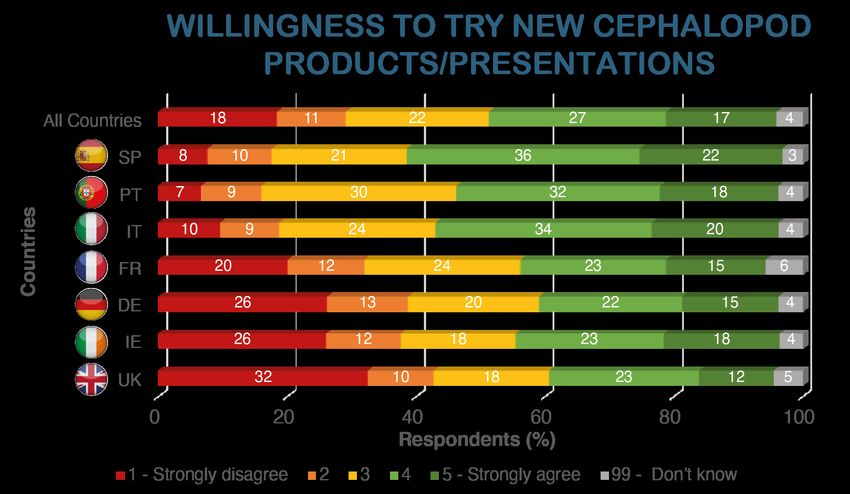
WP 5 Value chain: from producers to consumers | Action 5.3 Retailer and consumer survey

INTRODUCTION

Seafood consumption is increasing worldwide, especially in the developed world. The European Union
(EU), with an average consumption of 25.1 kg per capita, is one of the largest consumer markets of
fisheries products worldwide (REF FAO?). The EU market is also one of the most important markets in
the world for cephalopods (i.e., octopus, squid and cuttlefish), especially in southern Europe where
cephalopods are consumed as part of the traditional diet (REF).
Various studies regarding seafood consumption have been carried out (e.g., Carlucci et al., 2015). There
are various reasons for consuming seafood. Seafood can be considered a protein alternative to meat
and/or a lower-impact choice (sustainable motivation), and drivers for seafood consumption include
health, taste, convenience, a desire for diet variety (Birch et al., 2012). Preferences to purchase familiar
types of seafoods can also influence consumption and limit demand for diverse seafood types1. On the
other hand, the main barriers to seafood intake include price, concerns regarding origin and freshness,
difficulty in evaluating seafood quality, and not liking the taste or texture (Birch et al., 2012). Even so,
some issues can be considered by some as barriers, whereas other consumers may consider it as a reason
to consume seafood, for example in terms of sustainability (references).
This Technical Report is a summary of the results obtained from a retailer and consumer attitude survey
carried out under the scope of the project ‘Cephs and Chefs – Octopus, Squid, Cuttlefish, Sustainable
Fisheries and Chefs’, more specifically, of the action 5.3 ‘Retailer and consumer survey’ of the WP 5
‘Value chain: from producers to consumer’. The task was led by the partner #2, UAVR.
The main objectives of the survey were to:
      §    Determine seafood consumption habits and product preferences regarding seafood across
           different European countries;
      §    Evaluate drivers and barriers for seafood consumption;
      §    Understand which factors influence seafood purchase decision;
      §    Explore label information preferences;
      §    Investigate consumers’ willingness to try different species and formats/presentations of
           cephalopod products.

1
    https://sustainablefisheries-uw.org/seafood-consumption-statistics/

                                                                                                               9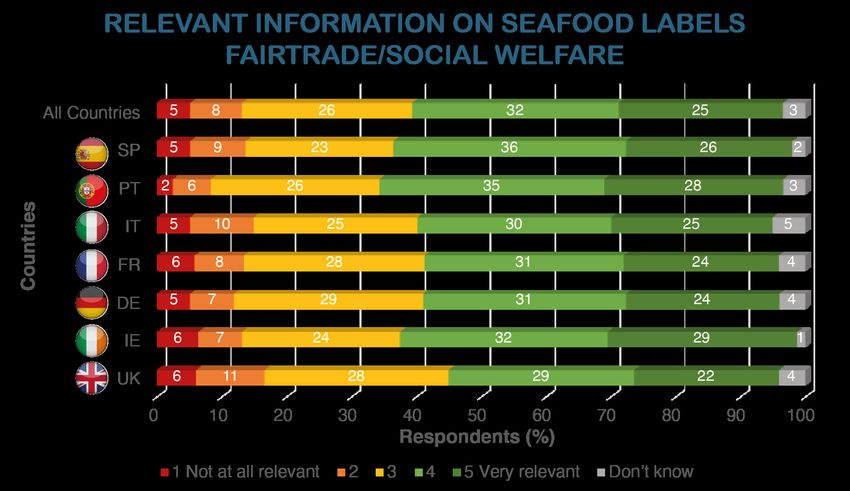
WP 5 Value chain: from producers to consumers | Action 5.3 Retailer and consumer survey
DATA COLLECTION
1. Survey Structure and Questions
The retailer and consumer attitude survey was carried out in December 2019 (pre-COVID-19) by the
Brandspeak company . A total of 3,517 respondents with different social, economic and demographic
categories from seven countries (i.e., France, Germany, Ireland, Italy, Portugal, Spain and United
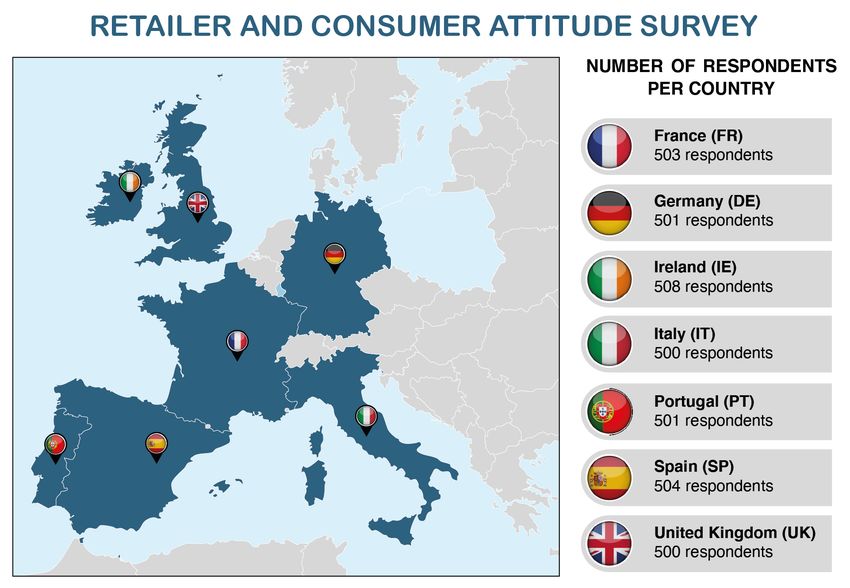
Kingdom) provided their answers regarding seafood consumption (Figure 1). These countries were
selected because most of them are located in the INTERREG Atlantic Arc (France, Ireland, Portugal, Spain
and United Kingdom) and because of their different cultural habits, including the tradition or not of
seafood consumption. Although Italy and Germany are not included in the INTERREG Atlantic Arc, these
countries were also included in this survey because of the important consumption of cephalopods and
high prevalence of environmentally aware consumers, respectively.
Figure 1. Countries included in the online consumer survey (France, Germany, Ireland, Italy, Portugal,
Spain and United Kingdom) and the respective number of respondents per country. Total number of
respondents: 3,517. Note: In this report, the abbreviations used for each country correspond to their
official abbreviation and are provided in parenthesis.
The survey was carried out online and collected information about: i. seafood consumption habits
(frequency and location of consumption); ii. drivers (reasons) and barriers for seafood consumption (e.g.,
nutritional value, health concerns, freshness, convenience, flavour and tradition); iii. factors influencing
seafood purchase decision (including price, origin, type and presentation of products); iv. label
information (such as sustainability, origin of products, health and nutritional values, cooking
recommendation, social and animal welfare concerns); v. the willingness to try different species and new
formats/presentations, relatively to cephalopods. In addition, socioeconomic and demographic
characteristics of the consumers were also collected.
10WP 5 Value chain: from producers to consumers | Action 5.3 Retailer and consumer survey
The Cephs and Chefs retailer and consumer survey was inspired in the Eurobarometer surveys2.
However, here, for the majority of the questions, people were asked to provide their opinions
considering different seafood categories (see section ‘Seafood Categories’ for details).
The questionnaire consisted in six major questions regarding seafood consumption (and the respective
options of answers – in italics) as follows:
• Q1. How often, if at all, do you eat each of the following seafood categories?
More than once a week; Once a week; Every 2 - 3 weeks; Once a month; 4-6 times a year; 1-3 times
a year; Less than once a year; Never.
• Q2. Where do you usually eat the following seafood categories (please answer for all categories of
seafood)?
At home; At restaurants (in my country); When on holidays abroad; Other.
• Q3. What are the main reasons why you consume each type of seafood? Please select the 3 main
reasons for each type.
I like the flavour, smell, texture; Its freshness and quality; It is healthy and has nutritional benefits;
Its convenience (it is easy or quick to prepare); Habit/tradition (I eat it since childhood); Influence of
others in the household; As an alternative to meat; Other.
• Q4. What are the main barriers to your consumption of …? (at least one answer per seafood
category is required)
I do not like the flavour, smell, texture, appearance; Lack of freshness, quality, quick deterioration;
Health concerns; Difficult to prepare; Lack of habit/tradition (I am not used to eat it); Influence of
others in the household; Price; Lack of availability; Environmental concerns (hence prefer not to eat);
I’m vegetarian/vegan; Other.
• Q5A. When buying seafood (fish or shellfish), to what extent does PRICE influences your purchase
decision? Please use a scale of 1 to 5, where 1 means it would definitely not influence your purchase
decision and 5 means it definitely would influence your purchase.
The price of the seafood.
• Q5B. When buying seafood (fish or shellfish), how would the following characteristics influence your
purchase decision? Please use a scale of 1 to 5, where 1 means I would definitely not buy and 5
means I would definitely buy.
Local origin seafood; National origin seafood; Foreign origin seafood from inside the EU; Foreign
origin seafood from outside the EU; Wild caught seafood; Farmed/aquaculture seafood.
• Q5C. When you buy seafood (fish or shellfish), how often do you buy the following? Please use a
scale of 1 to 5, where 1 means I never buy it and 5 means I always buy it.
Fresh product; Frozen product; Salted/dried product; Smoked product; Canned product; Whole body;
Clean product (e.g., head, scales, shell removed); Fillets; Unprocessed seafood; Ready-to-eat seafood
meal.
• Q5D. When buying seafood (fish or shellfish), to what extent the below label information would be
relevant to you? Please use a scale of 1 to 5, where 1 means not at all relevant and 5 means very
relevant.
To have environmental/sustainability information on the label; To have origin information on the
label; To have health & nutrition value information on the label; To have cooking recommendations
2
https://ec.europa.eu/commfrontoffice/publicopinion/index.cfm/survey/getsurveydetail/instruments/special/surveyky/220
6
11WP 5 Value chain: from producers to consumers | Action 5.3 Retailer and consumer survey
on the label; To have animal welfare concerns information on the label; To have information about
Fairtrade/social welfare concerns on the label.
• Q6. Regarding octopus/squid/cuttlefish, to what extent do you agree or disagree with the following
statements? Please use a scale of 1 to 5, where 1 means you strongly disagree and 5 means strongly
agree.
I would be willing to try different species; I would be willing to try new formats and presentation (e.g.,
octopus carpaccio, smoked octopus).
2. Seafood Categories
In the first part of the survey (Q1-4), the consumers were asked to
provide their opinions regarding different topics of the questionnaire
considering various seafood categories, namely, fishes, crustaceans,
cephalopods and bivalves (see image on the right for details of each
category).
Although these questions are relative to each one of these seafood
categories, this technical report will focus mainly in the results
obtained for cephalopods.
3. Data Analysis
The first two questions of the survey, regarding frequency (Q1) and location (Q2) of consumption, were
analysed considering the different seafood categories. The following questions, about the drivers (Q3)
and barriers (Q4) for seafood consumption were analysed focusing on cephalopods. In the question
regarding factors influencing purchase decision when buying seafood (fish or shellfish) (Q5), the price
(Q5A), six different origin of products (Q5B; e.g., local origin, national origin, wild caught), ten types of
products (Q5C; e.g. fresh, frozen, salted) and six different label information (Q5D; e.g.,
environmental/sustainability, origin, health and nutrition value, cook recommendations, fair trade) were
analysesd. Finally, regarding willingness to try (WTT) new species and new formats/presentations of
cephalopod products (Q6), participants had to answer to what extent they agree or disagree with 2
statements: “I would be willing to try different species” and “I would be willing to try new formats and
presentation”. Questions Q1, Q2 and Q4 allowed multiple answers. Questions Q5A/Q5B/Q5C/Q5D were
randomized, as well as the attributes per question. For more information regarding (methodology of)
questionnaire, see Annex.
Socio-economic data from the individual participants was also collected. Information included age,
gender, region, proximity to coast (Q7), educational level (Q8),annual household income before tax (Q9),
number of family members (Q10) and number of children (WP 5 Value chain: from producers to consumers | Action 5.3 Retailer and consumer survey
I. SOCIO-ECONOMIC AND DEMOGRAPHIC CHARACTERISTICS OF THE
SURVEY’S RESPONDENTS
The retailer and consumer survey included a balanced number of adult men and women, with varied
age. A majority of respondents have up to 3 family members, with an annual household income up to
30,000 €/£, and live up to 60 km from the coast.
For each respondent, socio-economic and demographic information was collected, namely: country,
region, gender, age, education level, work, annual household income (before tax), number of people and
children in household and proximity from the coast.
Gender balance was assured in the retailer and consumer attitude survey, with a proportion of nearly
five in ten adult female (47.5%; n=1672) and male (52.5%; n=1845) respondents (Figure 2A).
The respondents of the survey have varied age. Three major age groups are identified with similar
proportions: individuals between 18-34 years old, representing 28.2% (n=991) of the respondents;
participants aged between 35-54 years, representing 37.1% (n=1304); and people with 55 years or more,
representing the remaining 34.7% (n=1222) of the sample (Figure 2B).
Almost six in ten respondents (56.2%; n=1975) have an annual household income up to 30,000 euros (€)
for European countries/pounds (£) for the UK. The remaining 43.8% of the participants earn between
30,000-50,000 €/£ (27.2%; n=955) or more than 50,000 €/£ (16.7%; n=587) annually (Figure 2C).
Regarding the highest level of education, more than eight in ten respondents (85%; n=3001) have at
least upper secondary education. Only 0.7% of the respondents (n=26) reported to have no formal
education while 14% (n=490) have completed primary or lower secondary education (Figure 2D).
The number of family members was very variable, with the majority of the respondents (72.3%; n=2617)
having up to 3 family members (Figure 2E). Around five in ten participants did not have children (52.7%;
n=1855), nearly two in ten (15.8%; n=556) respondents have one children and a similar proportion
(14.4%) have two or more children at the house (data not shown).
Finally, respondents were asked about how far they live from the coast. Regarding proximity to the coast,
a total of 2,047 individuals (58.2%) reported to live up to 60 km from the coast, while 1,470 (41.2%) live
at a distance of 61 km or more from the sea (Figure 2F).
13WP 5 Value chain: from producers to consumers | Action 5.3 Retailer and consumer survey
Figure 2. Summary of socio-economic and demographic characteristics of the survey’s respondents. All
variables are presented in percentage (%). A. Gender (Female; Male); B. Age (18-34; 35-54; 55 or more
years old); C. Annual Household Income (50,000 €/£; *Values in Euros (€),
except for UK, where values are in Pounds (£)); D. Highest Educational Level (No formal; Primary; Lower
Secondary; Upper Secondary; Univeristy Degree; Post-graduate); E. Number of Family Members
(including children) in Household (1; 2; 3; 4; 5; 6 or more); F. Proximity to the Coast (0-10; 11-20; 21-40;
41-60; 61 km or more).
14WP 5 Value chain: from producers to consumers | Action 5.3 Retailer and consumer survey
II. CONSUMER HABITS REGARDING FISHERY PRODUCTS
1. Frequency of Seafood Consumption
Almost two thirds of the consumers eat fish at least once a week, however, the consumption of other
fisheries products, such as crustaceans, cephalopods and bivalves, is much lower.
Respondents were first asked how frequently they consume fisheries products by seafood category. Data
regarding frequency of seafood consumption was collected according to an 8-level category, from most
frequently ‘More than once a week’ to ‘Never’ (for details, see section ‘Data collection’, Q1). To facilitate
visualization and interpretation of data, this information was transformed and reduced to a 4-level
category: Very high consumption (gathering the answers ‘More than once a week’ and ‘Once a week’);
High consumption (for people consuming seafood ‘Every 2-3 weeks’ or ‘Once a month’); Low
consumption (for the categories ‘4-6 times a year’, ‘1-3 times a year’, ‘Less than once a year’); No
consumption (for people that ‘Never’ consume seafood). Frequency of seafood consumption by
categories from all countries and by country are presented in Figures 3 and 4, respectively.
Figure 3. Frequency of Seafood Consumption (%) by Categories (Q1), including all countries. Base: All
respondents (n=3,517).
15WP 5 Value chain: from producers to consumers | Action 5.3 Retailer and consumer survey
Spain, Portugal and Italy are the countries with higher consumption of all seafood categories.
Figure 4. Frequency of Seafood Consumption (%) by Countries and Categories (Q1). Seafood categories:
Fishes (FISH), Crustaceans (CRU), Cephalopods (CEPH) and Bivalves (BIV). Base: All respondents
(n=3,517). Note: From this point, the order of the countries is re-organized to facilitate visualization and
interpretation of the data. Countries will be referred to Southern (Spain, Portugal, and Italy), Western
(France and Germany) and Northern European (Ireland) countries and the United Kingdom.
16WP 5 Value chain: from producers to consumers | Action 5.3 Retailer and consumer survey
There are significant differences on the consumption of different seafood categories at country level
(Figure 4). Southern European participants (Spanish, Portuguese and Italians) present similar profiles,
eating seafood products much more frequently than consumers from Western (French and German) and
Northern Europe (Irish) and the UK: more than half of them eat all seafood categories at least once a
month. On the other hand, French, Irish, German and British participants also present similar profiles,
consuming much less seafood products, especially crustaceans, cephalopods and bivalves. The overall
consumption of each seafood category and the most relevant results by country are summarized below.
Fishes | Almost nine in ten respondents (88.2%) have a very high to high consumption
of fisheries products, eating fish at least once a month. On the other hand, the
percentage of respondents that never eat fish is very low (4.9%) (Figure 3).
When analysed by countries, at least seven in ten Spanish (72%), Portuguese (79%) and
Italian (70%) consumers have a very high consumption, eating fish at least once a week,
while for the French, Irish, German and British consumers this percentage vary between 46-57%. The
proportion of respondents that never consume fish vary between 1.2% (PT) and 9.1% (UK) (Figure 4).
Crustaceans | The consumption of crustaceans is much less frequent than fishes.
Around four in ten (43.5%) respondents eat crustaceans at least once a month, while
almost two in ten (18.8%) participants never eat these products (Figure 3).
Southern European consumers (63% of the Italians, 53% of the Portuguese and 52% of
the Spanish) consume crustaceans quite frequently (at least once a month) while only
a third of the French, Irish, German and British consumers have very high to high consumption of these
products. The proportion of participants that never consume crustaceans vary between 5% (PT) and 35%
(UK) (Figure 4).
Cephalopods | Cephalopods are also much less frequently consumed than fishes, with
almost four in ten (36.8%) of the respondents eating these products at least once a
month. In addition, among all seafood categories, cephalopods have the highest
percentage of people that never eating them (29%) (Figure 3).
Cephalopods represent the most diverse seafood category among countries. More than
six in ten Southern European consumers (71% of the Spanish and Portuguese and 64% of Italians)
consume cephalopods at least once a month. On the contrary, only slightly more than one in ten Western
and Northern European and British consumers (11-15%) consume cephalopods frequently and a high
number of respondents from these countries (35-57%) never eat those products (Figure 4).
Bivalves | Overall, bivalves are the seafood category least frequently consumed: 32.2%
of the consumers reported to eat this product once a week or more and 25.6% of the
participants never consume them (Figure 3).
Again, Southern European consumers are the ones who eat bivalves more frequently:
64% of Spanish, 44% of Portuguese and 60% of Italians consume these molluscs once a
month or more, while these values reach a maximum of 20% for consumers from other countries. Also,
the proportion of respondents that never consume bivalves is much higher among Irish (42%), German
(45%) and British (52%) consumers (Figure 4).
17WP 5 Value chain: from producers to consumers | Action 5.3 Retailer and consumer survey
1.1 Frequency of Cephalopod Consumption
1.1.1 Cephalopod Consumption by Gender
Men consume cephalopods slightly more frequently than women.
In general, men seem to eat cephalopods slightly more frequently than women. Differences are more
evident in Spain, Portugal, France, Germany and United Kingdom. In these countries, among people with
very high to high consumption of cephalopods, men eat from 3 (FR) to 8% (PT) more cephalopods than
women. Still, considering consumers that eat cephalopod at least once a month, Irish women eat
cephalopods slightly more frequent (2%) than men, while Italians have similar consumption between
male and female consumers. The proportion of women that never consume this seafood item is higher
than men for all countries, with more markedly differences for Portuguese (6%), French (5%), German
(14%) and British (13%) consumers (Figure 5).
Figure 5. Frequency of Cephalopod Consumption (%) by Country and Gender (Q1). Base: Respondents
who consume cephalopods (n=2,497).
18WP 5 Value chain: from producers to consumers | Action 5.3 Retailer and consumer survey
1.1.2 Cephalopod Consumption by Age
Cephalopod consumption vary considerably from country and age range.
Considering people that consume cephalopods on a regular basis (very high to high consumption),
younger consumers from Spain, Portugal and Germany eat cephalopod less frequently than the older
generation (55 years or more). On the contrary, younger Italian, Irish and British participants consume
cephalopod more frequently than the older ones, with more evident differences among Italians (with up
to 21% difference among age groups). Also for those countries, there is a higher proportion of the older
generation that never consume cephalopods. This fact is particularly observed for older British
consumers, accounting with around two thirds of the respondents (62%) that never eat these products.
On the contrary, in France, the proportion of people that never eat cephalopod is higher among the
younger generations (Figure 6).
Figure 6. Frequency of Cephalopod Consumption (%) by Country and Age (Q1). Base: Respondents who
consume cephalopods (n=2,497).
19WP 5 Value chain: from producers to consumers | Action 5.3 Retailer and consumer survey
1.1.3 Cephalopod Consumption by Annual Household Income
People with higher annual income tend to consume cephalopods more frequently.
In general, the frequency of cephalopod consumption increases in families with higher annual household
income. This is more evident in the countries that traditionally consume these products. For instance, in
Spain, Portugal and Italy, there is an increase from 5 (IT) to 10% (PT) in the proportion of people who eat
cephalopods once a week or more (very high consumption) when the annual income increases from
lower (WP 5 Value chain: from producers to consumers | Action 5.3 Retailer and consumer survey
2. Local of Seafood Consumption
A majority of people consume fisheries product at home.
Regarding the local of seafood, a similar pattern consumption is observed for all categories (Figure 8).
Over two thirds of the consumers eat fisheries products at home, especially fish. Slightly more than nine
in ten consumers prepare fish at their houses (91%), whereas around nearly seven in ten respondents
(65-69%) consume other fisheries products at home. In addition to this, a high proportion of people
consume fishes, crustaceans, cephalopods and bivalves out-of-home, with around half of the
respondents (48-54%) eating seafood products in restaurants in their home countries. Consumers also
eat fisheries products during holidays abroad, although this proportion is much lower (23-26%) when
compared to other locations.
Figure 8. Local of Seafood Consumption by Category (Q2): Fishes (FISH); Crustaceans (CRU); Cephalopods
(CEPH) and Bivalves (BIV). Base: Respondents who consume fisheries products (FISH, n=3,343; CRU,
n=2,855; CEPH, n=2,497; BIV, n=2,618). Note: More than one answer (location) could be given for each
seafood category.
21WP 5 Value chain: from producers to consumers | Action 5.3 Retailer and consumer survey
2.1 Local of Cephalopod Consumption
A majority of Spanish, Portuguese, Italians and French consumers eat cephalopods at home, while Irish,
German and British consumers eat cephalopods mostly during holidays abroad.
Over six in ten Southern European and French consumers eat cephalopods at home (65-85%) and more
than four in ten of these consumers eat cephalopods in restaurants in home countries (45-64%).
Germans, Irish and British consume these molluscs away from home, mainly on holidays abroad (51-
64%) a part from restaurants in their home countries (46-56%). The percentage of consumption in
restaurants (home countries) is high and quite similar among all countries, varying between 45% (France)
and 64% (Spain) (Figure 9).
Figure 9. Local of Cephalopod Consumption by Country, namely Spain (SP), Portugal (PT), Italy (IT), France
(FR), Germany (DE) Ireland (IE), and United Kingdom (UK) (Q2). Base: Respondents who consume
cephalopods (n=2,497). Note: More than one answer (location) could be given.
22WP 5 Value chain: from producers to consumers | Action 5.3 Retailer and consumer survey
III. PREFERENCES REGARDING FISHERY PRODUCTS TYPE
Around a third of the respondents prefer to buy fresh seafood, but fillets, clean and frozen products
are also frequently bought.
Respondents who buy fishery products were asked to indicate their preferences regarding products type,
specifically: frozen; fresh; salted/dried; smoked; canned; whole; clean; fillets; unprocessed; and ready-
to-eat (RTE) meal. In general, around one third of seafood consumers (30%; Figure 10A) always buy fresh
products, with the highest percentages observed for Spanish, Portuguese, Italians, French and Irish
consumers (30-34%; Figures 10B-E, G). This percentage was lower for German and British consumers (22
and 23%, respectively; Figures 10F, H).
Other fishery products types that consumers would buy include clean and frozen products, as well as
fillets (Figure 10A). Clean products are the second choice for Irish (27%; Figure 10G), Spanish, Portuguese
and British (22% each; Figures 10B, C, H), while French and German seem to buy fillets (21 and 23%,
respectively; Figures 10E, F) and Italians the whole animal (21%; Figure 10D). Around a sixth of the
consumers would definitely buy frozen products (12-18%) (Figure 10A).
Smoked products are popular among French and German, with 14 and 15% of consumers from these
countries that always buy this kind of product, respectively (Figures 10E, F). Canned products are most
frequently bought by Spanish, Italians, Germans and British consumers (Figures 10B, D, F, H).
In general, the least popular product is salted/dried and ready-to-eat seafood (Figure 10A). British
showed the highest percentage of non-acceptance salted/dried products (44%), while ready-to-eat
products is not frequently consumed by Portuguese consumers (Figures 10C, H). In contrast, salted/dried
seafood seem to be much well accepted by Portuguese, with 12% of consumers declaring that they
always buy this type of product(Figure 10C), almost double the overall average (7%)(Figure 10A).
Figure 10. Preferences Regarding Fishery Products Type by Country (Q5C). A. All Countries. RTE: Ready-
to-eat. Base: Respondents who consume fishery products (n=3,360).
23WP 5 Value chain: from producers to consumers | Action 5.3 Retailer and consumer survey
Figure 10. Preferences Regarding Fishery Products Type by Country (Q5C). B Spain. RTE: Ready-to-eat.
Base: Respondents who consume fishery products (n=3,360).
Figure 10. Preferences Regarding Fishery Products Type by Country (Q5C). C. Portugal. RTE: Ready-to-
eat. Base: Respondents who consume fishery products (n=3,360).
24WP 5 Value chain: from producers to consumers | Action 5.3 Retailer and consumer survey
Figure 10. Preferences Regarding Fishery Products Type by Country (Q5C). D. Italy. RTE: Ready-to-eat.
Base: Respondents who consume fishery products (n=3,360).
Figure 10. Preferences Regarding Fishery Products Type by Country (Q5C). E. France. RTE: Ready-to-eat.
Base: Respondents who consume fishery products (n=3,360).
25WP 5 Value chain: from producers to consumers | Action 5.3 Retailer and consumer survey
Figure 10. Preferences Regarding Fishery Products Type by Country (Q5C). F. Germany. RTE: Ready-to-
eat. Base: Respondents who consume fishery products (n=3,360).
Figure 10. Preferences Regarding Fishery Products Type by Country (Q5C). G. Ireland. RTE: Ready-to-eat.
Base: Respondents who consume fishery products (n=3,360).
26WP 5 Value chain: from producers to consumers | Action 5.3 Retailer and consumer survey
Figure 10. Preferences Regarding Fishery Products by Type Country (Q5C). H. United Kingdom. RTE:
Ready-to-eat. Base: Respondents who consume fishery products (n=3,360).
27WP 5 Value chain: from producers to consumers | Action 5.3 Retailer and consumer survey
IV. DRIVERS AND BARRIERS TO CEPHALOPOD CONSUMPTION
1. Drivers to Cephalopod Consumption
A majority of the respondents consume cephalopods because they like the flavour, smell and/or
texture and because of they consider this seafood healthy and with nutritional benefits.
People who buy or eat cephalopod products were asked about the main reasons for doing so. For more
than half (56%) from a total of 2,497 consumers of all countries, the main driver for eating cephalopods
is because they like its “flavour, smell and/or texture”. The second main driver is because they consider
cephalopods “healthy” and with “nutritional benefits”, being the choice of more than four in ten
consumers (43%). “Freshness and quality” and “an alternative to meat” are pointed together as the third
main driver for consumption, selected by around three in ten consumers (31%) (Figure 11A).
For the majority of the consumers, the main drivers (including the orders of relevance) are the same
(Figures 11B-H). Consumers from all countries agree that the flavour, smell and/or texture and the
healthy and nutritional benefits of cephalopods are the first and second main drivers for cephalopod
consumption. However, the proportions varied from 40% (DE) to 64% (PT) and from 32% (DE) to 55%
(SP) for the first and the second driver, respectively. Freshness and quality was the third most relevant
driver for consumers from all countries except Italians and Germans, which chose “an alternative to
meat” as the third most relevant driver.
For two to three in ten Southern European consumers (22-30%; Figures 11B-D), the “habit/tradition” of
consumption of this seafood item is clearly more relevant than for Western and Northern European and
British consumers (10-16%) (Figures 11E-H).
“Influence of others in the household” is slightly more relevant for German and Irish consumers (14%
both; Figures 11F-G) than for other consumers (5-10%; Figures 11B-E, H), whereas “convenience” (facility
to prepare) seem to be more relevant for consumers from Spain, Italy and France (13% each; Figures
11B, D, E)
28WP 5 Value chain: from producers to consumers | Action 5.3 Retailer and consumer survey
Figure 11. Drivers to Cephalopod Consumption (%) (Q3). A. All countries; B. Spain; C. Portugal; D. Italy;
E. France; F. Germany; G. Ireland; H. United Kingdom. Base: Respondents who consume cephalopods
(n=2,497). Note: Consumers could select up to three main drivers.
29WP 5 Value chain: from producers to consumers | Action 5.3 Retailer and consumer survey
2. Barriers to Cephalopod Consumption
For Spanish, Portuguese, Italians and Frenchs the main barrier for not consuming cephalopods is the
price, whereas, most of the Irish, German and British respondents don’t like the flavour, smell, texture
and appearance of these molluscs.
The barrier to cephalopod consumption mostly frequently mentioned is the “price”, cited by around four
in ten consumers, (39%). Other important reasons for not consuming these molluscs include not linking
“flavour, smell, texture and appearance” (21%), “difficulty to prepare” (16%) and “lack of availability”
(15%) (Figure 12A).
At a country level, however, there is a clear difference regarding the main barrier for cephalopod
consumption. While for Southern European countries and France the price is by far considered the main
barrier (45-52%), consumers from Ireland, Germany and United Kingdom believe the flavour, smell,
texture and appearance of these animals is the main reason for not consuming them (28-37%). “Lack of
availability” is considered a barrier for up to two in ten respondents (9-20%). “Freshness, quality and
quick deterioration” of these products is mentioned as a barrier for 9-18% of the respondents (Figures
12B-H).
Less than a fifth of the respondents consider “lack of habit/tradition” as a barrier for cephalopod
consumption (Figure 12A). This barrier seem to be more relevant for Western and Northern European
and British (10-15%; Figures 12E-H) than for Southern European consumers (4-9%; Figures B-D). Very
small proportions of respondents say that they do not consume cephalopods because of “health” or
“environmental concerns” or “other” reasons (5% each) and because they are “vegetarian/vegan” (3%)
(Figure 12A).
30WP 5 Value chain: from producers to consumers | Action 5.3 Retailer and consumer survey
Figure 12. Barriers for cephalopod consumption (%) (Q4). A. All countries; B. Spain; C. Portugal; D. Italy;
E. France; F. Ireland; G. Germany; H. United Kingdom. Base: Respondents who consume cephalopods
(n=2,497).
31WP 5 Value chain: from producers to consumers | Action 5.3 Retailer and consumer survey
V. FACTORS INFLUENCING PURCHASE DECISION OF SEAFOOD
1. Price of Products
Price is definitely an important factor when buying seafood products.
Seafood consumers were asked to consider some aspects related to the origin of the products and rate
their influence in the seafood purchase decision. Around a third of the respondents who buy fishery
products (33%) think that the price definitely influences their decision when buying seafood, whereas
only a small portion of the consumers (3%) does not take it into consideration. French, Spanish and
Portuguese are the most concerned regarding the price (35-39%), whereas, for Germans and Irish the
price is less relevant (26 and 29%, respectively). Germans are also the consumers with the highest
percentage of people thinking that the price definitely does not influence their purchase decision (7%;
Figure 13).
Figure 13. Factors Influencing on Seafood Purchase Decision. Price (Q5A). Base: Respondents who
consume fishery products (n=3,360).
32WP 5 Value chain: from producers to consumers | Action 5.3 Retailer and consumer survey
2. Origin of Products
Seafood consumers prefer to buy products from local and national origins.
In relation to the origin of fishery products, seafood consumers show preference for purchasing products
with local and national origin when compared to foreign products. Products from local origin are the
ones that have more influence on seafood purchase decision, with around four in ten consumers saying
that they would definitely buy local products. The more likely to buy products from local origin are the
Spanish, with almost half of them saying that these products would definitely be in their purchase choices
(45.6%). On the other hand, this factor is less important for consumers from Germany, where less than
one third of the consumer would buy local products (Figure 14A).
Figure 14. Factors Influencing on Seafood Purchase Decision. A. Local Origin (Q5B). Base: Respondents
who consume fishery products (n=3,360).
Products from national origin also influence consumer’s purchase decision, being the choice for around
one third of the respondents (34%). This is more evident for consumers from Spain and Portugal, where
more than four in ten respondents say that they would definitely buy national products (43% of
respondents from both countries). For British and German consumers, this percentage drop to almost
half (22-26%). For Irish, Italians and French, seafood from their own countries also have some influence
in their purchase decision and would be the choice of 29 to 38% of these consumers (Figure 14 B).
33WP 5 Value chain: from producers to consumers | Action 5.3 Retailer and consumer survey
Figure 14. Factors Influencing on Seafood Purchase Decision. B. National Origin (Q5B). Base: Respondents
who consume fishery products (n=3,360).
Consumers are much less oriented to buy products from foreign origins, with 12 and 7% of the
consumers saying that they would definitely buy seafood products from inside and outside the European
Union (EU), respectively (Figures 14 C, D). When buying products from foreign origin, consumers show
evident preference for products from inside EU. This choice is slightly more evident for Germans, French
and Irish consumers, with 13 to15% open to buy these products (Figures 14 C).
Figure 14. Factors Influencing on Seafood Purchase Decision. C. Foreign Origin Inside EU (Q5B). EU:
European Union. Base: Respondents who consume fishery products (n=3,360).
34WP 5 Value chain: from producers to consumers | Action 5.3 Retailer and consumer survey
Regarding seafood with foreign origin from outside EU, French and Germans are the consumers more
inclined to buy these products, with 8 and 12% of the respondents saying that they would definitely buy
them, while in all other countries, this percentage was only 6%. On the other hand, foreign products
from outside EU have the highest percentage of consumers’ rejection. This is more evident in consumers
from France, Italy and Ireland, with 22% of the French and 17% of the Italians and Irish saying that they
would definitely not buy this kind of products (Figures 14 D).
Figure 14. Factors Influencing on Seafood Purchase Decision. D. Foreign Origin Outside EU (Q5B). EU:
European Union. Base: Respondents who consume fishery products (n=3,360).
3. Wild vs Farmed Products
Seafood consumers prefer to buy wild caught products.
Consumers are more oriented to buy wild caught compare to farmed/aquaculture products. More than
two in ten seafood consumers (26%) would definitely buy wild caught products, in comparison to slightly
more than one in ten (12%) when considering farmed/aquaculture products (Figures 15A, B). At a
country level, Irish (36%) and Portuguese (31%) are the consumers more keen to buy wild caught
products, while 7-8% of the Spanish, German and French consumers would definitely not buy these
products (Figures 15A).
35WP 5 Value chain: from producers to consumers | Action 5.3 Retailer and consumer survey
Figure 15. Factors Influencing on Seafood Purchase Decision. A. Wild Caught Products (Q5B). Base:
Respondents who consume fishery products (n=3,360).
Regarding farmed/aquaculture products, Italians, Germans and Spanish have shown the highest
acceptance for these products with around a sixth of the of the consumers (15-16%) who would
definitely buy these products. In contrast, consumers from Portugal and Ireland have the lowest
percentage among people that would definitely buy farmed/aquaculture products. Around 10% of the
French and German consumers would definitely not buy these products (Figures 15B)
Figure 15. Factors Influencing on Seafood Purchase Decision. B. Farmed/Aquaculture Products (Q5B).
Base: Respondents who consume fishery products (n=3,360).
36WP 5 Value chain: from producers to consumers | Action 5.3 Retailer and consumer survey
VI. RELEVANT INFORMATION ON SEAFOOD LABELS
Seafood origin is by far the most relevant information on seafood labels, being very relevant for four in
ten consumers. However, information about environment/sustainability, health and nutritional values
and animal welfare is also very relevant from almost a third of seafood consumers.
Seafood consumers were asked to provide their opinions regarding information on labels and rate their
relevancy using a five-level scale, from “not at all relevant” to “very relevant”. Type of information on
seafood labels included: environment/sustainability, seafood origin, health and nutritional value, cooking
information, animal welfare and Fairtrade/social welfare concerns.
The most relevant information on seafood labels, selected as “very relevant” by four in ten consumers is
seafood origin (40%), followed by health and nutrition values (30%), environment/sustainability
information (29%) and animal welfare (27%) (Figures 16A-D).
Information regarding seafood origin is particularly relevant for Italians and Irish, with around 45% of
these consumers rating this information as “very relevant”. British are the least concerned about seeing
this kind of information on seafood labels (30%). Seafood origin have also the lowest proportion of
people considering this information not relevant (3%; Figures 16A).
Health and nutritional values is the second more important information on seafood labels, considered
very relevant for three in ten consumers (30%). Irish are the consumers more interest in seeing this
information on the labels (39%), while for German and French consumers, this information is not so
relevant (23-24%, respectively; Figures 16B).
Information about environment/sustainability is also very relevant for almost three in ten consumers
overall (29%). This information is more relevant for Italians (34%), Irish (33%) and Portuguese (31%), than
for other consumers (25-30%; Figures 16C).
Overall, information about animal and social welfare concerns is considered very relevant for 27 and 25%
of the consumers, respectively (Figures 16D, E). At country level, a higher proportion of Italians and Irish
think that information on animal welfare is very relevant (30% of consumers from both countries) in
comparison with consumers from other countries (24-28%). Four percent of the consumers had no
formed opinion regarding animal welfare concerns, with the Italians as the more undecided consumers
(6%; Figures 16D). Regarding fairtrade/social welfare, the proportion of people saying that this
information is very relevant on seafood labels vary from 22 (UK) to 29% (IE). Proportions of all levels of
relevance are relatively similar among countries (Figures 16E).
Cooking recommendations is the least relevant information for labels, with 24% of the participants
considering this information very relevant and 6% considering it not at all relevant. Italians and Irish are
the consumers more interest in seeing this information on the labels, with 31 and 29% of the consumers
rating it as very relevant, respectively. Cooking recommendations is also the information with the highest
percentages under the category “not at all relevant”, reaching up to 12% German consumers with this
opinion. Germans are also the ones with the lowest percentage of consumers rating this information as
“very relevant” (14%; Figures 16F).
37WP 5 Value chain: from producers to consumers | Action 5.3 Retailer and consumer survey
Figure 16. Relevant Information on Seafood Label. A. Seafood Origin (Q5D). Base: Respondents who
consume fishery products (n=3,360).
Figure 16. Relevant Information on Seafood Label. B. Health and Nutritional Values (Q5D). Base:
Respondents who consume fishery products (n=3,360).
38WP 5 Value chain: from producers to consumers | Action 5.3 Retailer and consumer survey
Figure 16. Relevant Information on Seafood Label. C. Environment/Sustainability (Q5D). Base:
Respondents who consume fishery products (n=3,360).
Figure 16. Relevant Information on Seafood Label. D. Animal Welfare (Q5D). Base: Respondents who
consume fishery products (n=3,360).
39WP 5 Value chain: from producers to consumers | Action 5.3 Retailer and consumer survey
Figure 16. Relevant Information on Seafood Label. E. Fairtrade or Social Welfare (Q5D). Base:
Respondents who consume fishery products (n=3,360).
Figure 16. Relevant Information on Seafood Label. F. Cooking Recommendations (Q5D). Base:
Respondents who consume fishery products (n=3,360).
40WP 5 Value chain: from producers to consumers | Action 5.3 Retailer and consumer survey
VII. WILLINGNESS TO TRY DIFFERENT SPECIES AND NEW FORMATS
AND PRESENTATION OF CEPHALOPOD PRODUCTS
Around a fifth of the consumers would like to try new cephalopod species and products/presentations.
Regarding cephalopods, i.e., octopus, squid, cuttlefish, around a fifth of the consumers would like to try
new species (20%) and/or new product/presentations (17%) (Figure 17, 18).
The willingness to try different species vary from 16% (Italy) and 22% (Portugal and Spain). Consumers
from Ireland and UK show the higher percentages of people that strongly disagreed with trying different
species (21% and 20%, respectively). Italians and Spanish consumers were the most indecisive regarding
this issue, with around 6% answering that they don’t know if they would be willing to try new cephalopod
species (Figure 17).
Figure 17. Willingness to Try New Cephalopod Species. Base: Respondents who consume fishery
products (n=3,360).
41WP 5 Value chain: from producers to consumers | Action 5.3 Retailer and consumer survey
Regarding new cephalopod products/presentations, consumers from Spain and Italy are the ones more
open to try these products: 22 and 20% of the Spanish and Italians strongly agree to try this kind of
products, respectively. Western and Northern European as well as the British consumers are less willing
to try new formats and presentations of this seafood item, with from a fifth (FR; 20%) to around a third
(UK; 32%) of these consumers strongly disagreeing to try these products. French are the most indecisive,
with around 6% of people that don’t know if they would be willing to try new cephalopod products
and/or presentations (Figure 18).
Figure 18. Willingness to Try New Formats and Presentation of Cephalopod Products. Base: Respondents
who consume fishery products (n=3,360).
42WP 5 Value chain: from producers to consumers | Action 5.3 Retailer and consumer survey
CONCLUSIONS
The importance of consumption (and production) is recognized by the United Nations Agenda 2030, as
a Sustainable Development Goal (SDG). There is a growing recognition of the potential benefits of
seafood consumption for human health, with associated new products and markets.
The results from this survey reveal heterogeneous consumer preferences for different populations and
seafood categories/types. Regarding cephalopod consumption, Southern European consume this
seafood item quite frequently, reporting to consume cephalopods at least once a month, mostly at home
or in restaurants in their own countries. Contrarily, British, German and Irish consumers reported low
consumption, mostly never consuming cephalopods, with the majority of those that do consume
cephalopods reporting to do so while on holidays abroad.
Among countries, the main drivers to cephalopod consumption are similar, whereas the main barriers
differ. The main barrier for Southern European countries (Spain, Portugal, Italy) and France is the price,
whereas for the remaining countries (Germany, Ireland and UK) is the “flavour, smell, texture,
appearance” of cephalopod products.
Consumers preferences include buying fresh, clean products and fillets. One important aspect that
should be highlighted is regarding seafood origin. Consumers clearly prefer to buy products from local
and national origins, when compared to foreign products. Seafood origin is also pointed as the most
relevant information on seafood labels.
It should be noted that some information collected during the consumer survey online has not been
considered or analyzed in depth, for example information by region, proximity from coast and
educational level (of the respondent/participant), in this report. Additional preliminary and descriptive
analysis could have also been carried out, for example examining how the existence of children within
household impacts consumption frequency. The scope of this analysis only covers adult participants
(over 18), the potential of the market by underaged consumers should not be disregarded.
Socio-demographic factors and attitudes (e.g., environmental or welfare concerns, tradition of
consumption) definitely affect seafood consumption. Future work based on this large-sample diverse
population will include more in-depth examination of the cephalopods consumer habits/behavior,
patterns, attitudes and preferences. For example, consumption for some seafood categories is possibly
inversely related to price, in other words the higher the price the lower the possibility for consumption,
and patterns of consumption for high-priced seafood (e.g., crustaceans) may also vary according to
household income. Analyzing the location (home, restaurants or abroad) where a certain seafood
category is eaten and consumption-barriers can also help understand food intake and identify potential
products and markets.
43You can also read