UNIVERSITY OF CANTERBURY 2020 TRAVEL SURVEY REPORT

 
CONTINUE READING
UNIVERSITY OF CANTERBURY 2020 TRAVEL SURVEY REPORT
UNIVERSITY OF CANTERBURY
                    2020 TRAVEL SURVEY REPORT

                                                      1
University of Canterbury 2020 Travel Survey Results
Table of Contents

Introduction and Methods ...................................................................................................................... 3
Representativeness ................................................................................................................................. 3
 Survey representativeness .................................................................................................................... 3
 Staff cohort............................................................................................................................................ 3
 Student cohort ...................................................................................................................................... 4
General.................................................................................................................................................... 5
General Travel Behaviour ....................................................................................................................... 5
Travel trends ........................................................................................................................................... 7
Parking Permits ..................................................................................................................................... 10
Carpooling ............................................................................................................................................. 11
Public transport..................................................................................................................................... 12
Cycling ................................................................................................................................................... 14
Walking ................................................................................................................................................. 17
Between campus travel ........................................................................................................................ 18
Arrival and departure time on Wednesday the 15th of July 2016......................................................... 19
Conclusions ........................................................................................................................................... 24
Cycling ................................................................................................................................................... 24
Public Transport .................................................................................................................................... 24
Walking ................................................................................................................................................. 25
Parking .................................................................................................................................................. 25
Other data ............................................................................................................................................. 25
   Disabilities ......................................................................................................................................... 25
   Carpooling ......................................................................................................................................... 25
   Children/family ................................................................................................................................. 26
   Appendix A: ....................................................................................................................................... 27
   Appendix B: ....................................................................................................................................... 28

                                                                                                                                                            2
University of Canterbury 2020 Travel Survey Results
2020 UC Travel Survey Results

Introduction and Methods
The following report contains the collated results from a four-yearly transport survey conducted at
the University of Canterbury. The survey took place in July 2020 and was launched on the 15th of July
2020. A reminder email was sent to all staff and students on 21 July, and the survey closed on 22 July.
The survey was conducted through online Qualtrics software.

The survey was distributed to all students and staff at the University of Canterbury via email that was
sent from Paul O’Flaherty, Director of People, Culture and Campus. The UCSA President also promoted
the survey by fostering the completion of the survey and encouraged repeated checking of email
accounts. Other methods of promotion included chalking, talking to students and placing visual
posters around campus. In total, there were 3,128 responses. This is higher than the 2016 survey,
which garnered 2,718 responses. However, this was still lower than the 2012 survey, which gained
4,102 responses. Due to Covid-19, the survey may not have received as much attention as intended.
This could be attributed to international students going home, stress and anxiety about the future.
Additionally, due to lockdown restrictions, some travel patterns might have changed, such as public
transport behaviours.

This report includes the results from the survey and a discussion of these results. The report and
analysis were completed by Masters student Tom Gillard with help and editing by Dr Matt Morris.

Representativeness
Survey representativeness
The survey respondents were representative of the University of Canterbury staff and student
populations. In total, 934 survey respondents described themselves as University staff, 1,886 as
students and 308 did not disclose their status. Based on this, 23% of staff responded to the survey,
whereas only 10% of students completed the survey.

Staff cohort
Table 1 shows a comparison between the survey respondents who noted their status as ‘Staff’ and
University figures on the demographics of the staff population. The survey indicates slightly under the
under-representation of males and younger staff. Some caution would be prudent concerning these
slight biases in the survey cohort. But this does not take away from the validity of the survey.

                                                                                                     3
University of Canterbury 2020 Travel Survey Results
Table 1: Demographic characteristics of staff travel survey respondents compared to UC population

Student cohort
Table 2 shows a comparison between the survey respondents who noted their status as ‘Student’ and
University figures on the demographics of the student population. Females are similarly
overrepresented in student figures. Overrepresentation of females in surveys is common. There is also
some overrepresentation of students in the 18-24 age group. Some caution would be prudent
concerning these slight biases in the survey cohort, but they are insufficient to invalidate the further
analysis.

Table 2: Demographic characteristics of student travel survey respondents compared to UC
population

                                                                                                      4
University of Canterbury 2020 Travel Survey Results
General
Of staff, 64% indicated they were general staff, 35% were academic staff, and 0.86% were associates
or visitors. Four staff did not indicate what category they belong in. The survey asked what the
participants subject major was. Law garnered the highest percentage, with 7.2% of respondents
indicating that this was their field of study. Civil Engineering followed this at 5.3%, and similarly,
psychology also had a participation rate of 5.3%.

Many of the respondents make one journey to university a day at around 72%, and 22% make two
journeys (Figure 1)

                                            3.2% 2.7%

                                    22.2%

                                                             71.8%

                                        1     2   3     more than 3

                    Figure 1: Usual number of journeys to the University each day

General Travel Behaviour
Usual travel to UC remains car dominant for both students (40%) (Figure 3) and staff (56%) Figure 4).
Collectively, 45% usually drive 20% walk and 18% cycle (Figure 2). Students drive (40%) less to
University than staff (56%). Slightly more staff (19%) cycle when compared to students (17%).
However, walking for staff has seen uptake from 2016 (8%). Staff (19%) tended to cycle slightly more
than students (17%). Electric cars, e-bikes and e-scooters data were collated into the ‘other’ mode
data, and each mode can be found in Appendix A. Staff tended to use more unique travel technologies
such as electric bicycles and electric cars, which could be attributed to the increased cost in using
these methods.

                                                                                                    5
University of Canterbury 2020 Travel Survey Results
1.32%       1.21%   3.45%
                                                                        Car Driver
                  3.59%

                                                                        Walk
                  7.15%
                                                                        Bicycle

                                                 45.15%                 Bus
             17.67%
                                                                        Car passenger

                                                                        Motorcycle/Moped

                                                                        (Skateboard/rollerblade/in-line
                          20.48%
                                                                        skates/scooters)
                                                                        Other

                          Figure 2: Respondents usual mode of transport to UC

                      1.76%     1.33%    1.91%
                        2.66%                                            Car driver

                                                                         Walk
                      8.99%
                                                                         Bicycle
                                                 39.57%
                                                                         Bus
               17.07%
                                                                         Car passenger

                                                                         Skateboard/rollerblade/in-line
                                                                         skates/scooters
                                                                         Motorcycle/Moped
                                26.70%

                                                                         Other

                          Figure 3: Student’s usual mode of transport to UC

                                                                                                          6
University of Canterbury 2020 Travel Survey Results
1.29%           0.11%
                                                                            Car driver
                  3.43%
                               6.54%
                                                                            Bicycle
                   5.47%
                                                                            Walk
                7.93%
                                                                            Car passenger

                                                   56.38%                   Bus
                 18.86%
                                                                            Motorcycle/Moped

                                                                            Other

                          Figure 4: Staff’s usual mode of transport to UC

Travel trends
There have been significant changes in travel behaviours since UC began collecting travel data in 1966.
Notably, the student’s mode of travel has varied. Students who drove to the University reached a high
in 2000 at around 41%, and this was also met in 2016. There has been a slight decrease in-car driving
in 2020 to about 39%. Bus, walking and cycling travel modes to university by students has remained
steady, and these have seen a slight increase when compared to 2016. Full descriptive statistics can
be found in Appendix B.

                             Figure 5: Student travel behaviour 1966-2020

Staff travel behaviours have seen a decrease since 2012 in respondents travelling to university by car
driving from 67% in 2012 to 56% in 2020. Staff travel patterns have seen around a 2% increase in
walking and cycling with all other modes remaining relatively steady.

                                                                                                     7
University of Canterbury 2020 Travel Survey Results
Figure 6: Staff travel behaviour 1966-2020

The survey asked respondents if the weather would affect their mode of travel. 37.5% said yes, while
55.8% stated that the weather does not affect their method of travel. 2% answered in the open-ended
other section with respondents stating that if an extreme weather event such as a flood occurred,
then this would affect their travel choice. Respondents who indicated that their usual travel mode was
cycling cited that strong winds would force them to take other travel modes to UC.

Reasons that individuals utilise their chosen method of transport is fundamental in understanding
travel behaviours to and from campus. The most common reason for respondents’ travel mode
selected was that it is ‘quicker’ (55.4%) this was followed by ‘because it is cheaper’ (43.7%) and ‘I enjoy
the way I travel’ (31%). In contrast with the 2016 Travel Survey, 60% of respondents indicated that
their reason for their travel mode was because it was faster. This shows a 5% decrease in this being
the main driver of their chosen travel mode. Environmental reasons being a motivator has also
increased by 4%. Given that climate change education is much more prevalent, this could be a factor
behind this increase in this notion.

Given that just under half of the respondents said their travel method was more affordable, this could
be attributed to students generally being frugal with money so opting for lower-cost travel option puts
less strain on finances.

                                                                                                         8
University of Canterbury 2020 Travel Survey Results
60.0%    55.4%
 50.0%                                    43.7%
 40.0%                                                            30.9% 28.2% 27.0%
                                                                                    26.6% 26.0%
 30.0%
 20.0%                                                                                                                                                                                14.4%
                                                                                                                                                                                                       9.4%                  8.3%                8.2%
 10.0%                                                                                                                                                                                                                                                             3.0%
  0.0%
          Because it is

                                           Because it is

                                                                  I enjoy the way I

                                                                                      alternative form…

                                                                                                                      Because it is more

                                                                                                                                                  Because it is

                                                                                                                                                                  For environmental

                                                                                                                                                                                      Other (please

                                                                                                                                                                                                      collecting children

                                                                                                                                                                                                                            Personal security

                                                                                                                                                                                                                                                I travel in the

                                                                                                                                                                                                                                                                  through the way…
                                                                                                                                                                                                                                                same way as…

                                                                                                                                                                                                                                                                  I express myself
                                                                                                                                                                                                       Dropping off and

                                                                                                                                                                                                                             during journey
                                                                                       Lack of viable

                                                                                                                                                   healthier
                                             cheaper
            quicker

                                                                                                                                                                                        specify)
                                                                                                                        comfortable
                                                                      travel to…

                                                                                                                                                                       reasons
                                                                        Figure 7: Reasons for respondents travel choice

Respondents were then asked about their main reason for their travel choice and subsequently asked
to pick only one of the reasons as displayed in Figure 8, which they considered to be the most
important. The majority indicated that their main reason was that it was quicker (30%) because it is
cheaper (16.1%) and that they have a lack of alternatives (14%) (Figure 8). The other option was
utilised to state that health or disability limited their form of transport choice. Additionally, limited
parking and cost of parking at campus meant walking, skateboarding, and cycling were the most viable
options, particularly from a student perspective. Furthermore, since a large majority of the student
population lives within proximity of campus, other forms of transport such as bus or driving would
consume their already limited time, so these options were not feasible. In comparison with the 2016
survey, the option “because its quicker” has remained steady and remains the top reason. Overall,
across the options, the 2020 survey has remained relatively similar to that of the 2016 results.

 35.0%   30.0%
 30.0%
 25.0%
 20.0%                             16.1%
                                                            14.0%
 15.0%
 10.0%                                                                     6.2% 5.8% 5.8% 4.9% 4.5% 4.3%
  5.0%                                                                                                   2.8% 1.8% 1.3% 1.3% 1.1%
                                                                                                                                  0.1%
  0.0%
           Because it is quicker

                                    Because it is cheaper

                                                            alternative form of…

                                                            collecting children

                                                                                             Other (please specify)

                                                                                                                        Because it is healthier

                                                                                                                                                  I enjoy the way I travel

                                                                                                                                                  For environmental

                                                                                                                                                  Because it is more

                                                                                                                                                  Use during day to

                                                                                                                                                  To visit shops etc. on
                                                                                                                                                  way as other people…

                                                                                                                                                  Personal security
                                                                                                                                                  non-work purposes…

                                                                                                                                                  through the way I…
                                                                                                                                                   Use during day for
                                                                                                                                                   I travel in the same
                                                             Dropping off and

                                                                                                                                                    I express myself
                                                                                                                                                    during journey
                                                                                                                                                      the way to/from…
                                                               Lack of viable

                                                                                                                                                       perform job
                                                                                                                                                       comfortable
                                                                                                                                                         to University

                                                                                                                                                          reasons

                                                                  Figure 8: Main reason for respondents travel choice

                                                                                                                                                                                                                                                                                     9
University of Canterbury 2020 Travel Survey Results
Respondents were further asked if they would consider using other travel modes. This question
allowed the selection of more than one option. This would be the form of transport respondents
would use if weather conditions affected their current chosen method or if their usual way was
unavailable due to unforeseen circumstances. 28.3% indicated that they would not use any other form
of transport, 19.1% said they would drive a car/van, and 18.3% stated that they would be a passenger
in a car/van. Bus as an alternative has decreased in prevalence since 2016 (20%) and now is the 4th
most selected option at (17%).

 30.0%   28.3%
 25.0%
                               19.1% 18.3%
 20.0%                                     16.9% 16.7%
                                                       15.0%
 15.0%                                                                                                            12.2%
 10.0%
  5.0%                                                                                                                                2.6% 2.6% 2.0% 1.2% 1.1%
                                                                                                                                                               0.8% 0.6%
  0.0%
         I use no other form

                               Car/ Van (driver)

                                                   Car/ Van (passenger)

                                                                          Bus

                                                                                    Walk

                                                                                           Cycle (non-electric)

                                                                                                                  home/telecommute

                                                                                                                                     E-scooter/ E-
                                                                                                                                                     Scooter (non-electric)

                                                                                                                                                                              Other (please

                                                                                                                                                                                              Motorbike/ Moped

                                                                                                                                                                                                                 E-bike

                                                                                                                                                                                                                          (passenger)

                                                                                                                                                                                                                                         Electric car (driver)
                                                                                                                                                                                                                          Electric car
                                                                                                                                                      Skateboard/ Blades/
                                                                                                                                      skateboard
                                (non-electric)

                                                                                                                                                                                specify)
             of transport

                                                      (non-electric)

                                                                                                                         At

                                                                                Figure 9: Alternative travel options

Parking Permits
The survey inquired about student and staff car parking behaviours at the campus. The survey asked
whether students and staff had purchased a UC parking permit. In total 21.8% said that they had
purchased a permit. Of this total, this was broken down into 30.5% of staff holding one. Students
tended to be less likely to hold UC parking permits with just 17.4% owning one.

This was furthered analysed by comparing student and staff to the types of parking permits purchased.
Of the 614 parking permits that were indicated to have been purchased in the survey, monthly permits
made up 43.6% of this number or 267 permits. Students have the most significant rate of permits in
this area (67.9%) and staff make up 32.1% of purchases. Due to increases in parking costs in recent
years, this could indicate why students tend to purchase this form of permit rather than the annual
parking permit. Yearly parking permits make up 35% of total purchases. Of this staff maintain a 67%
share and students a 33% share.

The survey also asked if parking fees were abolished and replaced with an exit charge of $2 would
respondents increase driving to the University. 73% of respondents indicated that they would not
drive more, and 23% of respondents stated that an initiative of this nature would increase the amount
they drive to the University. The breakdown of this among staff and students showed that if this policy
were implemented, 26% of student respondents would drive more, whereas 16% of staff would drive
more.

                                                                                                                                                                                                                                                          10
University of Canterbury 2020 Travel Survey Results
80.0%
                                    73.5%
 70.0%

 60.0%

 50.0%

 40.0%

 30.0%
                                                                                                23.3%
 20.0%

 10.0%
                                                                                                                                                                   2.4%                                                                   0.9%
  0.0%
                                     No                                         Yes - I would travel Yes -I would travel less I would no longer drive
                                                                               more often by car/van        by car/van        a car/van to University

                Figure 10: Respondents driving behaviour if parking prices where restructured

Carpooling
Survey respondents were asked about carpooling behaviours and factors. The survey asked what pull
factors would influence a modal shift towards carpooling more often. 45% of respondents answered
this question, with 39.9% indicating that no factor would increase participation in such a travel
method. 34.5% responded citing that help finding a partner would motivate them to participate in this
mode. Finally, 31.5% indicated that cheaper parking for car-poolers would increase the respondent’s
participation in carpooling.

 45.0%      39.9%
 40.0%                                 34.5%
 35.0%                                                        31.5%
 30.0%                                                                                     25.8%
                                                                                                              23.2%
 25.0%
 20.0%                                                                                                                                  14.7%
 15.0%                                                                                                                                                              10.1%                           8.8%
 10.0%                                                                                                                                                                                                                         6.4%                     6.0%
  5.0%
  0.0%
         carpool (or carpool more

                                    Help in finding carpool

                                                              Cheaper car parking for

                                                                                        Greater car parking

                                                                                                              Guaranteed ride home if

                                                                                                                                        More flexible work/study

                                                                                                                                                                    Free UC vehicle or taxi for

                                                                                                                                                                                                  A large increase in fuel

                                                                                                                                                                                                                             Free UC shuttle to shops

                                                                                                                                                                                                                                                        Other (please specify)
         Nothing would make me

                                                                                                                                                                    personal emergency trips
                                     partners with similar
                                     University hours and…

                                                                                         opportunities for
                                                               carpooling travellers
            often or with more…

                                                                                                                let down by driver
                                                                                            carpoolers

                                                                                                                                                                                                                                   at lunchtime
                                                                                                                                                schedule

                                                                                                                                                                                                            costs

                                             Figure 11: Reasons for respondents to consider carpooling

                                                                                                                                                                                                                                                                                 11
University of Canterbury 2020 Travel Survey Results
Then, respondents were asked to select a single answer of the options above, which would ultimately
be their primary factor/reason for a modal shift to carpooling. Respondents indicated help finding
partners (35.7%), and cheaper parking for those who carpool (19.9%). In the 2016 travel survey, 41%
of respondents indicated that no factors would influence them to try carpooling. This option was
removed for the 2020 survey to streamline responses and gain a more indicative result. Those who
answered the open-ended ‘other’ option had varied reasons that related to independence, distance
from campus and work/university flexibility.

40.0%      35.7%
35.0%
30.0%
25.0%                        19.9%
20.0%
15.0%                                        11.6%                 9.6%                8.8%            7.3%
10.0%                                                                                                                  3.8%
 5.0%                                                                                                                                           1.7%              1.5%
 0.0%
         carpool partners

                            Cheaper car

                                           opportunities for…

                                                                home if let down

                                                                                    More flexible

                                                                                                      Other (please

                                                                                                                      A large increase in

                                                                                                                                            Free UC vehicle or

                                                                                                                                                                 shops at lunchtime
                                                                Guaranteed ride

                                                                                                                                                                 Free UC shuttle to
                            parking for

                                                                                                                                             taxi for personal
                             carpooling…

                                                                                    work/study

                                                                                                                                             emergency trips
          Help in finding

                                                                                     schedule
           with similar…

                                             Greater car

                                                                                                        specify)
                                                                   by driver

                                                                                                                           fuel costs
                                               parking

                Figure 12: Most important incentive for respondents to consider carpooling

Public transport
64.5% of respondents indicated they owned a metro card. From these respondents, 77.8% indicated
that they lived within 10 minutes of a bus stop, 17.4% stated that they did not, and 4.8% did not know.
Furthermore, of those respondents that regularly bus to campus, 40.8% indicated that bus stops on
or around campus were convenient, 17.8% found the bus stops inconvenient, and a further 16.4%
were indifferent. At both ends of the spectrum, 14.1% found the bus stops to be very convenient, and
10.8% found them to be very inconvenient.

                                                                           10.8%

                                                                 14.1%                        40.8%

                                                                  16.4%

                                                                                   17.8%

                             Convient                                                    Inconvenient
                             Neither convenient nor inconvenient                         Very convenient
                             Very inconvenient

        Figure 13: Convenience of bus stops around campus for respondents that currently bus

                                                                                                                                                                                      12
University of Canterbury 2020 Travel Survey Results
Respondents were then asked what would most encourage you to use the bus or to use it more often.
29.4% indicated a more direct route or better services would cause them to consider a change. 28.7%
indicated that nothing would encourage a transition towards using the bus or using it more often, and
27.5% indicated discounted tickets would be a factor. Those respondents who answered ‘other’
mentioned the lack of direct bus routes in their area and the time taken between interchanges.

         35.0%
                                    29.4% 28.7%
         30.0%                                  27.5%
         25.0%                                                                                                               22.1%
         20.0%                                                                                                                                            16.4% 15.3%
         15.0%
                                                                                                                                                                                                                                           9.1%
         10.0%                                                                                                                                                                                                                                              7.3% 6.6%
                                                                                                                                                                                                                                                                      5.0% 4.7%
          5.0%                                                                                                                                                                                                                                                                  3.1% 3.1%
          0.0%
                                    A more direct route or

                                                               Nothing would make me

                                                                                                  Discount tickets/passes

                                                                                                                                  More frequent service

                                                                                                                                                          More convenient bus

                                                                                                                                                                                           More reliable service

                                                                                                                                                                                                                                      comfortable buses

                                                                                                                                                                                                                                                               Other (please specify)

                                                                                                                                                                                                                                                                                         lighting at bus stops

                                                                                                                                                                                                                                                                                                                   A large increase in fuel

                                                                                                                                                                                                                                                                                                                                                  Free UC vehicle or taxi for

                                                                                                                                                                                                                                                                                                                                                                                More bike storage on

                                                                                                                                                                                                                                                                                                                                                                                                         More information on bus
                                                                                                                                                                                                                                                                                                                                                  personal emergency trips
                                    better connections to…

                                                                                                                                                                                                                                                                                          Improved security/
                                                                use the bus (or use the…

                                                                                                   (eg student discount)

                                                                                                                                                                                                                                        Cleaner/ more

                                                                                                                                                                                                                                                                                                                                                                                       buses
                                                                                                                                                                 stops

                                                                                                                                                                                                                                                                                                                                                                                                                 services
                                              Figure 14: Reasons for respondents to consider bussing more often                                                                                                                                                                                                              costs

Of these reasons, respondents indicated that a more direct route (33%), and discounted tickets (29%)
are the main factors that would encourage them to use public transport more often. Of those who
answered ‘other’ the main encouragement cited was cheaper tickets and more bus stops near where
they live.
 35.0%     32.8%
                                              28.8%
 30.0%
 25.0%
 20.0%
 15.0%
                                                                                      9.4%                                   8.4%                               7.8%
 10.0%                                                                                                                                                                                                      5.7%
  5.0%                                                                                                                                                                                                                                                    2.1%                            1.4%                             1.2%                                      1.2%                              0.7%                         0.5%
  0.0%
           A more direct route or

                                               Discount tickets/passes

                                                                                           Other (please specify)

                                                                                                                            More convenient bus

                                                                                                                                                                   More frequent service

                                                                                                                                                                                                                   More reliable service

                                                                                                                                                                                                                                                     comfortable buses

                                                                                                                                                                                                                                                                                        A large increase in fuel

                                                                                                                                                                                                                                                                                                                         Free UC vehicle or taxi for

                                                                                                                                                                                                                                                                                                                                                                  lighting at bus stops

                                                                                                                                                                                                                                                                                                                                                                                                  More information on bus

                                                                                                                                                                                                                                                                                                                                                                                                                                   More bike storage on
                                                                                                                                                                                                                                                                                                                         personal emergency trips
           better connections to…

                                                                                                                                                                                                                                                                                                                                                                   Improved security/
                                                (eg student discount)

                                                                                                                                                                                                                                                       Cleaner/ more

                                                                                                                                                                                                                                                                                                                                                                                                                                          buses
                                                                                                                                   stops

                                                                                                                                                                                                                                                                                                                                                                                                          services
                                                                                                                                                                                                                                                                                                  costs

                                                                  Figure 15: The main reason to consider busing more often

                                                                                                                                                                                                                                                                                                                                                                                                                                                          13
University of Canterbury 2020 Travel Survey Results
Breaking this into staff and student patterns, the main reason for staff to consider busing was a more
direct route (43%) whereas cheaper fares (39%) was the primary option for students to consider
busing more. Those who answered “nothing would make me bus more often” did not partake in
selecting the most influential factor, so this has changed results from 2016. 31% of students and 36%
of staff answered this for the main reason in 2016. Below shows the true influential factor across staff
and students to consider bussing more often. There is a large disparity as only 7.8% of staff considered
the cost to be influential in choosing bussing as a travel mode. Subsequently, this was the students
most selected option.

                                                         A large increase in fuel costs
                                                         A more direct route or better connections to University
                                                         Cleaner/ more comfortable buses
                                                         Discount tickets/passes (eg student discount)
                                                         Free UC vehicle or taxi for personal emergency trips
                                                         Improved security/ lighting at bus stops
                                                         More bike storage on buses
                                                         More convenient bus stops
                                                         More frequent service
                                                         More information on bus services
                                                         More reliable service
                                                         Other (please specify)
              42.7%

                                                                                                                      39.1%
                                                                                                       28.3%
                                                                                        15.4%
                                                                  10.8%
                                                          10.4%
                             7.8%

                                                                                                                                                   7.4%
                                                                                                                                                          6.3%

                                                                                                                                                                               6.2%
                                                                                                                                                                        6.1%
                                                                                 4.8%

                                                                                                               2.1%
                                    2.0%
       1.9%

                      1.9%

                                                                                                                                     1.3%
                                                                                                1.2%
                                           1.1%
                                                  1.1%

                                                                                                                                                                 0.9%
                                                                                                                              0.8%
                                                                          0.2%

                                                                                                                                            0.2%

                                           STAFF                                                                                 STUDENT

        Figure 16: Differences in staff and student perception of barriers to bussing more often
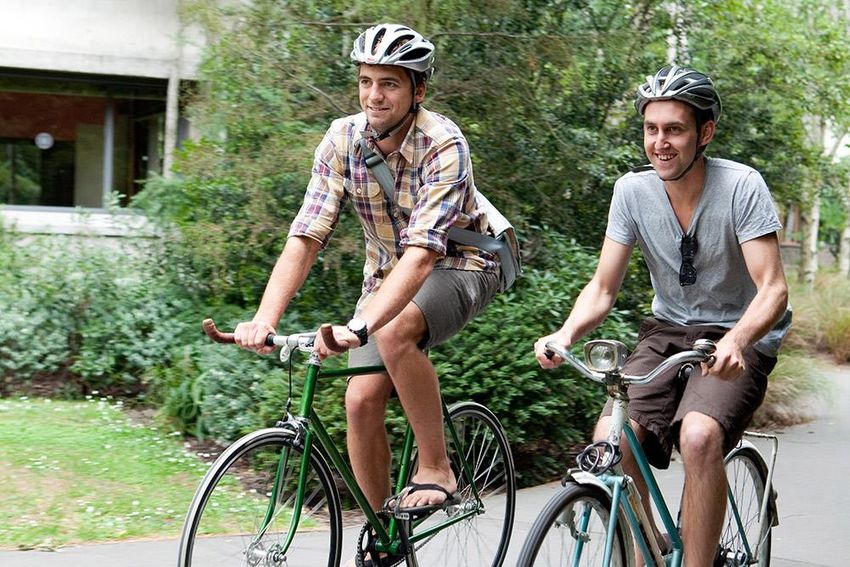
Cycling
Respondents who indicated they cycled to University were asked about the convenience of
infrastructure around campus. Of those respondents, 74% believed that the infrastructure was
convenient or very convenient with the 16% indicating they thought that cycle parking was
inconvenient or very inconvenient (Figure 17).

Of these parking facilities, 43% of usual cyclists indicated that enclosed stands are their preferred option
for cycle parking. 38% of respondents indicated that open (unlocked) covered cycle stands were their
preference, and a further 16% indicated they preferred open-air stands. When comparing to 2016
travel survey results, there has been an 8% uptake in respondents selecting covered stands that are not
locked, and there has been a decrease of 8% of respondents favouring open-aired stands.

                                                                                                                                                                                      14
University of Canterbury 2020 Travel Survey Results
5.3%
                                                                      convenient
                              9.6%

                                                                      very convenient
                      10.9%
                                                                      very inconvenient
                                                    52.4%
                                                                      neither convenient nor
                         21.8%                                        inconvenient
                                                                      inconvenient

           Figure 17: Convenience of current cycle parking respondents who usually cycle

                        18.5%

                                                                   Enclosed secure cycle stands
                                                 43.1%
                                                                   Covered cycle stands that are
                                                                   not locked
                                                                   Open air stands placed close
                                                                   to buildings
                      38.4%

                         Figure 18: Cyclists preferred cycle parking facilities

                                                                                                   15
University of Canterbury 2020 Travel Survey Results
Respondents who do not cycle to University were asked what factors would influence them bike to
 University more often. Of the respondents who answered this question, 23% indicated that improved
 cycle routes would influence them, 20.5% indicated less traffic and congestion on roads. Of those who
 answered ‘other’, the most cited reasons were distance and weather. Since this survey has been
 undertaken following the completion of the city to the university cycle route, it is surprising to see the
 most common incentive would be improved cycle routes. It is interesting to contrast to the 2016
 survey, however, as 31% in 2016 said improved cycle route would encourage them to cycle more
 often, suggesting an improvement in this area.

25.0%     23.5%
                                               20.5%
20.0%                                                                              16.6%                              15.8%
15.0%                                                                                                                                                 12.7%
                                                                                                                                                                                          10.7%
                                                                                                                                                                                                                           8.7%                             7.6%
10.0%                                                                                                                                                                                                                                                                                         7.3%                     6.4%                          6.0%
 5.0%                                                                                                                                                                                                                                                                                                                                                                                     3.4%

 0.0%
          routes to University

                                                Less traffic on roads

                                                                                   More courteous

                                                                                                                 accessible showers/

                                                                                                                                                 Improved security for

                                                                                                                                                                                          Cheap or free use of

                                                                                                                                                                                                                         More lockers at

                                                                                                                                                                                                                                                          A large increase in

                                                                                                                                                                                                                                                                                      Help with improving

                                                                                                                                                                                                                                                                                                                 congestion making

                                                                                                                                                                                                                                                                                                                                                         More cycle parking

                                                                                                                                                                                                                                                                                                                                                                                  opportunity to cycle
                                                                                                                                                                                                                                                                                                                 cycling a relatively…
                                                                                                                                                                                                                                                                                      my biking skills and
                                                                                   vehicle drivers

                                                                                                                  changing facilities…

                                                                                                                                                                                                                                                                                                                                                                                   to University with…
                                                                                                                                                                                            a bike for a year
            Improved cycle

                                                                                                                                                                                                                           University

                                                                                                                                                                                                                                                                                                                    More traffic
                                                                                                                     More easily

                                                                                                                                                                                                                                                               fuel costs
                                                                                                                                                     cycles at the

                                                                                                                                                                                                                                                                                          confidence

                                                                                                                                                                                                                                                                                                                                                                                       Having the
                                                                                                                                                      University

                                                                              Figure 19: Respondents reasons to consider cycling more often

 Of these reasons, respondents indicated that improved cycle routes are the most important incentive
 to encourage greater participation in cycling (23.9%). (Figure 20). The most commonly cited reasons
 in the ‘other’ section was distance, and the weather inhibiting participation.

  30.0%
                    23.9%
  25.0%                                        22.4%
  20.0%
  15.0%                                                                            11.3%
                                                                                                               9.2% 8.3%
  10.0%
                                                                                                                                                                 4.7% 4.7% 4.6% 3.5%
   5.0%                                                                                                                                                                              2.8% 1.9%
                                                                                                                                                                                               1.3% 0.8% 0.4%
   0.0%
                    Improved cycle routes to

                                                          Other [please specify]

                                                                                     Less traffic on roads

                                                                                                             Cheap or free use of a

                                                                                                                                      More easily accessible
                                                                                                                                                               cycles at the University

                                                                                                                                                                                              More courteous vehicle

                                                                                                                                                                                                                       Help with improving my

                                                                                                                                                                                                                                                A large increase in fuel

                                                                                                                                                                                                                                                                           More traffic congestion

                                                                                                                                                                                                                                                                                                     More lockers at

                                                                                                                                                                                                                                                                                                                            More cycle parking

                                                                                                                                                                                                                                                                                                                                                 Reduced traffic speeds in

                                                                                                                                                                                                                                                                                                                                                                              Having the opportunity to
                                                                                                                                                                Improved security for

                                                                                                                                                                                                                                                                                                                                                                               cycle to University with…
                                                                                                                                       showers/ changing…

                                                                                                                                                                                                                                                                                                       University
                                                                                                                                                                                                                                                                             making cycling a…
                                                                                                                bike for a year

                                                                                                                                                                                                                           biking skills and…

                                                                                                                                                                                                                                                                                                                                                    residential areas
                          University

                                                                                                                                                                                                     drivers

                                                                                                                                                                                                                                                          costs

                  Figure 20: Most important incentive for respondents to consider cycling more often

                                                                                                                                                                                                                                                                                                                                                                                                           16
 University of Canterbury 2020 Travel Survey Results
Walking
Respondents were asked what would make them consider walking to University more often. 31% cited
nothing would make them walk more often, 27% indicated a shuttle bus service for the night, 26%
stated better security along walking routes would encourage them to walk more often. Compared to
2016’s results there has been a 12% decrease in those citing nothing would make them walk more
often and there has been a 5% increase in those citing a shuttle would encourage greater participation
in walking as a transport mode.
  35.0%      30.6%
  30.0%                               26.8%                    25.5%
  25.0%
  20.0%                                                                                      17.8%
                                                                                                                       14.6%                       14.0%
  15.0%                                                                                                                                                                     10.8%                            10.2%
  10.0%                                                                                                                                                                                                                                7.6%
   5.0%
   0.0%
          me walk (or walk more

                                   when returning home

                                                               walking routes (lighting

                                                                                          pathway connections to

                                                                                                                    facilities on routes to

                                                                                                                                               for personal emergency

                                                                                                                                                                             A large increase in fuel

                                                                                                                                                                                                          More easily accessible

                                                                                                                                                                                                                                     More lockers at
                                   A shuttle bus service

                                                                                                                                                Free UC vehicle or taxi
           Nothing would make

                                                                Better security along

                                                                                                                      Improved crossing

                                                                                                                                                                                                           showers/ changing
           often) to University

                                                                                                                                                                                                                                       University
                                                                                                                                                                                                             facilities at the…
                                                                                              Improved/ new

                                                                                                                           University
                                                                                                University
                                         at night

                                                                                                                                                                                       costs
                                                                                                                                                        trips

                            Figure 21: Reasons respondents would consider walking more often

Respondents were then asked the main factor that would influence them to walk to University more
often. 26% selected the ‘other’ option. In this section cited time, distance and flexibility issues with
uni/work, 19% cited a shuttle service, and an additional 17% cited better security conditions as a
factor. These results are consistent with the 2016 survey results. Additionally, those who answered
‘nothing would make me’ in the multi-choice reasons questions were referred to other survey
questions rather than answering the main reason question. This is different from the 2016 survey as
those who answered ‘nothing would make them’ were then given the opportunity to answer again for
the main reason. This is an improvement in survey logic and design as in previous years, this option
would often skew results.
 30.0%     25.9%
 25.0%
                                    18.5%                    16.7%
 20.0%
 15.0%                                                                                     11.1%                       9.3%                       8.3%
 10.0%                                                                                                                                                                      4.6%                            3.7%                    1.9%
  5.0%
  0.0%
            Other [please

                                  returning home…

                                                           routes (lighting,…

                                                                                           A large increase

                                                                                                                   Improved/ new

                                                                                                                                              crossing facilities

                                                                                                                                                                          More easily

                                                                                                                                                                                                        Free UC vehicle or

                                                                                                                                                                                                                                   More lockers at
                                                                                                                    connections to…
                                                            Better security

                                                                                                                                                                          accessible

                                                                                                                                                                                                         taxi for personal
                                                                                                                                                                                                         emergency trips
                                                            along walking

                                                                                                                                                                           showers/…
                                   service when
                                   A shuttle bus

                                                                                             in fuel costs

                                                                                                                                                on routes to…

                                                                                                                                                                                                                                     University
              specify]

                                                                                                                       pathway

                                                                                                                                                 Improved

                            Figure 22: Respondents main reason to consider walking more often

                                                                                                                                                                                                                                                       17
University of Canterbury 2020 Travel Survey Results
Between campus travel
           Respondents were asked how often they travel between the main Ilam campus and Dovedale campus.
           89% indicated they made the trip less than once a month, 4.2% indicated they made the trip most
           days (Figure 23). Figure 24 displays the between campus travel data from the 2016 travel report. The
           data shows there has been a decrease in regular trips to the Dovedale campus in 2020 when compared
           with previous years.

           Respondents were then asked about the mode of transport they generally take between campuses.
           51% of people indicated that they walked between campuses, 26% stated that they drove between
           campuses and 11% cycled. There has been a drastic model shift between the 2016 and 2020 surveys.
           The 2016 UC Travel Survey saw the majority of respondents indicating that they cycled between
           campuses (45%), 24% bused, and 26% would travel by car between the campuses. This reflects the
           fact that the majority of lectures and tutorials have been moved back to the Ilam campus, so fewer
           students are travelling to and from campuses.

           The survey did not ask respondents to indicate their travel between Ilam Campus and the Arts Centre,
           despite parts of UC teaching being relocated there. For the 2024 survey, it is recommended that
           questions relating to this be asked.

                                                        89.40%                                                          71.60%

        4.20%                                                               10.09%

        3.70%                                                               9.52%

        2.70%                                                              8.76%

0.00%       20.00%     40.00%      60.00%    80.00%     100.00%    0.00%      20.00%          40.00%      60.00%        80.00%

        Less than once per month    Most days                          Less than once per month    Most days

        At least once a week        At least once a month              At least once a week        At least once a month

                Figure 23: How often respondents                       Figure 24: How often respondents
                travelled between Ilam and                             travelled between Ilam and
                Dovedale campuses 2020                                 Dovedale campuses 2016

                                                                                                                   18
           University of Canterbury 2020 Travel Survey Results
60.0%
     50.0%
     40.0%
     30.0%
     20.0%
     10.0%
      0.0%

                                               2020    2016

              Figure 25: The main form of transport between campuses of respondents

Arrival and departure time on Wednesday the 15th of July 2016
Respondents were then asked a series of questions regarding their travel behaviour on the day of the
survey. 79.4% of respondents indicated that congestion did not affect their commute to campus that
day, 14.2% indicated that congestion was a factor on their journey, and 6.4% were uncertain whether
congestion was a factor that day on their trip to the University.

35.6% of respondents on the 15th July travelled as the driver of a car or van, 19.4% walked, and 16.5%
did not travel to the University on that day (Figure 26). The proportion of walkers was similar to that of
general travel modes of around 20%; however, car and van driving proportion observed a decrease of
approximately by 15% and cycling observed a 7% decrease (Figure 26). The proportion that did not
travel to the University that day saw a rise from 11% in 2016 to 17% in 2020. This factor could be
attributed to the effects of Covid-19. For example, those who are ill or are immune-compromised may
not have travelled to the University on this day.

An even number of students (15%) and staff (17%) did not travel to University on this day. Around 49%
of staff and 29% of students drove to the University. 12% of staff cycled to the University on this day,
whereas 25% of students walked (Figure 27 and 28). Travel modes on this day tended to vary between
demographics when compared to overall travel mode; however, the dominant mode of travel was
relatively similar.

                                                                                                       19
University of Canterbury 2020 Travel Survey Results
E-scooter/ E-skateboard     0.1%
                              Electric car (passenger)   0.2%
                                   Electric car (driver)  0.7%
        Skateboard/ Blades/ Scooter (non-electric)        0.7%
                                                 E-bike   0.9%
                                  Motorbike/ Moped        1.0%
                               Other (please specify)     1.1%
                              At home/telecommute          1.6%
                 Car/ Van (passenger) (non-electric)           4.4%
                                                    Bus          5.8%
                                  Cycle (non-electric)                    12.0%
 Did not travel/ will not travel to University on that…                           16.5%
                                                  Walk                                19.4%
                      Car/ Van (driver) (non-electric)                                                     35.6%
                                                   0.0% 5.0% 10.0% 15.0% 20.0% 25.0% 30.0% 35.0% 40.0%

             Figure 26: Mode of travel of respondents on the 15th of July (staff and students)

                        E-scooter/ E-skateboard    0.1%
    Skateboard/ Blades/ Scooter (non-electric)     0.2%
                         Electric car (passenger)  0.3%
                             Motorbike/ Moped       0.9%
                         At home/telecommute         1.6%
                           Other (please specify)    1.8%
                             Electric car (driver)   1.8%
                                           E-bike    2.0%
                                              Bus     2.9%
            Car/ Van (passenger) (non-electric)         4.9%
                                            Walk          6.8%
                             Cycle (non-electric)              12.3%
 Did not travel/ will not travel to University on…                15.3%
                Car/ Van (driver) (non-electric)                                                 49.0%
                                              0.0%     10.0%     20.0%      30.0%     40.0%   50.0%      60.0%

                             Figure 27: Mode of travel by Staff on the 15th of July

                                                                                                                   20
University of Canterbury 2020 Travel Survey Results
E-scooter/ E-skateboard      0.1%
                                   Electric car (passenger)    0.2%
                                       Electric car (driver)   0.2%
                                                     E-bike    0.4%
                                    Other (please specify)      0.7%
                                       Motorbike/ Moped          1.0%
             Skateboard/ Blades/ Scooter (non-electric)          1.1%
                                   At home/telecommute            1.6%
                      Car/ Van (passenger) (non-electric)             4.1%
                                                        Bus                  7.3%
                                       Cycle (non-electric)                          12.3%
 Did not travel/ will not travel to University on that day                                   17.4%
                                                      Walk                                               25.3%
                           Car/Van (driver) (non electric)                                                    28.3%
                                                            0.0%      5.0%   10.0%   15.0%   20.0%   25.0%   30.0%

                             Figure 28: Mode of travel by Students on the 15th of July

Arrival and departure times of the respondents were also examined. 58% of respondents arrived at
the University between 7 am, and 10.59 am. The largest proportion of respondents (25%) arrived
between 8 am, and 8.59 am (Figure 29). The departure times were distributed more widely across the
day, with around 46% of the respondents leaving between 2 pm and 6.59 pm, with the largest
proportion (16.8%) leaving between 5 pm and 5.59 pm (Figure 30)

      30.0%
                                                    25.3%
      25.0%

      20.0%
                                                          14.7%
      15.0%

                                                               9.3%
      10.0%                                     8.3%
                                                                   5.8%
       5.0%

       0.0%

                                      Figure 29: Arrival times on the 15th of July

                                                                                                                     21
University of Canterbury 2020 Travel Survey Results
18.0%                                                                      16.8%
                                                                       15.4%
    16.0%
    14.0%
    12.0%
    10.0%
                                                                   8.1%
     8.0%
                                                                5.7%             5.2%
     6.0%
     4.0%
     2.0%
     0.0%

                    Figure 30: Departure time from the University on the 15th of July

Arrival and departure times between students and staff varied from the 2016 survey. In 2016 the
survey results showed that arrival and departure times were reasonably similar to two-thirds of staff
and students arriving at University between 7.00 am, and 9.59 am. This year 44.2% of staff arrived
between 8.00 am, and 8.59 am with 18.5% of students arriving during this time. 71% of staff arrived
between 7.00 am, and 9.59 am, 43% of students arrived at the University at this time compared with
the staff.

Departure times also varied when compared with the 2016 survey. 57% of staff departed from the
University between 4.00, and 5.59 pm, compared with students, 24% of whom left at the same time.
Students’ departure behaviour is much more spread out when compared with previous years. The
shift in arrival and departure times when compared with 2016 is surprising. Timetabling changes and

            50.0%
                                              44.2%
            45.0%
            40.0%
            35.0%
            30.0%
            25.0%
            20.0%                        16.5%
            15.0%                                     10.3%
            10.0%
             5.0%                     2.2%               2.7%
             0.0%

                                Figure 31: Staff Arrival Times 15th of July

                                                                                                  22
University of Canterbury 2020 Travel Survey Results
Covid-19 could potentially impact this behaviour with the latter fundamentally changing the way
lecturers lecture as many would be available to watch online. This could mean students might head
home and watch their last lecture at home rather than engaging with rush hour traffic or the cold as
this survey was taken during winter and cited numerous times in various sections of this survey.
Particularly for walking and cycling the weather is a major contributing factor in students and staff
travel behaviours.

     35.0%
                                                                       28.7% 27.6%
     30.0%
     25.0%
     20.0%
     15.0%
     10.0%
                                                                5.8%           5.8%
      5.0%                                                   2.1%
      0.0%

                            Figure 32: Staff Departure Times 15th of July

    20.0%                               18.8% 18.8%
    18.0%
    16.0%
                                                 13.5%
    14.0%
    12.0%
    10.0%                                             8.9%
      8.0%                                               6.7%
                                     5.3%
      6.0%
      4.0%
      2.0%
      0.0%

                         Figure 33: Students Arrival Times on the 15th of July

                                                                                                  23
University of Canterbury 2020 Travel Survey Results
14.0%                                                               13.1%

     12.0%                                                           10.8%
                                                                   10.3%
     10.0%
                                                            7.9%
      8.0%
                                                                                 5.5%
      6.0%

      4.0%

      2.0%

      0.0%

                       Figure 34: Students Departure Times on the 15th of July

Conclusions
Cycling
Cycling around campus has changed significantly since the Christchurch Earthquakes, and this is shown
in 2012, 2016 and now 2020 Travel Surveys. Cycling participation rates have remained relatively steady
for both students and staff. This is somewhat unusual as the University has been dedicating substantial
resources for the creation of more convenient and safer infrastructure.

74% of respondents who cycle found the parking around the University to be either very convenient
or convenient. However, there is still a proportion calling for more cycle stands, but this comment was
not as recurring as in previous years.

The 2020 Survey has shown an increase in people preferring covered stands (38%), up from 30% in
2016. However, enclosed secure stands remain the top choice for cyclists to park their bike (43%). Bike
theft is still a regular occurrence at the University, secure bike stands have somewhat mitigated theft,
but due to anyone with a Canterbury Card being able to enter these stands some thefts continue to
occur.

Safety and security remain the most common problem for those who would consider cycling and those
who do cycle. Despite improvements in this perception from the 2016 survey, many still indicated that
these issues are still a factor in inhibiting participation rates.

Public Transport
Similarly, to previous surveys staff and students indicated that a more direct route, reduced bus fares
and frequency of service were key priorities in encouraging engagement in this mode of transport.
Again, the idea of a UC shuttle bus for those returning home at night was proposed within the walking
section of the survey. This idea was generally supported, similar to the results in 2012 and 2016.

Many people mentioned the price of busing as a key factor influencing their travel choice, indicating
it is too expensive each week to bus to University. It can be cheaper to drive each week than bus if
one is paying full price for a ride two times a day, five days a week. This was echoed in the ‘other’

                                                                                                     24
University of Canterbury 2020 Travel Survey Results
section of the survey as many called for a student subsidy for tickets. This is like previous surveys and
remains an issue that the University needs to address.

Walking
Pedestrians travelling to University mentioned a variety of factors that need to be considered for
improving this mode of transport. For some, the key factors are outside of anyone’s control. Many
mentioned the weather is a key reason to avoid walking to University. Also, distance is key, as those
who consider themselves too far away to walk would be unlikely to alter their mode of transport. This
has been echoed in the 2012 and 2016 survey and continues to be a factor in the 2020 survey.

Safety again remains a priority for both students and staff. However, given the implementation of
wider footpaths and the greater presence of traffic calming and separated cycling infrastructure, these
concerns have somewhat been alleviated. However, the security aspects of walking home at night
remains a concern. The need for more generous lighting and more security presence on common
walking routes was highlighted. Improvements to lighting and security on campus have mitigated
some issues, but many raised the point of off-campus security, especially on weekends. The option of
a bus shuttle was popular again as displayed in the 2016 survey.

The dramatic increase in walking as an option for between campus travel this year may be attributed
to lectures being returned primarily to Ilam campus (and much less teaching occurring on Dovedale
campus). This was highlighted in the modal shift from cycling and driving in 2016 to walking and cycling
this year.

Parking
Parking fees remain a concern for many staff and students. Queries about differentiated pricing
structures for students and staff, and full and part-time staff, and people who live closer or further
away, were suggested. A desire for more flexible parking charges was also expressed. The University
continues to disincentivise driving to campus for a variety of reasons, not least of which is the cost of
maintaining parking facilities. As the car-parking environment continues to become more constrained,
the University is exploring ways in which it can support staff and students to find alternative means to
transportation to and from campus. Given the prevalence and need to become more climate-
conscious as a society by disincentivising driving, the University hopes to cause a modal shift towards
more sustainable transport options.

Other data
Disabilities
4.2% of respondents indicated they have a disability or health condition. The 2016 Survey made the
recommendation that this is assessed concerning whether this affects their travel to the University.

Carpooling
The 2016 survey showed many would participate in carpooling if there was a service that aided
individuals in finding partners. This was again echoed. Cheaper parking for those who carpool was also
commonly mentioned in the responses.

The call for cheaper parking aligns with comments made in the parking section of the report. The
implementation of parking repricing and restructuring could help bring down the perceived cost of
parking and increase participation in carpooling. However, a system where potential individuals who
carpool can find partners with similar start and departure times would be the most beneficial
increasing participation. This, in combination with the restructuring of parking prices, could discourage

                                                                                                      25
University of Canterbury 2020 Travel Survey Results
individuals driving themselves and aid in reducing some stress that the car parking situation in streets
around the University causes.

Children/family
Similar to previous surveys, respondents indicated that family commitments were a key reason for
their chosen mode of transport. This was particularly highlighted in walking, cycling and public
transport sections as these options did not allow for flexibility to drop children or their partners at
school or work.

                                                                                                     26
University of Canterbury 2020 Travel Survey Results
Appendix A:

Table 1: Travel modes at the University of Canterbury 2020.

 Mode                                      Student            Staff     Total

 Car/Van (driver)                          39.57%              56.38%    45.15%

 Car/Van (passenger)                        2.66%               5.47%     3.59%

 Bicycle                                   17.07%              18.86%    17.67%

 Walk                                      26.70%               7.93%    20.48%

 Bus                                        8.99%               3.43%     7.15%

 Motorcycle/Moped                           1.33%               1.29%     1.32%

 Skateboard/ scooters/ blades               1.76%               0.11%     1.21%

 Other                                      1.91%               0.86%     3.45%

 E-Bike                                     0.37%               3.2%      1.32%

 Electric car                               0.43%               2.04%     0.96%

 E-scooter/ E- Skateboard                   0.37%               0.11%     0.28%

 Electric car (passenger)                   0.16%               0.32%     0.21%

                                           100%                 100%      100%

                                                                                  27
University of Canterbury 2020 Travel Survey Results
Appendix B:
                 Table 2: Student mode changes overtime (percentages).

 Year            Car driver   Car passenger     Motorcycle     Bus            Bicycle      Walk           Skateboard (etc.)       Other           E-Bike       Electric car     Electric passenger           E-scooter/E-skateboard
         1966        29.60%             5.60%         17.60%         10.40%       27.20%          9.60%                   0.00%       0.00%            0.00%           0.00%                     0.00%                                 0.00%
         1971        27.20%             4.00%         17.60%         10.40%       28.00%      12.80%                      0.00%       0.00%            0.00%           0.00%                     0.00%                                 0.00%
         1976        26.00%             6.00%         17.00%          5.00%       23.00%      23.00%                      0.00%       0.00%            0.00%           0.00%                     0.00%                                 0.00%
         1993        33.40%             4.70%          3.70%          2.20%       37.60%      18.40%                      0.00%       0.00%            0.00%           0.00%                     0.00%                                 0.00%
         2000        41.21%             4.07%          0.84%          5.24%       15.38%      32.75%                      0.51%       0.00%            0.00%           0.00%                     0.00%                                 0.00%
         2004        38.00%             5.34%          0.71%         10.40%       12.07%      32.70%                      0.78%       0.00%            0.00%           0.00%                     0.00%                                 0.00%
         2008        32.40%             3.60%          1.60%         13.40%       19.70%      29.30%                      0.00%       0.00%            0.00%           0.00%                     0.00%                                 0.00%
         2012        37.00%             3.58%          1.72%          9.78%       19.15%      25.94%                      2.45%       0.38%            0.00%           0.00%                     0.00%                                 0.00%
         2016        41.04%             3.01%          1.63%          7.71%       18.86%      25.56%                      1.94%       0.25%            0.00%           0.00%                     0.00%                                 0.00%
         2020        39.57%             2.66%          1.33%          8.99%       17.07%      26.70%                      1.76%       0.59%            0.37%           0.43%                     0.16%                                 0.37%
                 Table 3: Staff mode changes overtime (percentages)

Year            Car driver    Car passenger     Motorcycle     Bus            Bicycle      Walk           Skateboard (etc.)       Other           E-Bike       Electric car      Electric passenger           E-scooter/E-skateboard
        1966        56.00%             8.00%           5.60%          9.60%       14.40%          6.40%                   0.00%           0.00%        0.00%            0.00%                        0.00%                              0.00%
        1971        56.80%             4.00%           6.00%         10.00%       16.00%          7.20%                   0.00%           0.00%        0.00%            0.00%                        0.00%                              0.00%
        1976        53.00%             6.00%           8.00%          3.00%       22.00%          8.00%                   0.00%           0.00%        0.00%            0.00%                        0.00%                              0.00%
        1993        63.80%             5.30%           1.90%          0.50%       18.20%      10.30%                      0.00%           0.00%        0.00%            0.00%                        0.00%                              0.00%
        2000        62.03%             3.99%           0.86%          1.94%       17.48%      13.27%                      0.00%           0.43%        0.00%            0.00%                        0.00%                              0.00%
        2004        64.40%             4.23%           0.38%          4.23%       15.49%      10.88%                      0.00%           0.39%        0.00%            0.00%                        0.00%                              0.00%
        2008        61.30%             4.80%           1.50%          6.10%       17.40%          8.90%                   0.00%           0.00%        0.00%            0.00%                        0.00%                              0.00%
        2012        67.04%             4.84%           1.12%          4.16%       16.65%          6.07%                   0.00%           0.11%        0.00%            0.00%                        0.00%                              0.00%
        2016        63.65%             5.83%           1.08%          3.56%       18.55%          6.26%                   0.11%           0.97%        0.00%            0.00%                        0.00%                              0.00%
        2020        56.38%             5.47%           1.29%          3.43%       18.86%          7.93%                   0.11%           0.86%        3.22%            2.04%                        0.32%                              0.11%

                                                                                                                                                                                                                         28
                 University of Canterbury 2020 Travel Survey Results
29
University of Canterbury 2020 Travel Survey Results
You can also read