Truck applications of Operational Modal Analysis
←
→
Page content transcription
If your browser does not render page correctly, please read the page content below
Truck applications of Operational Modal Analysis
Bart Peeters, Jean-Sébastien Servaye, Joon De Cock
LMS International, Interleuvenlaan 68, B-3001 Leuven, Belgium, bart.peeters@lms.be
ABSTRACT
At the end of its development cycle, a new truck variant is exposed to vibration tests, both in laboratory conditions
by means of a 4-shaker test rig and in real road tests on a proving ground. The idea is to extend the use of these
test data by applying Operational Modal Analysis and by being able to correlate the analysis results with Finite
Element predictions. Basically, the only feasible way to perform a modal analysis experiment on a complete truck
is by using test rig or real road excitation. In both cases the forces introduced in the structure are not available or
difficult to measure and, hence, Operational Modal Analysis needs to be applied. This paper will investigate the
feasibility of applying Operational Modal Analysis to test rig data. Direct FEM calculations, time-domain
simulations and real measurements will be compared.
A second application discussed in this paper is the design of a silent truck oil pan. Hereto, an evaluation of the
dynamic properties in operational conditions is of great interest. Especially the damping ratios are important
factors in the noise emission. This paper discusses the use of Operational Modal Analysis for experimentally
determining the eigenfrequencies, damping ratios and mode shapes of a vibrating structure. The paper discusses
both the theory and practical aspects of applying Operational Modal Analysis to engine run-up data.
1 INTRODUCTION
Operational Modal Analysis (OMA) is used to derive an experimental dynamics model from vibration
measurements on a structure in operational conditions (as opposed to dedicated laboratory testing). Cases exist
where it is rather difficult to apply an artificial force and where one has to rely upon available ambient excitation
sources. It is practically impossible to measure this ambient excitation and the outputs are the only information
that can be passed to the system identification algorithms. In this case one speaks of Operational Modal Analysis.
During the last 15 years or so, Operational Modal Analysis developed and reached a mature state with advanced
parameter estimation algorithms, commercial software implementations, and very relevant industrial applications.
This paper discusses two such industrial cases, which have in common that it concerns operational
measurements on trucks.
The driver for the first case study was the need experienced by the truck manufacturer to experimentally validate
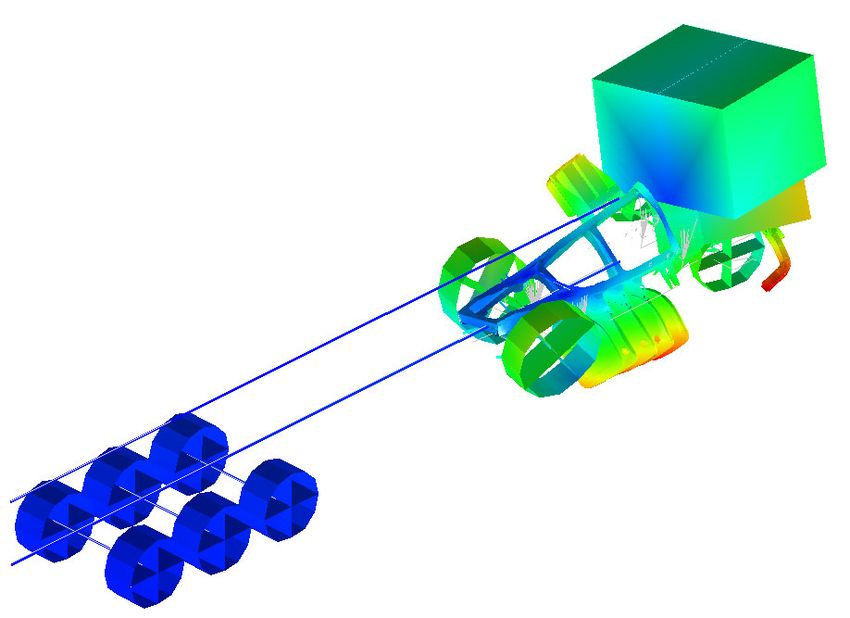
a Finite Element Model (FEM) of a truck [1]. This model is called Complete Vehicle Model (CVM) and is
represented in LMS Virtual.Lab [2] in Figure 1 (Left). It is rather cumbersome to apply a classical modal test to a
complete truck using for instance a free-free suspension system and installing at well-chosen locations along the
structure some modal shakers. Therefore, the idea arose to use operational vibrations as originating from proving
ground tests or as replicated in laboratory conditions where a truck is put with its 4 front wheel on a 4-shaker test
rig. In these conditions, the forces are not measured and the truck acceleration responses are the only available
information.
The second case study is part of an NVH optimisation study of a plastic oil pan of a truck [3]. The structural
damping in engine parts, like the oil pan, is an important property because it controls the vibration amplitude and,
hence, the emitted noise at resonance frequencies. The use of plastics implies that the oil pan vibration
characteristics such as damping ratios are highly temperature-dependent. Therefore, it is important to measure
these at the operating temperature of the engine. Also, the amount of oil present in the oil pan differs a lot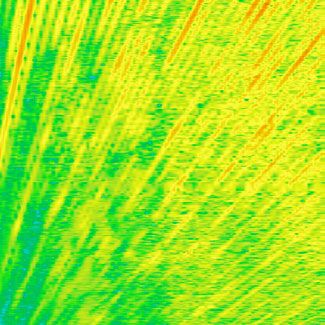
between a running engine and the situation where the engine is switched off. The mass of the oil residing in the
oil pan will evidently influence the dynamic properties (eigenfrequencies and damping ratios). Applying an artificial
excitation force (hammer or shaker) to the oil pan while the engine is running is not an easy procedure. Therefore
it was decided to use the “natural” excitation provided by the running engine as a source. The test model of the oil
pan with an indication of the sensor locations is given in Figure 1 (Right). In order to have a rich enough excitation
signal (i.e. covering the frequency range of interest), it was decided to perform a classical engine run-up test in
which the engine was running through its normal rpm range. In this situation, it is not possible to measure the
exact forces applied to the oil pan and no Frequency Response Functions (FRF) between force and acceleration
measurements can be computed. FRFs are the typical primary data used in classical modal analysis. However,
the Operational Modal Analysis (OMA) technique allows using acceleration-only data to estimate the dynamic
properties of a structure. The theoretical assumption behind OMA is that the unknown excitation is white noise. In
practice, fortunately, it still works in cases where this assumption is violated [4][5].

The paper is organized as follows. In Section 2, a very brief overview of OMA methods is presented. Section 3
discusses the application of OMA to a complete Volvo truck and in Section 4 OMA is applied to engine run-up
data from an oil pan of a Scania truck. Section 5, finally, concludes the paper.

Figure 1. (Left) Complete Vehicle Model (CVM) and superimposed measurement wireframe. (Right) Oil pan test model.

2    OPERATIONAL MODAL ANALYSIS – A VERY BRIEF REVIEW OF METHODS
A whole range of OMA curve-fitting techniques is available [6]. However, an evolution is observed from non-
parametric methods to parametric methods [7]. Non-parametric means that signal processing techniques are
used (FFT, SVD, …) to enhance certain signal features (frequency domain peaks). In the peak-picking and SVD-
based methods, the user has to select modes based on some peaks in spectra. Associated drawbacks are that it
is a subjective process, involving the need to inspect many spectra to find all the modes and sometimes the
peaks not very well visible (e.g. cases with high damping / large noise levels).

A big step forward in the analysis of operational data was the use of parametric (“curve-fitting”) techniques as
opposed to earlier peak-picking concepts. Parametric methods have the great advantage that stabilization
diagrams [8] can be used to objectively find the modes. Indeed fitting models to data means that models of
different order can be fitted and, by consequence, a stabilization diagram is created. An example of a parametric
method that received considerable attention recently is the PolyMAX method [9][10]. Its main benefit is that it
yields extremely clear stabilization diagrams and thus that it implies the potential to be used as an autonomous
modal parameter selection method. Another successful parametric method is Stochastic Subspace Identification
that estimates a state-space model from estimated output cross-correlation functions [11][12]. Both PolyMAX and
Stochastic Subspace Identification are implemented in LMS Test.Lab – Operational Modal Analysis [13].
3     TEST-BASED DYNAMIC CHARACTERIZING OF A COMPLETE TRUCK
In this section, the applicability of OMA to vibration data from a complete truck will be investigated. The starting
point of the analysis is the correlation between the mode shapes directly calculated using the CVM and
Operational Deflection Shapes (ODS) obtained from measured test-rig vibration responses (Figure 2). It is
observed that this correlation is not excellent. This can have the following reasons:

•   The ODS are obtained from the measurement data simply by taking the amplitude and phase at assumed
    peaks in spectrum plots. Especially in cases with high damping ratios and thus high modal overlap, the ODS
    will be a combination of mode shapes. For this reason, a true OMA approach where the modes can be
    isolated by applying curve-fitting techniques to the measured spectra is expected to yield better results.
•   In the frequency range of interest, the CVM yielded 52 modes, which are all represented in Figure 2.
    However, many modes are very heavily-damped (most of the modes have damping ratios between 10 and
    60%) and not all of them will be visible in the response. Also, the excitation is applied at the wheel basis. So
    modes having a low participation factor at these locations will not be well excited.
•   Finally, due to modelling inaccuracies, discrepancies may exist between the CVM and the real truck. It is
    precisely the reason for the use of OMA to validate and possibly update the CVM based on measured
    vibrations.

This section will investigate the first two arguments listed above in order to improve the initially disappointing
correlation result of Figure 2.

Figure 2. Correlation (MAC) between direct FEM modes and test rig ODS.

3.1 4-shaker test rig simulation and measurement
In a first stage, the detailed CVM is used to simulate a 4-shaker test rig measurement. Uncorrelated white noise
displacements are applied to the wheel platforms. The CVM responses were computed at 78 DOFs,
corresponding to the measured DOFs from the real test. During the measurements, the 78 DOFs were not
measured at once, but in 3 different runs, keeping 6 sensors in common to each run. These reference DOFs have
been carefully selected and are distributed over various components of the truck (cabin, frame, powertrain, rear
axle, trailer). They allow combining the analysis results of the 3 runs. Figure 3 compares the simulated
autospectra with the measured ones. They agree reasonably well. Note that the autospectra have phases
different from zero in Figure 3. This is a consequence of the particular spectrum estimate used: first the auto- and
cross-correlation functions are computed from the time data, then an exponential window may be applied to the
correlation functions and afterwards a single (i.e. no averaging used) Fourier transform of the positive time lags of
the (windowed) correlation functions is computed to yield the so-called half spectra. More information on this
approach and the specific advantages in an OMA context may be found in [10].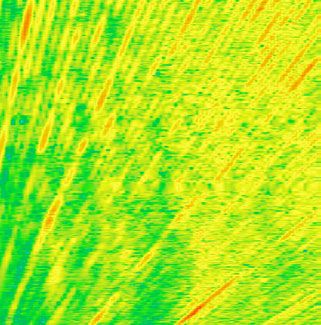
Both Stochastic Subspace Identification and PolyMAX have been applied to both the simulated and measured
data. Although both methods are known to yield accurate modal parameter estimates, it is obvious that PolyMAX
considerably facilitates the identification process because, typically, much cleaner stabilization diagrams are
obtained [14].

Figure 5 shows the correlation (MAC) between direct FEM mode shapes and PolyMAX mode shapes identified
from test rig CVM simulations. Although it is clear that many FEM modes cannot be extracted from the simulated
data, some modes correlate very well. The right part of Figure 5 compares the PolyMAX and Stochastic
Subspace Identification mode shapes. Such a comparison between 2 OMA approaches contributes to an
increased confidence in the experimental results. Figure 6 graphically shows the correlation between 2 mode
shapes. In Figure 7, some more direct FEM mode shapes are shown that have a well-correlated experimental
counterpart.

 -38.00                                                    -38.00
 g2

                                                            g2
dB

                              AutoPow er   cab:111:+X      dB                          AutoPow er   cab:111:-X
                              AutoPow er   cab:116:+Y                                  AutoPow er   cab:116:-Y
                              AutoPow er   fram:401:+Z                                 AutoPow er   fram:401:+Z
                              AutoPow er   pw t:514:+Z                                 AutoPow er   pw t:514:+Z
                              AutoPow er   raxl:672:+Z                                 AutoPow er   raxl:672:+Z
                              AutoPow er   trlr:842:+Z                                 AutoPow er   trlr:842:+Z
 -80.00                                                    -80.00
 90.00                                                     90.00
 Phase

                                                           Phase
   °

                                                             °

 -90.00                                                    -90.00

Figure 3. AutoSpectra at reference sensors. (Left) CVM simulation (Right) Truck measurement.

Figure 4. Stabilisation diagram obtained by applying PolyMAX to the CVM transient analysis data.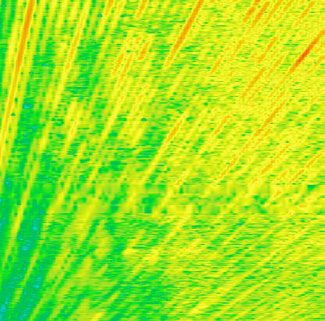
Figure 5. Correlation (MAC) between: (Left) direct FEM modes and test rig CVM simulations and (Right) PolyMAX and
Stochastic Subspace Identification mode shapes.

Figure 6. Example of a well-correlated direct FEM mode and a mode extracted from time-domain data using OMA.

Figure 7. Some typical FEM modes that can also be retrieved from time-domain data.
In order to examine the reason why many direct FEM modes are not identifiable using simulated CVM data, the
(inverse of the) damping ratios and relative mode participations are shown in Figure 8. The relative importance of
different modes in a certain frequency band can be investigated using the concept of mode participation. For each
mode, the residues are computed, i.e. mode shapes times modal participation factors (i.e. scaled mode shape
components at the input locations which are in this case the wheel hubs). The sum over the outputs of all residue
values for a specific input indicates whether that specific mode is well excited by that specific input. The
summation over all inputs for each mode represents an evaluation of the importance of each mode. In Figure 8
(Bottom), the highest value has been scaled to 100 (mode 37), so that the relative mode participations are shown.
Modes having a high value for both criteria represented in Figure 8 have a high probability to be present in the
simulated as well as in the real measurement data. It is clear that not many modes share a low damping ratios
and a high participation factors at the input locations and therefore it is not unexpected that not many of the 52
direct FEM modes are observable in the truck response data.

Figure 8. 52 FEM modes: (Left) Inverse of the damping ratios; (Right) relative mode participation.

3.2 Conclusions on the complete truck case study
This section showed that, starting from a relatively low agreement between Operational Deflection Shapes (ODS)
extracted from measured test rig data and directly computed CVM modes (Figure 2), it was possible to improve
the agreement by using OMA. By means of an in-depth investigation of the controllability and observability of the
predicted FEM modes (Figure 8), it was possible to highlight the reason why many of the FEM modes cannot be
identified: they are either not well excited by the road input or they are very heavily damped. One could argue that
these modes can be discarded as they are not relevant to describe the truck vibration behaviour in normal
operational conditions. However, if the goal is to validate and improve a model based on Test data, trying to
maximize the amount of information that can be found in the experiments is always a good option. Anyhow, the
case study shows that OMA is a very valuable technology that has its place in the vehicle development process. It
enhances the exploitation of operational data that becomes available when performing 4-shaker rig or test track
measurements.

4    DYNAMIC CHARACTERIZING OF AN OIL PAN EXCITED BY A RUNNING ENGINE
In order to be able to design a silent oilpan, an evaluation of the dynamic properties in operational conditions is of
great interest. Especially the damping ratios are important factors in the noise emission. This section discusses
the use of Operational Modal Analysis for experimentally determining the eigenfrequencies, damping ratios and
mode shapes of a vibrating structure. The added value with respect to an Operational Deflection Shape analysis,
where the measured frequency-domain information is simply geometrically animated, will be demonstrated.

It is clear that, being able with only one operational measurement to evaluate the sound level, the ODS creating
the sound and at the same time to experimentally identify the structural dynamics properties would save a lot of
time. Also the consistency of data and hence the interpretation of the data analysis results is assured since they
originate from exactly the same structure under the same environmental conditions.

4.1     Impact measurements and classical modal analysis
As a starting point for the investigation of the feasibility to perform Operational Modal Analysis, a classical impact
test was performed using dedicated software [13]. The hammer force and the oil pan accelerations were
measured and used to compute Frequency Response Functions (FRFs). A roving hammer test strategy was
adopted in which each measurement point represented in Figure 9 was impacted perpendicular to the surface. A
total of 73 DOFs were in this way measured. During the impact FRF measurements, three reference
accelerometers were used: one at the horizontal rear part, one on the left side and one on the horizontal front
part. Apart from cover the global modes they were also expected to catch the local modes in these areas. Five
averages were used at each measurement point (i.e. 5 impacts). Thus, a 73×3 FRF matrix was available to
perform classical modal analysis using PolyMAX, of which the stabilization diagram is shown in Figure 10 (Left).
Figure 10 (Right) shows the AutoMAC of the impact mode shapes. The AutoMAC indicates that some mode
shapes show high similarities with other ones. This is typical for components that are not tested in free-free
conditions, but as a part of a larger assembly.

Figure 9. Measurement points on the left side, back and bottom of the Scania D9 oilpan.

Figure 10. (Left) PolyMAX stabilization diagram from impact FRF data. (Right) Impact modes AutoMAC.

4.2     Signature measurements and Operational Modal Analysis
In a next stage, a signature test was performed. The data were measured in a run-up from 900 rpm to 2250 rpm
during 5 minutes. The sampling frequency was 6400 Hz. The same DOFs as during the impact test were
measured. The number of data acquisition channels and/or available sensors was such that the 73 DOFs were
measured in 4 different batches, where 3 reference sensors did not change position. These reference sensors
were located at the same positions as the reference sensors during impact testing. The time signal is necessary
for OMA. Therefore, the time signals (Figure 11) were recorded during the signature test [13]. To be able to
evaluate the measurement quality, phased-referenced spectra taken at ∆rpm = 25 were analysed during the run-
ups. From these spectra, Overall Levels, orders and ODS were processed. In practice, the firing order (2.5) from
the run-ups were compared to judge which run-ups were good. Four run-ups per batch seemed to be sufficient. It
was observed that the first run-up in each batch was a bit different from the other 3. On the one hand, Figure 12
indicates that the repeatability between different run-ups within the same batch is quite good, whereas, on the
other hand, Figure 13 demonstrates that the repeatability between batches is not that good. Therefore, it is
advised to perform a separate OMA for each of the batches and afterwards combining the partial mode shapes by
a so-called Multi-Run analysis. Herein, the mode shape information at the reference sensors is used to compute
scaling factors between the partial mode shapes from the different batches. After applying the correct scaling, the
partial mode shapes can simply be combined to obtain the global mode shapes.
35.00
Real
g
-31.00
0.00 s 300.00
Figure 11. Engine run-up oil pan acceleration data.
2175 -1 2175 4 2175 13
FlyWheel (T1)
FlyWheel (T1)
FlyWheel (T1)
rpm
rpm
rpm
dB
dB
dB
855 -82 855 -76 855 -75
130 Hz 650 130 Hz 650 130 Hz 650
2175 2 (C 2) -1 2175 (C 1) 4 S
2175 12 (C 3) 13
FlyWheel (T1)
FlyWheel (T1)
FlyWheel (T1)
rpm
rpm
rpm
dB
dB
dB
855 -82 855 -76 855 -75
130 Hz 650 130 Hz 650 130 Hz 650
2175 2 (C 2) -1 2175 (C 1) 4 S
2175 12 (C 3) 13
FlyWheel (T1)
FlyWheel (T1)
FlyWheel (T1)
rpm
rpm
rpm
dB
dB
dB
855 -82 855 -76 855 -75
130 Hz 650 130 Hz 650 130 Hz 650
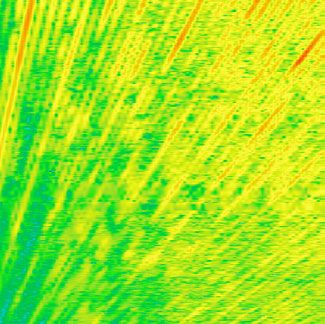
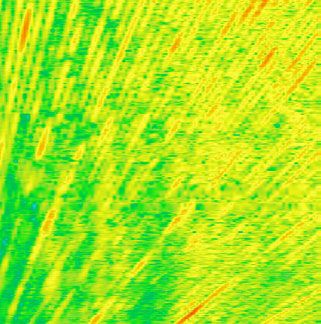
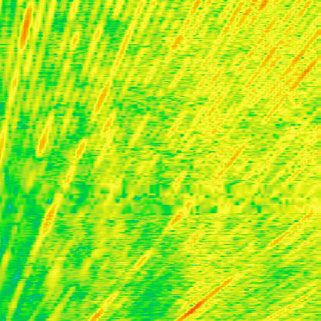
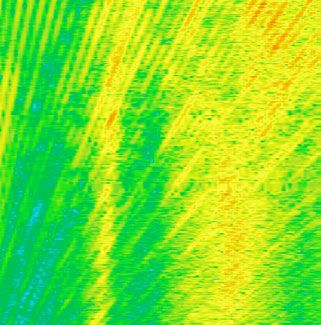
Figure 12. Colormap of the spectrogram representing the acceleration magnitudes at the reference locations as a
function of frequency and rpm. The data from batch 4 is plotted. Each row represents a different run, each column a
reference sensor. The picture shows that the test repeatability within one batch is quite good.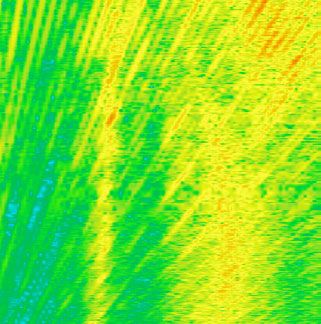
-20.00

                                                                                   AutoPow er   Big_Block:27:+Z    Batch 1

                     g2
                    dB
                                                                                   AutoPow er   Big_Block:27:+Z    Batch 2
                                                                                   AutoPow er   Big_Block:27:+Z    Batch 3
                                                                                   AutoPow er   Big_Block:27:+Z    Batch 4
                    -50.00
                             0.00                                            Hz                                        600.00
                    -15.00
                     g2
                    dB

                                    AutoPow er   Big_Block:44:+Y   Batch 1
                                    AutoPow er   Big_Block:44:+Y   Batch 2
                                    AutoPow er   Big_Block:44:+Y   Batch 3
                                    AutoPow er   Big_Block:44:+Y   Batch 4
                    -45.00
                             0.00                                            Hz                                        600.00
                    -10.00
                     g2
                    dB

                                                                                  AutoPow er   Small_Block:12:+Z   Batch 1
                                                                                  AutoPow er   Small_Block:12:+Z   Batch 2
                                                                                  AutoPow er   Small_Block:12:+Z   Batch 3
                                                                                  AutoPow er   Small_Block:12:+Z   Batch 4
                    -40.00
                             0.00                                            Hz                                        600.00

Figure 13. Power spectra of the 3 reference sensors compared over the 4 batches.

The OMA variant of PolyMAX [10] was used to estimate the oil pan modal parameters from the engine run-up
data. The stabilization diagram is shown in Figure 14. A good quality check for the modal parameter estimation
process is assessing the synthesized spectra: using the identified modal parameters, it is possible to compute the
parametric spectra and compare them with the measurement-based non-parametric estimates. Such a
comparison is made in Figure 15. The good correspondence between measured and synthesized spectra
indicates that all major dynamics have been extracted from the data.

Figure 14. Operational PolyMAX stabilization diagram, Batch 3, Run 4.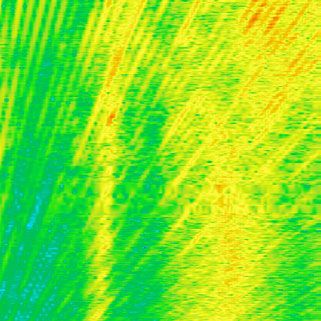
-40.00

                      g2(1/s)s
                       dB
                                                                      AutoPow er Big_Block:27:+Z Batch 4
                                                                      Big_Block:27:+Z            Batch 4

                    -100.00
                                 0.00                        Hz                                     600.00
                     -30.00
                     g2(1/s)s
                      dB

                                                                       AutoPow er Big_Block:44:+Y Batch 4
                                                                       Big_Block:44:+Y            Batch 4

                     -90.00
                                 0.00                       Hz                                      600.00
                     -18.82
                     g2(1/s)s
                      dB

                                                                     AutoPow er Small_Block:12:+Z Batch 4
                                                                     Small_Block:12:+Z            Batch 4

                     -78.82
                                 0.00                       Hz                                      600.00

Figure 15. Power spectra of the 3 reference sensors: comparison between measured spectra and spectra synthesized
from the estimated modal parameters.

4.3 Conclusions on the oilpan case study
Some merged mode shapes are given in Figure 16 and Figure 17. Figure 18 (Left) shows the AutoMAC of the
operational mode shapes. The same DOFs as in impact testing (Section 4.1) were measured, which means that
the mode shape animates only perpendicular to the different surfaces. This makes the mode shape interpretation
more difficult in some cases. It was observed that the 1st four modes are highly similar. When looking at their
animations, it seemed that the oilpan moves like a rigid body component of larger assembly modes. Figure 18
(Right), finally, compares the impact mode shapes with the operational mode shapes. As expected, there are
differences between the impact test (performed on a cold component with the engine turned off and the oil mass
in the oilpan) and the signature test (performed on a hot component with the engine at full load and the oil
circulating around). As a matter of fact, it is precisely this difference between cold and operational conditions that
was the motivation to apply OMA. Being able to identify the structural properties during working conditions is
important, especially when trying to figure out why an unexpected error occurred. There are several issues that
cannot be considered in a traditional modal analysis: pre-stress from the static engine torque, temperature
dependency (plastics), effects of rotating parts, oil and water flow and so forth.
Figure 16. Oil pan operational mode shapes. In the left mode, the oil pan moves like a rigid body. Figure 17. Oil pan operational mode shapes. Figure 18. (Left) Operational modes AutoMAC: the 1st four modes are highly similar. They are all rigid body modes of the oilpan. (Right) MAC between operational mode shapes (excl. rigid body modes) and impact mode shapes.
5     CONCLUSIONS
This paper discussed the application of Operational Modal Analysis (OMA) to experimentally determine the
dynamic properties of a complete truck and a truck oil pan in operating conditions. Rather than setting up a
dedicated classical modal analysis test in the laboratory, it is the idea to use data from operational tests to identify
the modal parameters. In some cases the classical tests are not practical (e.g. complete truck) or the test
conditions would differ too much from real conditions (e.g. oil pan). It was found that OMA delivers useful results
in terms of eigenfrequencies, damping ratios and mode shapes and provides clearly added value with respect to
an ODS analysis, where the frequency-domain information is simply geometrically animated. Final conclusion is
that OMA is a very valuable technology that has its place in the vehicle development process. It enhances the
exploitation of operational data that becomes available when performing 4-shaker rig, test track or engine run-up
measurements.

ACKNOWLEDEGEMENTS
Part of the work was conducted in the framework of the EC 6-FWP research project NMP2-CT-2003-501084
“INMAR” (Intelligent Materials for Active Noise Reduction, www.lbf.fhg.de/inmar). The support of the EC is
gratefully acknowledged.

REFERENCES
[1]  B. PEETERS, M. OLOFSSON, P. NILSSON. Test-based dynamic characterizing of a complete truck by
     Operational Modal Analysis. In Proceedings of IOMAC 2007, the International Operational Modal Analysis
     Conference, Copenhagen, Denmark, 1-2 May 2007.
[2]  LMS INTERNATIONAL. LMS Virtual.Lab, www.lmsintl.com, Leuven, Belgium, 2007.
[3]  B. PEETERS, O. JÖNSSON, P.-O. BERGLUND, T. ANDERSSON, J.-S. SERVAYE, J. DE COCK. Enhanced
     exploitation of oil pan vibration data by Operational Modal Analysis. In Proceedings of the LMS Nordic
     Users Conference, Gothenburg, Sweden, 7-8 June 2007.
[4]  K. JANSSENS, Z. KOLLAR, B. PEETERS, S. PAUWELS, H. VAN DER AUWERAER. Order-based resonance
     identification using operational PolyMAX. In Proceedings of IMAC 24, the International Modal Analysis
     Conference, Saint Louis (MO), USA, 30 January – 2 February 2006.
[5]  B. PEETERS, B. CORNELIS, K. JANSSENS, H. VAN DER AUWERAER. Removing disturbing harmonics in
     Operational Modal Analysis. In Proceedings of IOMAC 2007, the International Operational Modal Analysis
     Conference, Copenhagen, Denmark, 1-2 May 2007.
[6]  B. PEETERS, G. DE ROECK. Stochastic system identification for operational modal analysis: a review. ASME
     Journal of Dynamic Systems, Measurement, and Control, 123(4):659-667, 2001.
[7]  B. PEETERS, W. LEURS, H. VAN DER AUWERAER, F. DEBLAUWE. 10 Years of industrial Operational Modal
     Analysis: evolution in technology and applications. In Proceedings of the IOMAC Workshop 2006, Aalborg,
     Denmark, 4-5 May 2006.
[8]  H. VAN DER AUWERAER, B. PEETERS. Discriminating physical poles from mathematical poles in high order
     systems: use and automation of the stabilization diagram. In Proc. of IMTC 2004, the IEEE Instrumentation
     and Measurement Technology Conf., Como, Italy, May 2004.
[9]  B. PEETERS, H. VAN DER AUWERAER, P. GUILLAUME, J. LEURIDAN. The PolyMAX frequency-domain method: a
     new standard for modal parameter estimation? Shock and Vibration, 11:395-409, 2004.
[10] B. PEETERS, H. VAN DER AUWERAER. PolyMAX: a revolution in Operational Modal Analysis. In Proceedings
     of the 1st International Operational Modal Analysis Conference, Copenhagen, Denmark, 26-27 April 2005.
[11] P. VAN OVERSCHEE, B. DE MOOR. Subspace Identification for Linear Systems: Theory - Implementation –
     Applications. Dordrecht, The Netherlands: Kluwer Academic Publishers, 1996.
[12] L. HERMANS, H. VAN DER AUWERAER. Modal testing and analysis of structures under operational conditions:
     industrial applications. Mechanical Systems and Signal Processing, 13(2):193-216, 1999.
[13] LMS INTERNATIONAL. LMS Test.Lab, www.lmsintl.com, Leuven, Belgium, 2007.
[14] J. LANSLOTS, B. RODIERS, B. PEETERS. Automated pole-selection: proof-of-concept & validation. In
     Proceedings of ISMA 2004, Leuven, Belgium, 20–22 September 2004.
You can also read