A Surface Observation Based Climatology of Diablo-Like Winds in California's Wine Country and Western Sierra Nevada - MDPI
←
→
Page content transcription
If your browser does not render page correctly, please read the page content below
fire

Short Note
A Surface Observation Based Climatology of
Diablo-Like Winds in California’s Wine Country and
Western Sierra Nevada
Craig Smith 1,2, *, Benjamin J. Hatchett 1   ID
                                                  and Michael Kaplan 1
 1    Division of Atmospheric Sciences, Desert Research Institute, 2215 Raggio Parkway, Reno, NV 89512, USA;
      benjamin.hatchett@gmail.com (B.J.H.); michael.kaplan@dri.edu (M.K.)
 2    Cumulus Weather Solutions, LLC, Reno, NV 89511, USA
 *    Correspondence: craig.matthew.smith@gmail.com; Tel.: +1-541-231-4802

 Received: 23 May 2018; Accepted: 20 July 2018; Published: 23 July 2018

 Abstract: Diablo winds are dry and gusty north-northeasterly downslope windstorms that affect
 the San Francisco Bay Area in Northern California. On the evening of 8 October 2017, Diablo winds
 contributed to the ignitions and rapid spread of the “Northern California firestorm”, including
 the Tubbs Fire, which burned 2800 homes in Santa Rosa, resulting in 22 fatalities and $1.2 B USD
 in damages. We analyzed 18 years of data from a network of surface meteorological stations and
 showed that Diablo winds tend to occur overnight through early morning in fall, winter and spring.
 In addition to the area north of the San Francisco Bay Area, conditions similar to Diablo winds
 commonly occur in the western Sierra Nevada. Both of these areas are characterized by high wind
 speeds and low relative humidity, but they neither tend to be warmer than climatology nor have
 a higher gust factor, or ratio of wind gusts to mean wind speeds, than climatology.

 Keywords: Diablo winds; downslope windstorms; Northern California; wildfire meteorology

1. Introduction
     The Northern California firestorm of October 2017 consisted of over 250 separate wildfires that
burned over 245,000 acres (99,000 ha) in Napa, Lake, Sonoma, Mendocino, Butte and Solano counties
during dry and windy conditions that followed an anomalously hot and dry summer. In total,
these fires caused over $9 billion in damages, left 350,000 people without power, destroyed 8900
buildings and resulted in 44 fatalities. Downslope winds, locally known as “Diablo winds,” promoted
the rapid spread of many wildfires on the evening of 8 October and the morning of 9 October. At the
Hawkeye remote automated weather station (RAWS), wind speeds of 22 ms−1 (50 mph) coincided
with relative humidity below 15% around midnight. The Tubbs fire, which burned over 2800 homes
and ultimately became the most destructive wildfire in California history, was ignited on the evening
of 8 October, and the fire front travelled rapidly, covering over 12 miles (19 km) in its first three hours.
It burned over 25,000 acres (10,111 ha) in its first day and ultimately burned over 5600 structures in the
city of Santa Rosa, California.
     Despite the massive destruction wrought by the Diablo winds, associated with the Northern
California firestorm of October 2017 and the Oakland Hills firestorm of 1991, very little is known
quantitatively about them, especially relative to the Southern California downslope winds that favor
wildfires, such as Santa Ana [1–10] and Sundowner [11–15] winds. A prescient preliminary analysis of
‘Santa Ana-like’ winds in the Oakland Hills was performed in 1973 [16], some 18 years prior to the
Oakland Hills fire of 1991, and analyses [17–19] subsequent to that fire confirmed their localization at
the eastern San Francisco Bay Area. Some time thereafter, colloquial usage of the term “Diablo winds”

Fire 2018, 1, 25; doi:10.3390/fire1020025                                          www.mdpi.com/journal/fire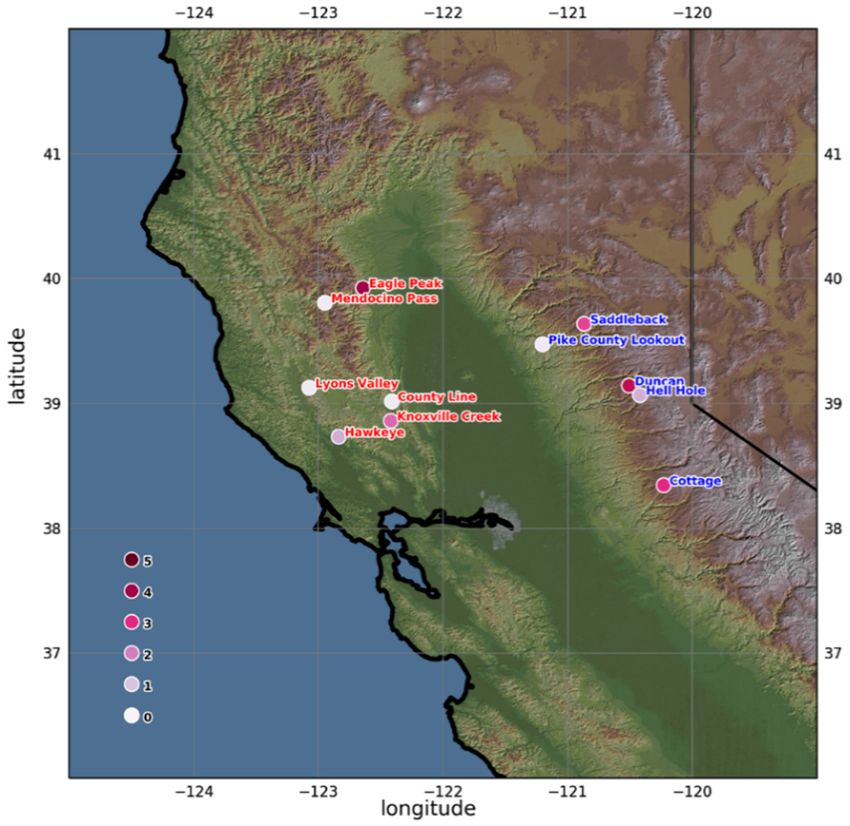
Fire 2018, 1, 25 2 of 9
by the National Weather Service expanded to include the Bay area in general (Jan Null, personal
communication), in agreement with news stories on the October 2017 Northern California firestorm.
These analyses found that Diablo winds originate from the high deserts of Nevada [20] and the Great
Basin, and that1,they
Fire 2018, x FOR are
PEERdry and warm due to adiabatic compression through descent over the
REVIEW 2 of 9western
slopes of the Sierra Nevada [16] and “blow through the mountain passes and spill over the coastal hills
winds” by the National Weather Service expanded to include the Bay area in general (Jan Null,
toward the Pacific Ocean“ [21]. Taken together, the historical literature on Diablo winds in the eastern
personal communication), in agreement with news stories on the October 2017 Northern California
San Francisco
firestorm.Bay Area
These suggests
analyses a possible
found that meso-
Diablo winds to synoptic-scale
originate linkage
from the high deserts to similar
of Nevada conditions
[20] and
along the
thewestern
Great Basin,slopes of the
and that theySierra Nevada.
are dry and warm Notwithstanding semanticsthrough
due to adiabatic compression around colloquial
descent over usage,
there does not exist
the western anyofpeer-reviewed
slopes the Sierra Nevadaliterature that through
[16] and “blow objectively supports
the mountain or refutes
passes and spillthat
overlinkage,
the coastal
circumscribes the hills toward the
occurrence Pacific Ocean“
of Diablo winds to [21].
oneTaken
areatogether, the Francisco
of the San historical literature
Bay Area onversus
Diablo another
winds in the eastern San Francisco Bay Area suggests a possible meso- to synoptic-scale linkage to
or the occurrence or absence of Diablo-like wind conditions along the western slope of the Sierra
similar conditions along the western slopes of the Sierra Nevada. Notwithstanding semantics around
Nevadacolloquial
mountains. usage, there does not exist any peer-reviewed literature that objectively supports or refutes
Here,
thatwe provide
linkage, an analysis
circumscribes of the RAWS
the occurrence station
of Diablo network
winds to one in Northern
area of the SanCalifornia,
Francisco Baywhich
Area did not
exist prior
versusto another
the Oakland Hills fire or
or the occurrence ofabsence
1991, and in previous
of Diablo-like windpublications
conditions alongon the
Diablo winds
western slopein order
to betterofunderstand,
the Sierra Nevada andmountains.
provide some basic information about, Diablo winds. We evaluate where
and when they Here,tend
we provide
to occuranandanalysis
howofwarm,
the RAWS station
dry and network
windy theyintend
Northern California,
to be. We also which didwhether
explore
not exist prior to the Oakland Hills fire of 1991, and in previous publications on Diablo winds in order
conditions similar to Diablo winds also occur along the western slopes of the Sierra Nevada.
to better understand, and provide some basic information about, Diablo winds. We evaluate where
and when they tend to occur and how warm, dry and windy they tend to be. We also explore whether
2. Materials and Methods
conditions similar to Diablo winds also occur along the western slopes of the Sierra Nevada.
We used available surface meteorological data from the RAWS network, which was acquired from
2. Materials and Methods
MesoWest for the period spanning 1 January 1999 through 1 January 2018. We divided our area of
interest intoWetwoused available
sections ofsurface meteorological
interest: One centered dataon
from
thethearea
RAWS network,
north of thewhich was acquired
San Francisco Bay Area
from MesoWest for the period spanning 1 January 1999 through 1 January 2018. We divided our area
(NoBA), including the Northern Coast Range and another centered on the western Sierra Nevada
of interest into two sections of interest: One centered on the area north of the San Francisco Bay Area
(SN; Figure 1). We included stations in those areas with a period of record greater than 15 years,
(NoBA), including the Northern Coast Range and another centered on the western Sierra Nevada
with the(SN;
exception
Figure 1).of
Wethe following
included stations,
stations which
in those areas exhibited
with a period ofvery low
record Diablo-like
greater wind
than 15 years, condition
with
occurrence: NoBA RAWS
the exception of thestations of Santa
following Rosa,
stations, whichHopland and
exhibited Highglade,
very SN RAWS
low Diablo-like windstations of Mount
condition
occurrence:
Elizabeth, NoBA RAWS
Bald Mountain, andstations
Banner of Road,
Santa Rosa,
and Hopland
all of theand Highglade, Surface
Automated SN RAWS stations of System
Observing
(ASOS)Mount
network.Elizabeth,
Jarbo Bald
GapMountain, and Banner
was excluded due toRoad, and all of
channeling ofthe Automated
flow down the Surface Observing
Feather River canyon.
System (ASOS) network. Jarbo Gap was excluded due to channeling of flow down the Feather River
The stations considered in our analysis are shown in Figure 1 and detailed in Table 1.
canyon. The stations considered in our analysis are shown in Figure 1 and detailed in Table 1.
Figure 1. Study area map, including the stations considered. Stations are colored according to their
Figure 1. Study area map, including the stations considered. Stations are colored according to their
frequency of Diablo-like event days per year. Station name colors correspond to the northern San
frequency of Diablo-like
Francisco event (red)
Bay Area (NoBA) daysand
perSierra
year. Station
Nevada name
(blue) area.colors correspond to the northern San
Francisco Bay Area (NoBA) (red) and Sierra Nevada (blue) area.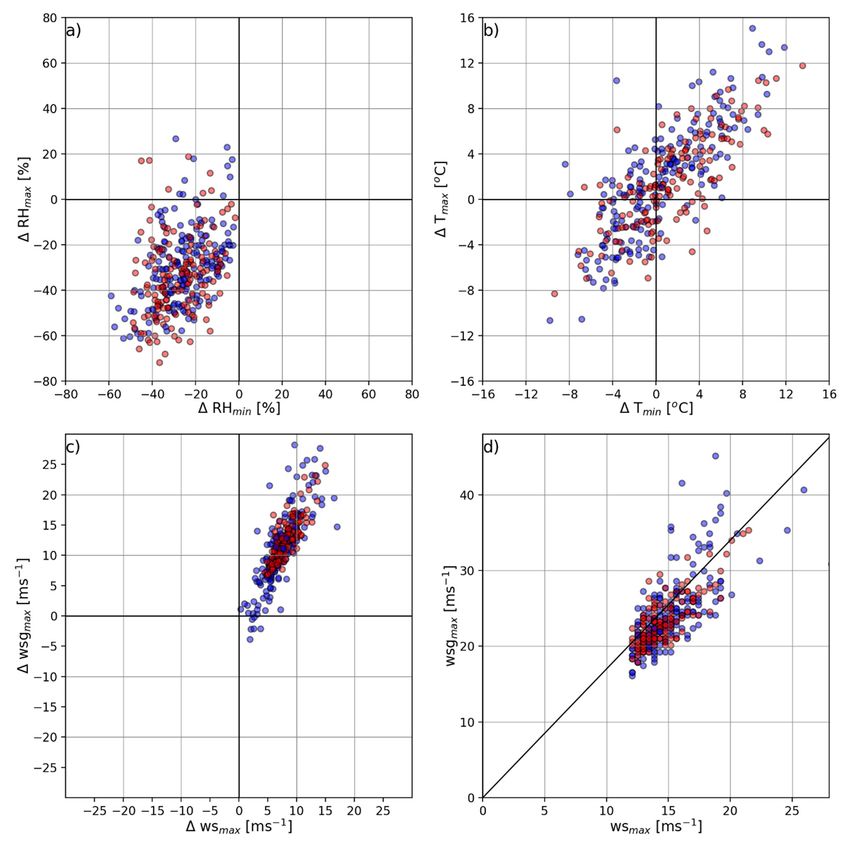
Fire 2018, 1, 25 3 of 9
Table 1. Station metadata, including name, period of record (POR), longitude, latitude, elevation and
corresponding area.
Station Name POR (Years) Longitude (◦ W) Latitude (◦ N) Elevation (Meters) Area
Duncan 16.5 −120.509 39.144 2164 SN
Cottage 15.3 −120.230 38.346 1848 SN
Mendocino Pass 16.8 −122.945 39.807 1640 NoBA
Saddleback 16.8 −120.865 39.638 2033 SN
Knoxville Creek 18.4 −122.417 38.862 671 NoBA
Hell Hole 18.4 −120.420 39.070 1597 SN
Hawkeye 18.4 −122.837 38.735 617 NoBA
Lyons Valley 18.4 −123.073 39.126 1023 NoBA
County Line 18.4 −122.412 39.019 636 NoBA
Eagle Peak 17.1 −122.642 39.927 1132 NoBA
Pike County Lookout 18.4 −121.202 39.475 1128 SN
RAWS stations report variables, such as wind speed, as 10 min averages at hourly intervals near
their specified Geostationary Operational Environmental Satellite (GOES) transmission time and report
wind speed gust as the maximum wind speed identified in the previous hour, such that the wind speed
gust may be drawn from a sequence of observations that are not included in the reported wind speed
values. Most RAWS station observation samples are taken at 5 s intervals (Greg McCurdy, personal
communication). The observations for each station were mapped to their nearest hour, such that our
results have a temporal fidelity of not less than 29 min in either direction. From this, we computed
hourly averages of wind speed (ws), wind speed gust (wsg), wind direction (wd), relative humidity
(RH) and temperature (T) for each hour across all stations for each area of interest (NoBA and SN).
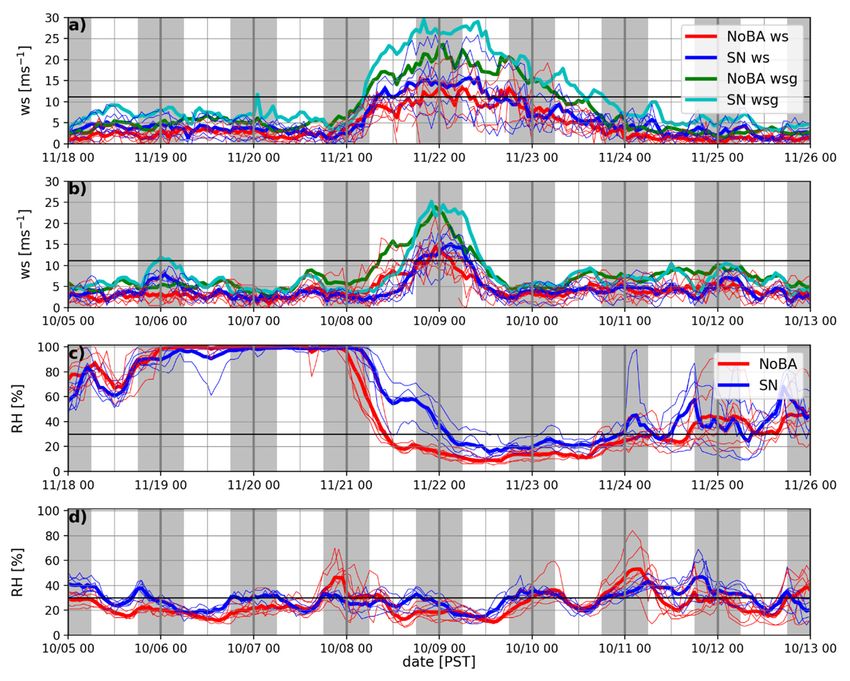
The example time series of the station average wind speeds and relative humidity of two representative
Diablo events are shown for the 22 November 2013 event and the 9 October 2017 event (Figure 2).
While both of these events show a short period of large wind speeds, with rapid onset and decay,
many other events lasted multiple days, often with a decay in the magnitude of wind speeds during
the day and increases in wind speeds overnight. The 22 November 2013 event exhibited a massive
multi-day secular decrease in relative humidity. This pattern was seen in multiple events, sometimes
superimposed on moderate relative humidity recoveries, according to a typical diurnal pattern. Both of
these events show a relatively uniform degree of wind speed and relative humidity characteristics
that help justify our usage of an area-wide average of stations. However, in other events, a significant
amount of inter-station variability is present. Therefore, we do not attempt to address this in our
analysis; instead, we focus on the variability between the North of the Bay and the Sierra Nevada areas.
Our criteria for identifying Diablo wind events on an hourly per station basis consisted of the
following requirements:
• wind speeds greater than 11.17 ms−1 (25 mph);
• a wind direction between 315◦ and 135◦ ;
• a relative humidity below 30%;
• the above conditions satisfied for three or more consecutive hours.
Conditions meeting the above criteria at any station were considered Diablo-like events on
an hourly per station basis. Diablo-like events on an hourly per area basis were defined as any single
station in an area that meets the criteria. Diablo-like days on a per station basis were defined as any
Diablo-like event on an hourly per station basis at any hour of a given day. Diablo-like days on a per
area basis were defined as any single station in an area that meets the criteria at any hour of a given day.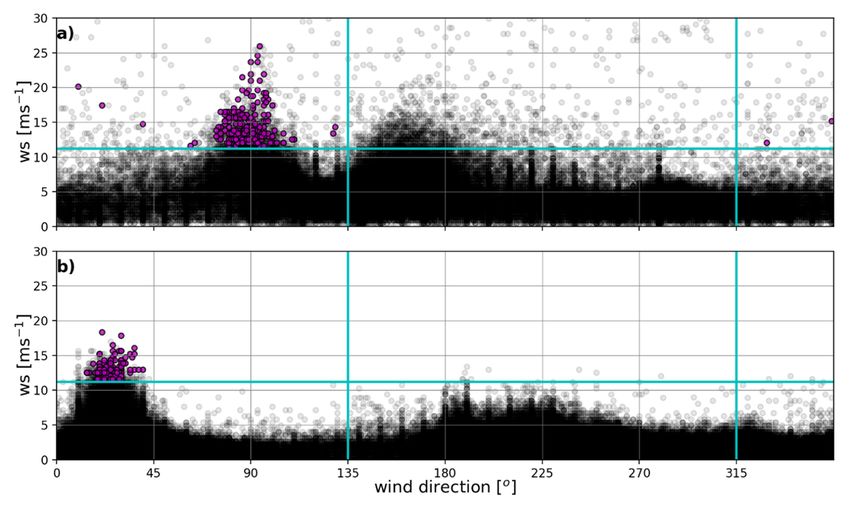
Fire 2018, 1, 25 4 of 9
Fire 2018, 1, x FOR PEER REVIEW 4 of 9
Figure
Figure 2. 2.Station-wide
Station-wide average
average (thick
(thicklines)
lines)and
andindividual
individualstations (thin(thin
stations lines):lines):
Wind speed
Wind and wind
speed and
speed
wind gustgust
speed (a,b)(a,b)
and relative humidity
and relative (c,d) for
humidity the for
(c,d) north
theofnorth
Bay (NoBA)
of Bay and
(NoBA)western
andSierra Nevada
western Sierra
(SN) areas
Nevada duringduring
(SN) areas the 22theNovember 2013 (a,c)
22 November 2013and 9 October
(a,c) 2017 (b,d)
and 9 October 2017Diablo-like wind events.
(b,d) Diablo-like The
wind events.
Thehorizontal
horizontal dark
darkgray
graylines
linescorrespond
correspond totothe
theminimum
minimum wind
windspeed
speed(a,b)
(a,b)and
andmaximum
maximum relative
relative
humidity
humidity (c,d)
(c,d) criteria
criteria forforDiablo-like
Diablo-likeevents.
events.
Several select Diablo-like events, ranked by wind speed and wind speed gust magnitude, at
Several select Diablo-like events, ranked by wind speed and wind speed gust magnitude,
Duncan and Knoxville Creek are presented in Table 2. We verified that our findings are robust with
at Duncan
respect to and Knoxville
different Creek
values are presented
of minimum windinspeed,
Table 2. We verified
relative thatconsecutive
humidity, our findings are robust
hours and
with respect
number of to different
stations, values of minimum
simultaneously meeting the wind speed,
criteria. relativeplots,
Example humidity,
showingconsecutive
all availablehours
hourlyand
number of stations, simultaneously meeting the criteria. Example plots, showing
wind speed and wind direction observations for the Duncan and Knoxville Creek RAWS, along with all available hourly
wind
ourspeed and wind
wind speed direction
and wind observations
direction forshown
criteria, are the Duncan and
in Figure 3. Knoxville
We computed Creek
theRAWS,
mean gustalong with
factor
our(gf),
wind speedasand
defined windwind direction
speed criteria,by
gust divided arewind
shown in Figure
speed, 3. We computed
as a function the mean
of wind speed, gust
for all
factor (gf ), defined
observations. as wind
In order speed gust how
to characterize dividedhot,by wind
dry, andspeed,
windy as a functiondays
Diablo-like of wind speed, fortoall
are compared
observations.
climatology, In weorder to characterize
also computed howfor
anomalies hot, dry,
each and windy
Diablo-like day.Diablo-like days are
In this calculation, thecompared
minimum to
and maximum
climatology, daily
we also wind speed,
computed temperature,
anomalies andDiablo-like
for each relative humidity
day. Infor each
this Diablo-like
calculation, theevent day
minimum
andwas compared
maximum to awind
daily climatology calculated from
speed, temperature, andthe corresponding
relative humidityJulian dayDiablo-like
for each long-term event
average day
minimum and maximum values on a per station basis.
was compared to a climatology calculated from the corresponding Julian day long-term average
minimum and maximum values on a per station basis.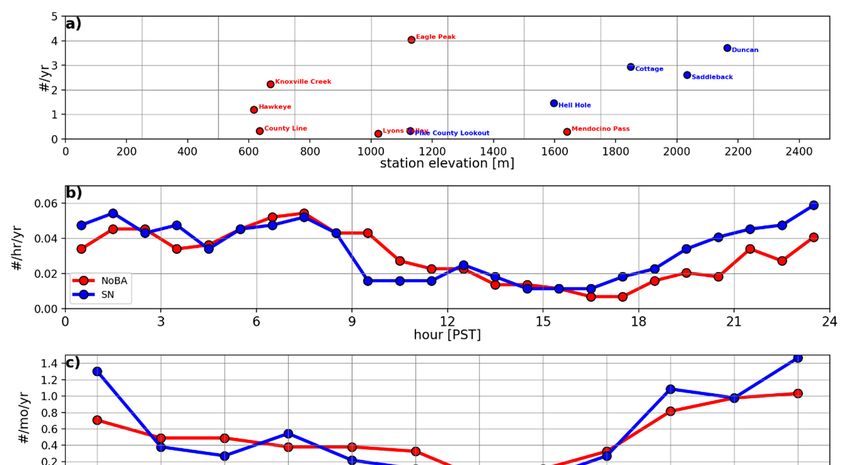
Fire 2018, 1, 25 5 of 9
Fire 2018, 1, x FOR PEER REVIEW 5 of 9
Table 2. Select list of the strongest events by wind speed and wind speed gust magnitudes at Duncan
Table 2. Select list of the strongest events by wind speed and wind speed gust magnitudes at Duncan
and Knoxville Creek, satisfying the Diablo-like event criteria.
and Knoxville Creek, satisfying the Diablo-like event criteria.
Date Duncanws
Duncan /wsgmax (ms−1)−1 )Knoxville
Knoxville Creek wsmax /wsg −1 )
Date wsmax
max/wsg max(ms Creek ws max/wsg max(ms −1)
max (ms
2002-02-28
2002-02-28 9.8/15.6
9.8/15.6 17.9/27.3 17.9/27.3
2002-03-01
2002-03-01 13.4/25.0
13.4/25.0 14.3/29.5 14.3/29.5
2004-10-11
2004-10-11 20.1/26.8
20.1/26.8 13.4/22.8 13.4/22.8
2006-12-28
2006-12-28 15.2/19.7
15.2/19.7 17.0/26.4 17.0/26.4
2009-01-09
2009-01-09 -/-
-/- 18.3/27.7 18.3/27.7
2011-12-01
2011-12-01 18.8/36.7
18.8/36.7 12.5/20.1 12.5/20.1
2011-12-16
2011-12-16 24.6/35.3
24.6/35.3 12.5/20.1 12.5/20.1
2013-11-22
2013-11-22 25.9/40.7
25.9/40.7 15.6/26.4 15.6/26.4
2017-10-09
2017-10-09 18.8/27.3
18.8/27.3 16.1/28.2 16.1/28.2
Figure
Figure3. 3.Scatter
Scatterplot
plotofofwind
windspeed
speed versus
versus wind direction
directionfor
forall
allavailable
availablehourly
hourlyobservations
observations at at
Duncan Canyon (a) and Knoxville Creek (b). Conditions satisfying the Diablo-like criteria
Duncan Canyon (a) and Knoxville Creek (b). Conditions satisfying the Diablo-like criteria of wind of wind
speed, wind
speed, wind direction and
direction relative
and humidity
relative humidityareare
shown
shownin magenta.
in magenta.Cyan lines
Cyan correspond
lines to the
correspond wind
to the
wind direction
direction and wind andspeed
windcriteria
speed criteria for Diablo-like
for Diablo-like events.events.
3. 3. Results
Results andDiscussion
and Discussion
TheThe average
average numberofofdaily
number dailyDiablo-like
Diablo-like events
events per
perstation
stationper
peryear
yearthat
thatmeet
meetthe criteria
the is shown,
criteria is shown,
as a function of station elevation, in Figure 4a, and as colored dots, in Figure 1. The relationships shown
as a function of station elevation, in Figure 4a, and as colored dots, in Figure 1. The relationships shown
indicate that interstation variability and micro-siting is likely an important component of observed
indicate that interstation variability and micro-siting is likely an important component of observed
Diablo-like wind conditions in the RAWS network. The large difference in event occurrence at the
Diablo-like wind conditions in the RAWS network. The large difference in event occurrence at the
somewhat closely located stations Mendocino Pass and Eagle Peak suggests that station micro-siting
somewhat closely located stations Mendocino Pass and Eagle Peak suggests that station micro-siting
issues cannot be fully excluded from our analysis. Since Eagle Peak experiences a high event count due
issues cannot be fully excluded from our analysis. Since Eagle Peak experiences a high event count due
to north-northeasterly events, we verified that our results are similar if we excluded Eagle Peak from
to the
north-northeasterly events, weevents
analysis. Hourly Diablo-like verified
perthat
area,our resultsasare
averaged similar ifofwe
a function theexcluded Eagle
hour of day, Peak from
is shown in
theFigure
analysis.
4b. Daily Diablo-like events per area, averaged as a function of the month of the year, is is
Hourly Diablo-like events per area, averaged as a function of the hour of day, shown
shown
in in
Figure
Figure4b. Daily Diablo-like
4c. Diablo-like events
wind events tendper
to area,
occur averaged
overnight, as a function
through of the month
early morning of the year,
most frequently
is shown in Figure
(more than 4c. Diablo-like
once per wind
month) during events
late tendearly
fall and to occur
springovernight, through Mid-to-late
(October–March). early morning most
spring
frequently (more than once per month) during late fall and early spring (October–March).
(April–June) and early fall (September) events are less frequent, occurring at a frequency of Mid-to-late
spring (April–June)
approximately one and
eventearly fall months.
per two (September)
They events
are quiteareuncommon
less frequent,
duringoccurring
summerat a frequency of
(July–August).
approximately
These results one event per with
are consistent two months.
a previous They are quite
analysis [16]. uncommon during asummer
The results indicate (July–August).
very similar diurnal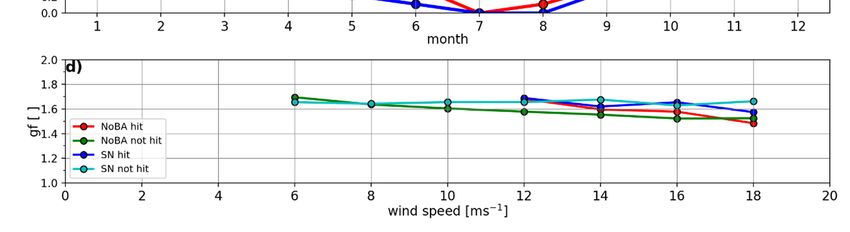
Fire 2018, 1, 25 6 of 9
TheseFire
results are consistent with a previous analysis [16]. The results indicate a very similar6 diurnal
2018, 1, x FOR PEER REVIEW of 9
pattern for the SN stations to the NoBA stations (Figure 4b). Monthly frequencies are also similar,
although
patternNoBA stations
for the appear
SN stations to to
thehave
NoBA slightly more
stations frequent
(Figure events during
4b). Monthly December
frequencies are alsoand January
similar,
although
(Figure 4c). The NoBASNstations
stationsappear
indicateto have slightlyrelationship
a modest more frequentbetween
events during December
Diablo-like and January
events and station
(Figure
elevation, 4c). The
while SN stations
the NoBA indicate
stations a modest
do not (Figurerelationship
4a). between Diablo-like events and station
elevation, while the NoBA stations do not (Figure 4a).
The departures from the Julian day climatology, on a per station basis, show that Diablo-like
The departures from the Julian day climatology, on a per station basis, show that Diablo-like
events tend to be very dry (Figure 5a) relative to climatology, with depressed daily minimum and
events tend to be very dry (Figure 5a) relative to climatology, with depressed daily minimum and
maximum relative humidity on the order of 30%. This is consistent with the Southern California
maximum relative humidity on the order of 30%. This is consistent with the Southern California
downslope
downslope wind regimes
wind [1,13].
regimes [1,13].However,
However, minimum
minimum and andmaximum
maximum daily
daily temperatures
temperatures are not
are not
elevated relative to climatology (Figure 5b), indicating that Diablo-like wind
elevated relative to climatology (Figure 5b), indicating that Diablo-like wind events are not events are not anomalously
warm. Daily maximum
anomalously warm. Dailywindmaximum
speeds and windwind speed
speeds andgusts
wind are elevated
speed gusts arerelative
elevatedto climatological
relative to
climatological
averages (Figure 5c), averages
and both (Figure
the wind 5c), and
speed both
andthewindwind speed
speed and
gust arewind
highlyspeed gust aretohighly
correlated each other
correlated
(Figure 5d), which to each
is inother (Figure 5d),
agreement withwhich is in agreement
previous with previous
work on Santa Ana winds work([3],
on Santa Ana winds
cf. Figure 13a).
([3], cf. Figure 13a).
The gust factor analysis (Figure 4d), in which the mean gust factor is computed per wind speed
The gust factor analysis (Figure 4d), in which the mean gust factor is computed per wind speed
bin for Diablo-like event days on a per area basis, and compared to all observations, shows that the gust
bin for Diablo-like event days on a per area basis, and compared to all observations, shows that the gust
factor during Diablo-like event days is not elevated relative to non-Diablo-like event days. The wind
factor during Diablo-like event days is not elevated relative to non-Diablo-like event days. The wind
speeds and wind speed gusts are both elevated during Diablo-like events, although the gust factor is
speeds and wind speed gusts are both elevated during Diablo-like events, although the gust factor is
not, indicating no support
not, indicating no supportforfor
Diablo-like
Diablo-likewinds
winds being gustierthan
being gustier thanother
other high
high wind
wind events
events that that
affectaffect
thesethese
stations under
stations underother atmospheric
other atmosphericconditions.
conditions. TheThe identified
identifiedrelationship
relationship of gust
of gust factor
factor versus
versus
sustained wind
sustained speed
wind speedappears
appears totobebesimilar
similar to that
thatofofSanta
Santa Ana’s
Ana’s ([3],([3], cf. their
cf. their Figure
Figure 11c). 11c).
Figure
Figure 4. Average
4. Average number
number of of daily
daily Diablo-likeevents
Diablo-like events per
perstation
stationper year
per versus
year station
versus elevation
station (a), (a),
elevation
average hourly Diablo-like events per area, as function of the hour, (b), average daily Diablo-like
average hourly Diablo-like events per area, as function of the hour, (b), average daily Diablo-like events
events
per area, as per area, as of
a function a function of the
the month of month of the
the year, year,area
(c) the (c) the areagust
mean mean gust factor,
factor, as a function
as a function of theofwind
the wind speed bin for Diablo-like days per area, and (d) all observations not meeting the criteria.
speed bin for Diablo-like days per area, and (d) all observations not meeting the criteria.Fire 2018, 1, 25 7 of 9
Fire 2018, 1, x FOR PEER REVIEW 7 of 9
Figure 5. 5.Daily
Figure Daily Diablo-like eventdepartures
Diablo-like event departures fromfrom Julian
Julian day climatology
day climatology on a peronstation
a per basis
station basis
for the
fornorth
the north
of Bay of Area
Bay Area
(NoBA;(NoBA; red)western
red) and and western
Sierra Sierra
NevadaNevada (SN;area
(SN; blue) blue) area observations
observations of: Dailyof:
Daily minimum
minimum andand maximum
maximum relative
relative humidity
humidity (a), minimum
(a), daily daily minimum and maximum
and maximum temperature
temperature (b), daily(b),
maximum
daily maximum windwind
speedspeed
and wind
and speed
wind gust
speed(c),gust
and daily maximum
(c), and wind speedwind
daily maximum versus dailyversus
speed maximum daily
wind speed
maximum windgust (d). The
speed gustdiagonal
(d). Theblack line in
diagonal (d) corresponds
black to a gust factor
line in (d) corresponds to aslope
gustoffactor
1.7. slope of 1.7.
4. Summary
4. Summary and
and Conclusions
Conclusions
During the October 2017 Northern California Firestorm, Diablo winds were thrust to the
During the October 2017 Northern California Firestorm, Diablo winds were thrust to the forefront
forefront of the public consciousness and the broader wildfire meteorology community as a
of the public consciousness and the broader wildfire meteorology community as a meteorological
meteorological phenomenon, about which little is known. Our analysis showed that conditions
phenomenon, about which little is known. Our analysis showed that conditions similar to Diablo
similar to Diablo winds tend to occur at night or in the early morning and are most common during
winds tend to occur at night or in the early morning and are most common during the cool season
the cool season (late fall through spring). However, our analysis is somewhat constrained by the
(late fall through spring). However, our analysis is somewhat constrained by the binary nature
binary nature of our criteria, and we did not consider the eastern San Francisco Bay Area nor the San
of our criteria,
Francisco and weFurther
Peninsula. did notresearch
consider the eastern
is required San Francisco
to address Bay posed
many issues Area nor thesparse
by the San Francisco
RAWS
Peninsula.
network Further research
used in this is including
study, required totheaddress many
production issues
and posed
analysis of by the sparsehigh
a long-term, RAWS network
resolution
used in this study, including
downscaled numerical climatology.the production and analysis of a long-term, high resolution downscaled
numerical climatology.
Of the total number of Diablo-like wind conditions, identified on a daily basis per area, 35%
Of the north
occurred total ofnumber
the San of Diablo-like
Francisco wind
Bay area conditions,
only, 41% occurredidentified on a daily
in the western Sierra basis
Nevada per area,
only,
35% occurred north of the San Francisco Bay area only, 41% occurred in the western Sierra
and 23% occurred in both areas. Thus, conditions similar to Diablo winds appear to be just as common Nevada
only, and 23% occurred in both areas. Thus, conditions similar to Diablo winds appear to be just asFire 2018, 1, 25 8 of 9
common in the Sierra Nevada as they are in the area north of the San Francisco Bay Area. This implies
that they are a regional wind system of Northern California and not a local phenomenon of the
San Francisco Bay Area. This indicates that wildfire fighting resources may be required throughout
Northern California, including the western Sierra Nevada, when conditions similar to Diablo winds
are forecast. Since historical usage of the term Diablo winds was initially confined to the Oakland
Hills, it might be more appropriate to refer to Diablo-like wind conditions in the Sierra Nevada as
“Diablos del Sierra” or “Bruja” winds. Associated numerical weather simulations (not shown) strongly
suggest the downstream linking of mountain wave breaking over the Sierra Nevada to Diablo wind
conditions north of the San Francisco Bay Area. We hypothesize that this mechanism drives Diablo-like
wind conditions in both areas and that vertical profiles of wind speed and stability, east of the Sierra
Nevada, play a primary role in determining the altitude at which the Sierra downslope jet is lofted off
the surface and control of the characteristics of Diablo winds in the San Francisco Bay Area.
Author Contributions: C.S. conceptualized and executed the analysis. B.J.H. and M.K. contributed to improving
the analysis and writing. C.S. and M.K. contributed to funding Acquisition.
Funding: This research was funded by National Science Foundation Grant AGS-1419267.
Conflicts of Interest: The authors declare no conflict of interest.
References
1. Abatzaglou, J.T.; Barbero, R.; Nauslar, N.J. Diagnosing Santa Ana winds in Southern California with
synoptic-scale analysis. Weather Forecast. 2013, 28, 704–710. [CrossRef]
2. Cao, Y.; Fovell, R.G. Downslope Windstorms of San Diego County. Part I: A Case Study. Mon. Weather Rev.
2016, 144, 529–552. [CrossRef]
3. Cao, Y.; Fovell, R.G. Downslope Windstorms of San Diego County. Part II: Physics ensemble analyses and
gust forecasting. Weather Forecast. 2017, 33, 539–559. [CrossRef]
4. Fovell, R.G.; Cao, Y. The Santa Ana winds of Southern California: Winds, gusts, and the 2007 Witch fire.
Wind Struct. 2017, 24, 529–564. [CrossRef]
5. Guzman-Morales, J.; Gershunov, A.; Theiss, J.; Li, H.; Cayan, D. Santa Ana winds of southern California:
Their climatology, extremes, and behavior spanning six and a half decades. Geophys. Res. Lett. 2016, 43,
2827–2834. [CrossRef]
6. Huang, C.; Lin, Y.-L.; Kaplan, M.L.; Charney, J.J. Synoptic-scale and mesoscale environments conducive to
forest fires during the October 2003 extreme fire event in Southern California. J. Appl. Meteor. Climatol. 2009,
48, 553–559. [CrossRef]
7. Hughes, M.; Hall, A. Local and synoptic mechanisms causing Southern California’s Santa Ana winds.
Clim. Dyn. 2010, 34, 847–857. [CrossRef]
8. Raphael, M. The Santa Ana winds of California. Earth Interact. 2003, 7, 1–13. [CrossRef]
9. Rolinski, T.; Capps, S.B.; Fovell, R.G.; Cao, Y.; D’angostino, B.J.; Vanderburg, S. The Santa Ana Wildfire Threat
Index: Methodology and operational implementation. Weather Forecast. 2016, 31, 1881–1897. [CrossRef]
10. Westerling, A.L.; Cayan, D.R.; Brown, T.J.; Hall, B.L.; Riddle, L.G. Climate, Santa Ana Winds and autumn
wildfires in southern California. Eos Trans. AGU 2004, 85, 289–296. [CrossRef]
11. Blier, W. The Sundowner winds of Santa Barbara, California. Weather Forecast. 1998, 13, 702–716. [CrossRef]
12. Cannon, F.; Carvalho, L.M.V.; Jones, C.; Hall, T.; Gomberg, D.; Dumas, J.; Jackson, M. WRF simulation of
downslope wind events in coastal Santa Barbara County. Atmos. Res. 2017, 191, 57–73. [CrossRef]
13. Hatchett, B.J.; Smith, C.M.; Nauslar, N.J.; Kaplan, M.L. Differences between Sundowner and Santa Ana wind
regimes in the Santa Ynez Mountains, California. Nat. Hazards Earth Syst. Sci. 2018, 18, 419–427. [CrossRef]
14. Smith, C.M.; Hatchett, B.J.; Kaplan, M.L. Characteristics of Sundowner winds near Santa Barbara CA
from a dynamically downscaled climatology. Part I: Environment and effects near the surface. J. Appl.
Meteorol. Climatol. 2018, 57, 589–606. [CrossRef]
15. Smith, C.M.; Hatchett, B.J.; Kaplan, M.L. Characteristics of Sundowner winds near Santa Barbara CA from
a dynamically downscaled climatology. Part II: Environment and effects aloft. J. Geophys. Res. Atmos.
2018, submitted.Fire 2018, 1, 25 9 of 9
16. Monteverdi, J.P. The Santa Ana weather type and extreme fire hazard in the Oakland-Berkeley Hills.
Weathewise 1973, 26, 118–121. [CrossRef]
17. Trelles, J.; Pagni, P.J. Fire induced winds in the 20 October 1991 Oakland Hills Fire. Fire Saf. Sci. 1997, 5,
911–922. [CrossRef]
18. Pagni, P.J. Causes of the 20 October 1991 Oakland hills conflagration. Fire Saf. J. 1993, 21, 331–339. [CrossRef]
19. Koo, E.; Pagni, P.J.; Weise, D.R.; Woycheese, J.P. Firebrands and spotting ignition in large-scale fires. Int. J.
Wildland Fire 2010, 19, 818–843. [CrossRef]
20. Null, J.; Mogil, H.M. The Weather and Climate of California. Weatherwise 2010, 63, 16–23. [CrossRef]
21. Routley, J.G. The East-Bay Hills Fire; United States Fire Administration Technical Report 060; Federal
Emergency Management Administration: Emmitsburg, MD, USA, 1991.
© 2018 by the authors. Licensee MDPI, Basel, Switzerland. This article is an open access
article distributed under the terms and conditions of the Creative Commons Attribution
(CC BY) license (http://creativecommons.org/licenses/by/4.0/).You can also read